Cited by 291Antifungal resistance and susceptibilityFungal and yeast genetics researchBacterial biofilms and quorum sensing

The DOI matches its Crossref record; 59 of the 59 references it cites were found in a registry or an index.

A Candida Biofilm-Induced Pathway for Matrix Glucan Delivery: Implications for Drug Resistance

Open access
Taff, Heather T., Nett, Jeniel E., Zarnowski, Robert, Ross, Kelly M., Sanchez, Hiram, Cain, Mike T., Hamaker, Jessica, Mitchell, Aaron P., Andes, David R.·2012·PLoS Pathogens

Abstract

Extracellular polysaccharides are key constituents of the biofilm matrix of many microorganisms. One critical carbohydrate component of Candida albicans biofilms, β-1,3 glucan, has been linked to biofilm protection from antifungal agents. In this study, we identify three glucan modification enzymes that function to deliver glucan from the cell to the extracellular matrix. These enzymes include two predicted glucan transferases and an exo-glucanase, encoded by BGL2, PHR1, and XOG1, respectively. We show that the enzymes are crucial for both delivery of β-1,3 glucan to the biofilm matrix and for accumulation of mature matrix biomass. The enzymes do not appear to impact cell wall glucan content of biofilm cells, nor are they necessary for filamentation or biofilm formation. We demonstrate that mutants lacking these genes exhibit enhanced susceptibility to the commonly used antifungal, fluconazole, during biofilm growth only. Transcriptional analysis and biofilm phenotypes of strains with multiple mutations suggest that these enzymes act in a complementary fashion to distribute matrix downstream of the primary β-1,3 glucan synthase encoded by FKS1. Furthermore, our observations suggest that this matrix delivery pathway works independently from the C. albicans ZAP1 matrix formation regulatory pathway. These glucan modification enzymes appear to play a biofilm-specific role in mediating the delivery and organization of mature biofilm matrix. We propose that the discovery of inhibitors for these enzymes would provide promising anti-biofilm therapeutics.

Overview

The claims and statistics of this paper haven’t been checked yet.

Run the check — free, no account needed. It reads the open-access text and checks the sources it cites.

A few free checks a day · papers already verified open instantly · results are public

Integrity signals

Registry

Crossref · 10.1371/journal.ppat.1002848

Cites

59 of 59 references verified0 citation errors · 0 not checkable

Statistics

Figures

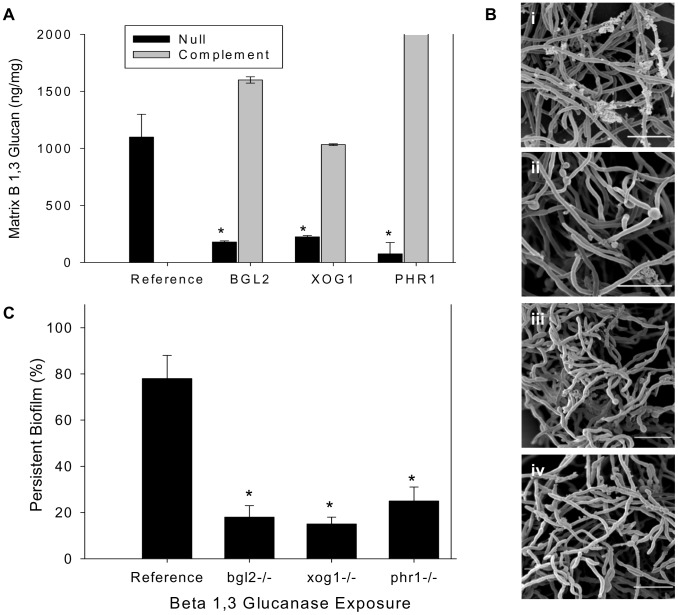
Figure 1 Analysis of biofilm matrix. (A) Mature in vitro biofilms from the reference strain, bgl2−/−, xog1−/−, and phr1−/− null mutants, and complemented strains were assayed for matrix β-1,3 glucan concentration using a β-1,3 glucan ELISA. The figure represents data from three biologic and three assay replicates. The * symbol indicates that glucan measurements were significantly different (p value<0.0001) based upon ANOVA compared to the reference strain. (B) Matrix abundance from mature in vitro biofilms produced by the reference and bgl2−/−, xog1−/−, and phr1−/− mutant strains was estimated visually by SEM imaging. Scale bars represent 20 µm. (C) Mature biofilm disaggregation was measured following matrix exposure to β-1,3 glucanase (2.5 units/ml) in reference and bgl2−/−, xog1−/−, and phr1−/− mutant strains. The non-disaggregated cells were measured using the XTT assay. The * symbol indicates biofilm biomass measurements were significantly different compared to the reference strain (p value<0.01) based upon ANOVA.
Figure 1 Analysis of biofilm matrix. (A) Mature in vitro biofilms from the reference strain, bgl2−/−, xog1−/−, and phr1−/− null mutants, and complemented strains were assayed for matrix β-1,3 glucan concentration using a β-1,3 glucan ELISA. The figure represents data from three biologic and three assay replicates. The * symbol indicates that glucan measurements were significantly different (p value<0.0001) based upon ANOVA compared to the reference strain. (B) Matrix abundance from mature in vitro biofilms produced by the reference and bgl2−/−, xog1−/−, and phr1−/− mutant strains was estimated visually by SEM imaging. Scale bars represent 20 µm. (C) Mature biofilm disaggregation was measured following matrix exposure to β-1,3 glucanase (2.5 units/ml) in reference and bgl2−/−, xog1−/−, and phr1−/− mutant strains. The non-disaggregated cells were measured using the XTT assay. The * symbol indicates biofilm biomass measurements were significantly different compared to the reference strain (p value<0.01) based upon ANOVA.CC BY · PubMed Central
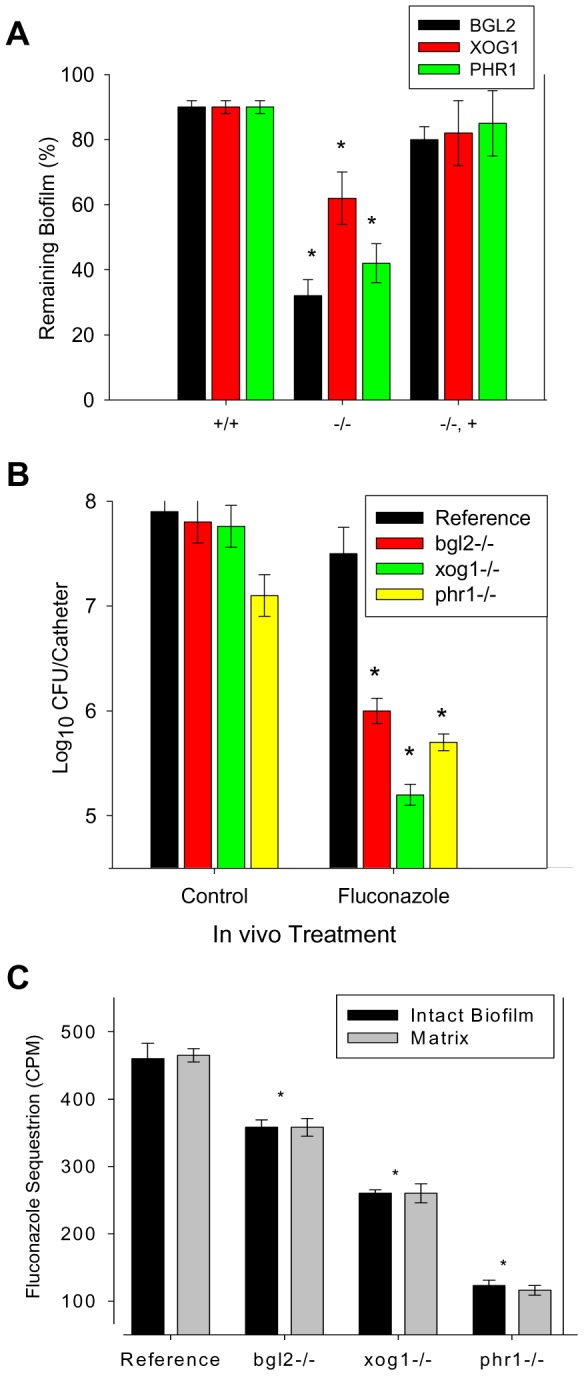
Figure 2 Biofilm drug susceptibility and matrix drug sequestration. (A) Mature in vitro biofilms from the reference strain and bgl2−/−, xog1−/−, and phr1−/− null mutants and complemented strains were assayed for fluconazole susceptibility using the 96-well XTT assay. The figure represents data from three assay replicates of a representative example of 3 biological replicates of the 250 µg/ml fluconazole exposure. (B) Mature in vivo biofilms from the reference strain and bgl2−/−, xog1−/−, and phr1−/− null mutants were grown on the rat central venous catheter model and then exposed to a dwell of 250 µg/ml of fluconazole or 0.15 M NaCl for 24 h. Following sonication, the burden of remaining biofilm cells was assayed using viable plate counts. The figure represents the mean and standard deviation from three replicates. The * symbol indicates CFUs were significantly different from the reference strain (p value<0.01) based upon ANOVA. (C) Intact biofilms grown from the reference and glucan modifier mutant strains were exposed to [H3]fluconazole, washed, and harvested. Scintillation counting was performed in triplicate to determine the fluconazole content in the intact biofilms and the isolated matrix. Standard deviations are shown. The * symbol indicates glucan measurements were significantly different (p value<0.03) based upon ANOVA.
Figure 2 Biofilm drug susceptibility and matrix drug sequestration. (A) Mature in vitro biofilms from the reference strain and bgl2−/−, xog1−/−, and phr1−/− null mutants and complemented strains were assayed for fluconazole susceptibility using the 96-well XTT assay. The figure represents data from three assay replicates of a representative example of 3 biological replicates of the 250 µg/ml fluconazole exposure. (B) Mature in vivo biofilms from the reference strain and bgl2−/−, xog1−/−, and phr1−/− null mutants were grown on the rat central venous catheter model and then exposed to a dwell of 250 µg/ml of fluconazole or 0.15 M NaCl for 24 h. Following sonication, the burden of remaining biofilm cells was assayed using viable plate counts. The figure represents the mean and standard deviation from three replicates. The * symbol indicates CFUs were significantly different from the reference strain (p value<0.01) based upon ANOVA. (C) Intact biofilms grown from the reference and glucan modifier mutant strains were exposed to [H3]fluconazole, washed, and harvested. Scintillation counting was performed in triplicate to determine the fluconazole content in the intact biofilms and the isolated matrix. Standard deviations are shown. The * symbol indicates glucan measurements were significantly different (p value<0.03) based upon ANOVA.CC BY · PubMed Central
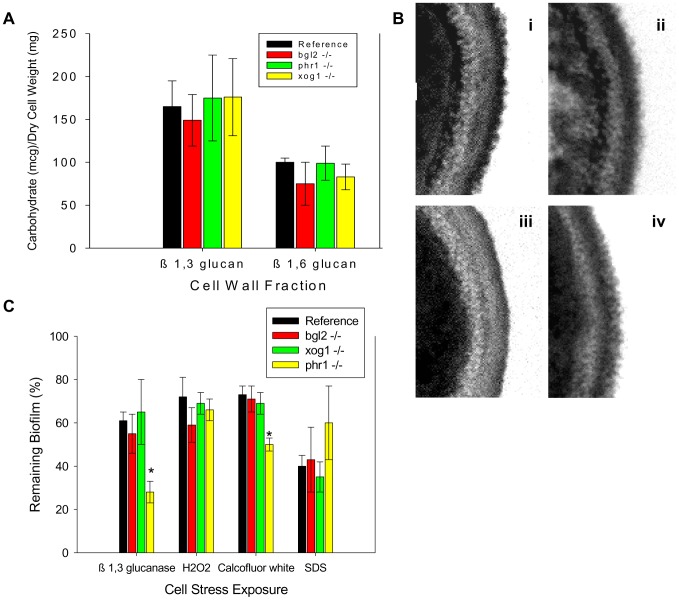
Figure 3 Impact of glucan modification enzyme mutants on cell wall composition and function of biofilm cells. (A) Cell walls from reference strain, bgl2−/−, xog1−/−, and phr1−/− mutant biofilms were isolated and fractionated by alkali treatment and enzymatic digestion. ANOVA with pairwise comparisons using the Holm-Sidak method was used to compare the β-1,3 glucan and β-1,6 glucan fractions among the strains *, p<0.05. Assays were performed in triplicate on two occasions. Standard deviations are shown. (B) Reference strain (i) and bgl2−/− (ii), xog1−/− (iii), and phr1−/− (iv) mutant biofilms were collected from 6-well polystyrene plates and imaged using TEM. Scale bars represent 0.25 um. (C) Reference strain and bgl2−/−, xog1−/−, and phr1−/− mutant biofilms were treated with serial dilutions of β-1,3 glucanase, H2O2, calcofluor white, or SDS. Compound impact was determined using an XTT reduction assay. Data are expressed as percent remaining biofilm compared to untreated controls. Standard errors are shown. ANOVA with pairwise comparisons using the Holm-Sidak method was used to compare the mutant strains at each drug concentration *, p<0.05.
Figure 3 Impact of glucan modification enzyme mutants on cell wall composition and function of biofilm cells. (A) Cell walls from reference strain, bgl2−/−, xog1−/−, and phr1−/− mutant biofilms were isolated and fractionated by alkali treatment and enzymatic digestion. ANOVA with pairwise comparisons using the Holm-Sidak method was used to compare the β-1,3 glucan and β-1,6 glucan fractions among the strains *, p<0.05. Assays were performed in triplicate on two occasions. Standard deviations are shown. (B) Reference strain (i) and bgl2−/− (ii), xog1−/− (iii), and phr1−/− (iv) mutant biofilms were collected from 6-well polystyrene plates and imaged using TEM. Scale bars represent 0.25 um. (C) Reference strain and bgl2−/−, xog1−/−, and phr1−/− mutant biofilms were treated with serial dilutions of β-1,3 glucanase, H2O2, calcofluor white, or SDS. Compound impact was determined using an XTT reduction assay. Data are expressed as percent remaining biofilm compared to untreated controls. Standard errors are shown. ANOVA with pairwise comparisons using the Holm-Sidak method was used to compare the mutant strains at each drug concentration *, p<0.05.CC BY · PubMed Central
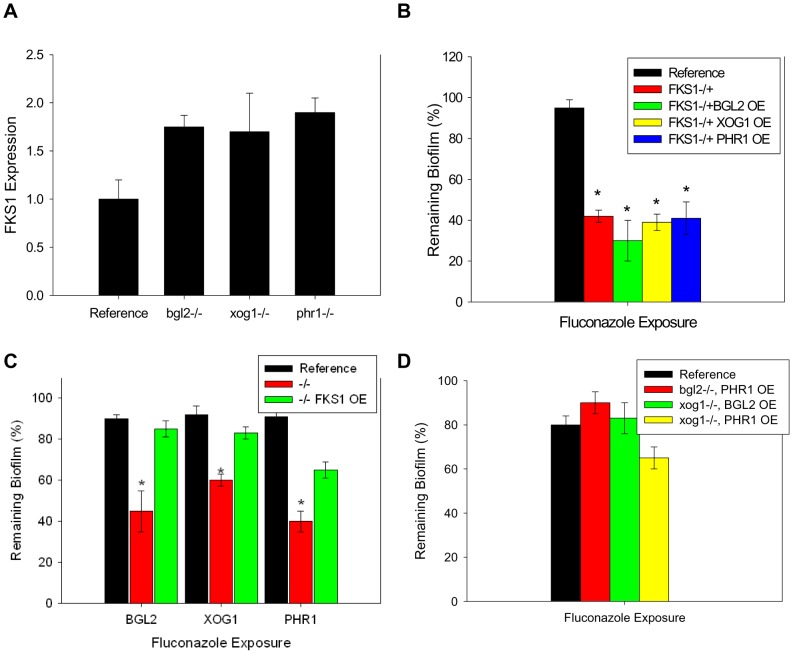
Figure 4 Relationship between β-1,3 glucan synthase and modification enzymes during biofilm growth. (A) RNA was isolated from reference and bgl2−/−, xog1−/−, and phr1−/− mutant biofilms. Real-time RT-PCR assays were used to measure transcript levels in triplicate. Data are shown as a normalized ratio of transcript in the mutant strain to that in the reference strain. (B) The glucan modifier genes, BGL2, XOG1, and PHR1 were placed under the control of an inserted TDH3 promoter for overexpression of these genes in the homozygous FKS1−/+ mutant. Biofilms were treated with serial dilutions of fluconazole for 48 h (250 µg/ml shown), and drug impact was determined using an XTT reduction assay. The * symbol indicates biofilm susceptibilities were significantly different (p value<0.008) based upon ANOVA with pairwise comparison. (C) The FKS1 gene was placed under the control of an inserted TDH3 promoter for overexpression of this genes in the bgl2−/−, xog1−/−, and phr1−/− mutants. Biofilms were treated with serial dilutions of fluconazole for 48 h (250 µg/ml shown) and drug impact was determined using an XTT reduction assay. (D) The glucan modifier genes, BGL2, XOG1, and PHR1 were placed under the control of an inserted TDH3 promoter for overexpression of these genes in each of the homozygous bgl2−/−, xog1−/−, and phr1−/− mutants. Biofilms were treated with serial dilutions of fluconazole for 48 h (250 µg/ml shown) and drug impact was determined using an XTT reduction assay. Data for all XTT assays above are expressed as percent reduction compared to untreated controls. Standard errors are shown. Student's t test was used for (C) and (D) to compare the mutant strains at each drug concentration *, p<0.05.
Figure 4 Relationship between β-1,3 glucan synthase and modification enzymes during biofilm growth. (A) RNA was isolated from reference and bgl2−/−, xog1−/−, and phr1−/− mutant biofilms. Real-time RT-PCR assays were used to measure transcript levels in triplicate. Data are shown as a normalized ratio of transcript in the mutant strain to that in the reference strain. (B) The glucan modifier genes, BGL2, XOG1, and PHR1 were placed under the control of an inserted TDH3 promoter for overexpression of these genes in the homozygous FKS1−/+ mutant. Biofilms were treated with serial dilutions of fluconazole for 48 h (250 µg/ml shown), and drug impact was determined using an XTT reduction assay. The * symbol indicates biofilm susceptibilities were significantly different (p value<0.008) based upon ANOVA with pairwise comparison. (C) The FKS1 gene was placed under the control of an inserted TDH3 promoter for overexpression of this genes in the bgl2−/−, xog1−/−, and phr1−/− mutants. Biofilms were treated with serial dilutions of fluconazole for 48 h (250 µg/ml shown) and drug impact was determined using an XTT reduction assay. (D) The glucan modifier genes, BGL2, XOG1, and PHR1 were placed under the control of an inserted TDH3 promoter for overexpression of these genes in each of the homozygous bgl2−/−, xog1−/−, and phr1−/− mutants. Biofilms were treated with serial dilutions of fluconazole for 48 h (250 µg/ml shown) and drug impact was determined using an XTT reduction assay. Data for all XTT assays above are expressed as percent reduction compared to untreated controls. Standard errors are shown. Student's t test was used for (C) and (D) to compare the mutant strains at each drug concentration *, p<0.05.CC BY · PubMed Central
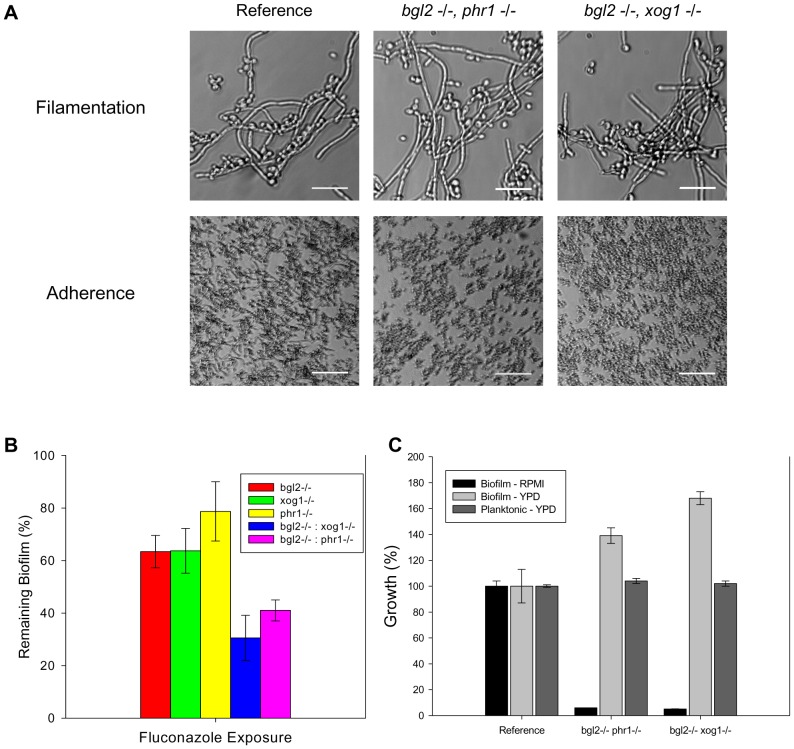
Figure 5 Analysis of glucan modifier double knockout strains. (A) The glucan modifier double knockout strains and the reference strain were assayed for filamentation in YPD. Representative images from light microscopy are shown (top row). The strains were also assayed for adherence to coverslips following 2 h incubation. Representative light micrographs are shown (bottom row). (B) The double knockouts were examined for overall biofilm growth in both YPD and RPMI by comparing the ODs of the untreated control with those of the reference strain in an XTT assay. Strains were also examined for relative planktonic growth in YPD using a turbidity endpoint. (C) The glucan modifier double knockout strains (bgl2−/− phr1−/− and bgl2−/− xog1−/−), the modifier single knockouts, and the reference strain were assayed for biofilm susceptibility to fluconazole (125 µg/ml shown) using the XTT assay as described above. Data for all XTT assays above are expressed as percent reduction compared to untreated controls. Standard errors are shown.
Figure 5 Analysis of glucan modifier double knockout strains. (A) The glucan modifier double knockout strains and the reference strain were assayed for filamentation in YPD. Representative images from light microscopy are shown (top row). The strains were also assayed for adherence to coverslips following 2 h incubation. Representative light micrographs are shown (bottom row). (B) The double knockouts were examined for overall biofilm growth in both YPD and RPMI by comparing the ODs of the untreated control with those of the reference strain in an XTT assay. Strains were also examined for relative planktonic growth in YPD using a turbidity endpoint. (C) The glucan modifier double knockout strains (bgl2−/− phr1−/− and bgl2−/− xog1−/−), the modifier single knockouts, and the reference strain were assayed for biofilm susceptibility to fluconazole (125 µg/ml shown) using the XTT assay as described above. Data for all XTT assays above are expressed as percent reduction compared to untreated controls. Standard errors are shown.CC BY · PubMed Central
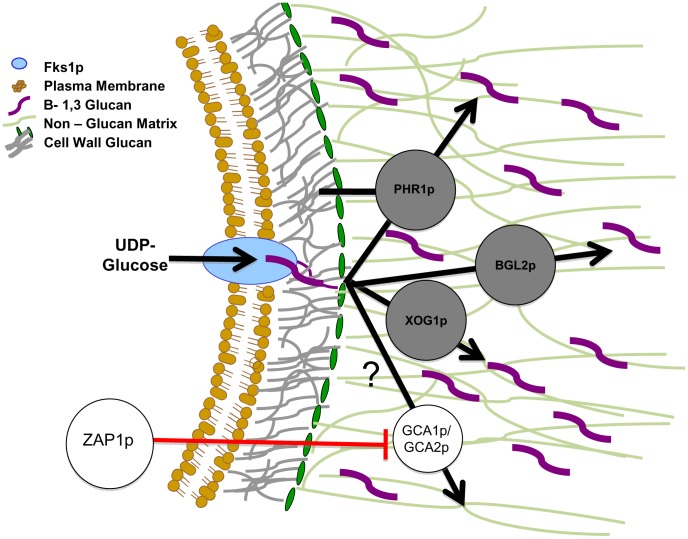
Figure 6 Proposed model for glucan matrix production and delivery to the biofilm matrix. The cell membrane-bound FKS1p is responsible for β-1,3 glucan production. This glucan is modified and incorporated into both the cell wall and the extracellular matrix. It is proposed that PHR1p, BGL2p, and XOG1p are responsible for the delivery and arrangement of β-1,3 glucans in the matrix and that they act independently of the cell wall arrangement pathway. We theorize PHR1p, BGL2p, and XOG1p act in a complementary fashion and independently of the ZAP1p matrix production pathway, which includes the glucoamylases GCA1p and GCA2p [31]. The glucan modification proteins are shown in the extracellular matrix based upon our matrix proteomic results. It is possible they are also located in the cell wall. We have not represented this possibility in the absence of these experimental results. Black arrows represent the proposed pathway taken by glucan from synthase product to the modified sugars that are incorporated into biofilm matrix. The circles represent production or modification enzymes that act upon carbohydrate substrates. Matrix glucans are highlighted in purple to distinguish from cell wall glucan (colored grey). Red lines represent inhibition of enzymes by transcription factors.
Figure 6 Proposed model for glucan matrix production and delivery to the biofilm matrix. The cell membrane-bound FKS1p is responsible for β-1,3 glucan production. This glucan is modified and incorporated into both the cell wall and the extracellular matrix. It is proposed that PHR1p, BGL2p, and XOG1p are responsible for the delivery and arrangement of β-1,3 glucans in the matrix and that they act independently of the cell wall arrangement pathway. We theorize PHR1p, BGL2p, and XOG1p act in a complementary fashion and independently of the ZAP1p matrix production pathway, which includes the glucoamylases GCA1p and GCA2p [31]. The glucan modification proteins are shown in the extracellular matrix based upon our matrix proteomic results. It is possible they are also located in the cell wall. We have not represented this possibility in the absence of these experimental results. Black arrows represent the proposed pathway taken by glucan from synthase product to the modified sugars that are incorporated into biofilm matrix. The circles represent production or modification enzymes that act upon carbohydrate substrates. Matrix glucans are highlighted in purple to distinguish from cell wall glucan (colored grey). Red lines represent inhibition of enzymes by transcription factors.CC BY · PubMed Central

Verification

Claims the paper makes

The claims and statistics of this paper haven’t been checked yet.

Run the check — free, no account needed. It reads the open-access text and checks the sources it cites.

A few free checks a day · papers already verified open instantly · results are public

Claims other papers make about this one

Each is checked against this paper’s own text: does it say what the citing paper says it does?

Self-check

Percentages, sums and reported differences re-computed from the paper’s own numbers.

The self-check needs the paper’s full text.

Citations

Cites

Show all 59 references

Research works printed but not linked: 2

  1. [32]Nett JE, Crawford K, Marchillo K, Andes DR (2010) Role of Fks1p and matrix glucan in Candida albicans biofilm resistance to an echinocandin, pyrimidine, and polyene. Antimicrob Agents Chemother 54: 3505– 3508. 20516280 PMC2916329
  2. [51]Nett JE, Sanchez H, Cain MT, Andes DR (2010) Genetic basis of Candida biofilm resistance due to drug-sequestering matrix glucan. J Infect Dis 202: 171– 175. 20497051 PMC2880631

Cited by

Sorted by citations

See all 291

Metadata

Authors
Taff, H. T., Nett, J. E., Zarnowski, R., Ross, K. M., Sanchez, H., Cain, M. T., Hamaker, J., Mitchell, A. P., & Andes, D. R.
Affiliations
  • University of Wisconsin–Madison (US)
  • Columbia University (US)
  • Carnegie Mellon University (US)
Corresponding author
Andes, David R.
Venue
PLoS Pathogens
Published
2012-08-02
Volume
8
Issue
8
Pages
e1002848
ISSN
  • 1553-7366 (ISSN-L)
  • 1553-7374
OpenAlex
W2124380402
Cited by
291
References
59
Citations by year
2026: 14 · 2025: 23 · 2024: 13 · 2023: 31 · 2022: 21 · 2021: 16 · 2020: 18 · 2019: 16 · 2018: 15 · 2017: 21 · 2016: 32 · 2015: 28 · 2014: 20 · 2013: 21 · 2012: 2
FWCI
14.64
Type
journal article
Language
en
Open access
Locations
  • PLoS Pathogens (publishedVersion, cc-by)
  • Europe PMC (PubMed Central) (publishedVersion, cc-by)
  • PubMed Central (publishedVersion, cc-by)
  • PubMed (publishedVersion)
  • DOAJ (DOAJ: Directory of Open Access Journals) (submittedVersion, cc-by-sa)
Funders
  • National Institutes of Health (NIH-R01)
  • National Heart, Lung, and Blood Institute (T32HL007899)
  • National Institute of General Medical Sciences (T32GM008692)
  • National Institute of Allergy and Infectious Diseases (R01AI067703, R01AI073289)
Topics
  • Health Sciences › Medicine › Infectious Diseases › Antifungal resistance and susceptibility
  • Life Sciences › Biochemistry, Genetics and Molecular Biology › Molecular Biology › Fungal and yeast genetics research
  • Life Sciences › Biochemistry, Genetics and Molecular Biology › Molecular Biology › Bacterial biofilms and quorum sensing
Keywords
Candida albicans, biofilm matrix, β-1,3-glucan, BGL2, PHR1, FKS1, fluconazole susceptibility, antifungal resistance, exopolysaccharides, biofilm formation, Zap1
MeSH terms
Animals, Candida albicans, Candidiasis, Fungal Proteins, Glucans, Glucosyltransferases, Membrane Glycoproteins, Mutation, Biofilms, Drug Resistance, Fungal, Rats

About these checks

Registry, retraction, Cites and statistics results are computed, not judged, with one exception: a printed reference that no index lists is read once by a model before it counts as a citation error. Claims are extracted by a model and kept only when their quote appears verbatim in the text; each cited source is then checked, with a model’s help, for whether it says what the claim relies on. Those verdicts can be wrong — read the claim’s quote and the cited source before relying on one.

Statistics and arithmetic are recomputed, not judged.

Confidence bands are shown only for fields calibrated on our annotated test set. None is calibrated yet, so no band is shown.

What counts as a claim ›How we measure confidence ›How we check this ›

Are you an author, or do you see a problem with this page? Request a review