Cited by 84

The DOI matches its Crossref record; 8 of the 8 references it cites were found in a registry or an index.

Mycobacterium marinum antagonistically induces an autophagic response while repressing the autophagic flux in a TORC1- and ESX-1-dependent manner

Cardenal-Muñoz, Elena, Arafah, Sonia, López-Jiménez, Ana Teresa, Kicka, Sébastien, Falaise, Alexandra, Bach, Frauke, Schaad, Olivier, King, Jason S., Hagedorn, Monica, Soldati, Thierry·2017·PLOS Pathogens

Overview

The claims and statistics of this paper haven’t been checked yet.

Run the check — free, no account needed. It reads the open-access text and checks the sources it cites.

A few free checks a day · papers already verified open instantly · results are public

Integrity signals

Registry

Crossref · 10.1371/journal.ppat.1006344

Cites

8 of 8 references verified0 citation errors · 0 not checkable

Statistics

Figures

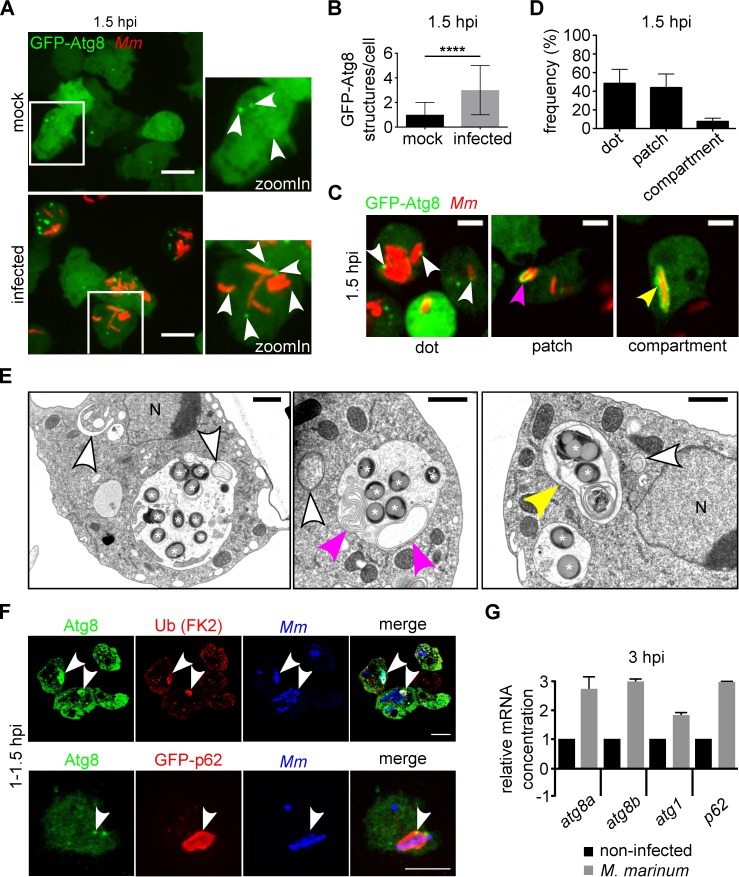
Fig 1 M. marinum induces an early autophagic response in D. discoideum. A. Two representative maximum projections showing GFP-Atg8-expressing cells infected (bottom) or mock-infected (top) with mCherry-expressing wt M. marinum. Images were recorded live 1.5 h after infection. White arrowheads point to GFP-Atg8 structures. Scale bars, 10 μm; B. The median and interquartile ranges of the number of GFP-Atg8 structures per cell were calculated. For each condition, 300 cells from independent triplicates were counted. Mann-Whitney test (****p ≤ 0.0001); C. Single sections of live GFP-Atg8-expressing amoebae 1.5 h after infection with mCherry-expressing M. marinum wt. White, magenta and yellow arrowheads point to GFP-Atg8 dots, patches and GFP-Atg8-positive (GFP-Atg8+) MCV, respectively. Scale bars, 5 μm; D. At 1.5 hpi, 256 cells (100%) with GFP-Atg8+ M. marinum were classified as in C. Means and standard deviations from three independent infections are represented; E. EM of the different types of autophagosomes in the vicinity of the MCV at 7 hpi. White asterisks label bacteria, white arrowheads point to round phagophores and autophagosomes, magenta arrowheads point to extended autophagosomes, and the yellow arrowhead indicates a double membrane compartment containing mycobacteria. Nuclei <N>. Scale bars, 1 μm; F. Sections (top) and maximum projections (bottom) showing co-localization (white arrowheads) of autophagy markers with bacteria at 1–1.5 hpi. Around 50% and 30% of the Atg8-positive bacteria were also positive for Ub and GFP-p62, respectively. Scale bars, 5 μm; G. qPCR results of relative abundance of atg8a, atg8b, atg1 and p62 mRNAs at 3 hpi. The mRNA level in non-infected cells is indicated as 1. The mRNA level of the housekeeping gene gapdh was used for normalization. Means and standard deviations from three independent experiments performed in triplicates are represented.
Fig 1 M. marinum induces an early autophagic response in D. discoideum. A. Two representative maximum projections showing GFP-Atg8-expressing cells infected (bottom) or mock-infected (top) with mCherry-expressing wt M. marinum. Images were recorded live 1.5 h after infection. White arrowheads point to GFP-Atg8 structures. Scale bars, 10 μm; B. The median and interquartile ranges of the number of GFP-Atg8 structures per cell were calculated. For each condition, 300 cells from independent triplicates were counted. Mann-Whitney test (****p ≤ 0.0001); C. Single sections of live GFP-Atg8-expressing amoebae 1.5 h after infection with mCherry-expressing M. marinum wt. White, magenta and yellow arrowheads point to GFP-Atg8 dots, patches and GFP-Atg8-positive (GFP-Atg8+) MCV, respectively. Scale bars, 5 μm; D. At 1.5 hpi, 256 cells (100%) with GFP-Atg8+ M. marinum were classified as in C. Means and standard deviations from three independent infections are represented; E. EM of the different types of autophagosomes in the vicinity of the MCV at 7 hpi. White asterisks label bacteria, white arrowheads point to round phagophores and autophagosomes, magenta arrowheads point to extended autophagosomes, and the yellow arrowhead indicates a double membrane compartment containing mycobacteria. Nuclei <N>. Scale bars, 1 μm; F. Sections (top) and maximum projections (bottom) showing co-localization (white arrowheads) of autophagy markers with bacteria at 1–1.5 hpi. Around 50% and 30% of the Atg8-positive bacteria were also positive for Ub and GFP-p62, respectively. Scale bars, 5 μm; G. qPCR results of relative abundance of atg8a, atg8b, atg1 and p62 mRNAs at 3 hpi. The mRNA level in non-infected cells is indicated as 1. The mRNA level of the housekeeping gene gapdh was used for normalization. Means and standard deviations from three independent experiments performed in triplicates are represented.CC BY · PubMed Central
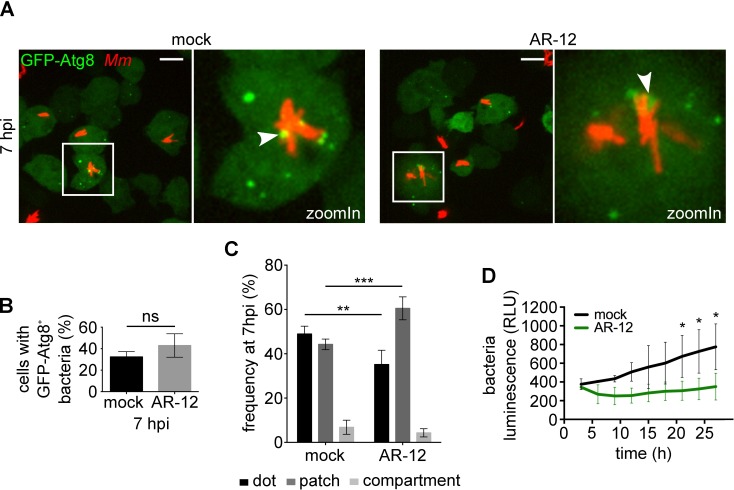
Fig 2 Artificial induction of autophagy restricts M. marinum proliferation. A. GFP-Atg8-expressing cells were infected for 5 h with mCherry-expressing M. marinum wt and treated or not with AR-12 at 2.5 μM for 2 additional hours. Representative maximum projections of live imaging are shown. White arrowheads point to GFP-Atg8 recruitment to MCV. Scale bars, 10 μm; B. Quantification of the percentage of infected cells with GFP-Atg8+ bacteria at 7 hpi. Means and standard deviations from six (mock) and three (AR-12) independent replicates are represented and an unpaired t test showed no statistical significance (ns, p > 0.05). 688 and 297 infected cells were counted for the mock and the AR-12 treatments, respectively; C. Classification of types of GFP-recruitment for infected mock (258 cells) and AR-12 (141 cells) treated. Means and standard deviations from six (mock) and three (AR-12) independent replicates are represented. Unpaired t test (**p ≤ 0.01; ***p ≤ 0.001); D. Cells infected with lux-expressing M. marinum wt bacteria were treated or not with AR-12 at 2.5 μM. Intracellular bacteria growth [relative luminescence units (RLU)] is represented as the mean and standard deviation from triplicates. Statistical differences were calculated with a Bonferroni post hoc test after two-way ANOVA (*p ≤ 0.05).
Fig 2 Artificial induction of autophagy restricts M. marinum proliferation. A. GFP-Atg8-expressing cells were infected for 5 h with mCherry-expressing M. marinum wt and treated or not with AR-12 at 2.5 μM for 2 additional hours. Representative maximum projections of live imaging are shown. White arrowheads point to GFP-Atg8 recruitment to MCV. Scale bars, 10 μm; B. Quantification of the percentage of infected cells with GFP-Atg8+ bacteria at 7 hpi. Means and standard deviations from six (mock) and three (AR-12) independent replicates are represented and an unpaired t test showed no statistical significance (ns, p > 0.05). 688 and 297 infected cells were counted for the mock and the AR-12 treatments, respectively; C. Classification of types of GFP-recruitment for infected mock (258 cells) and AR-12 (141 cells) treated. Means and standard deviations from six (mock) and three (AR-12) independent replicates are represented. Unpaired t test (**p ≤ 0.01; ***p ≤ 0.001); D. Cells infected with lux-expressing M. marinum wt bacteria were treated or not with AR-12 at 2.5 μM. Intracellular bacteria growth [relative luminescence units (RLU)] is represented as the mean and standard deviation from triplicates. Statistical differences were calculated with a Bonferroni post hoc test after two-way ANOVA (*p ≤ 0.05).CC BY · PubMed Central
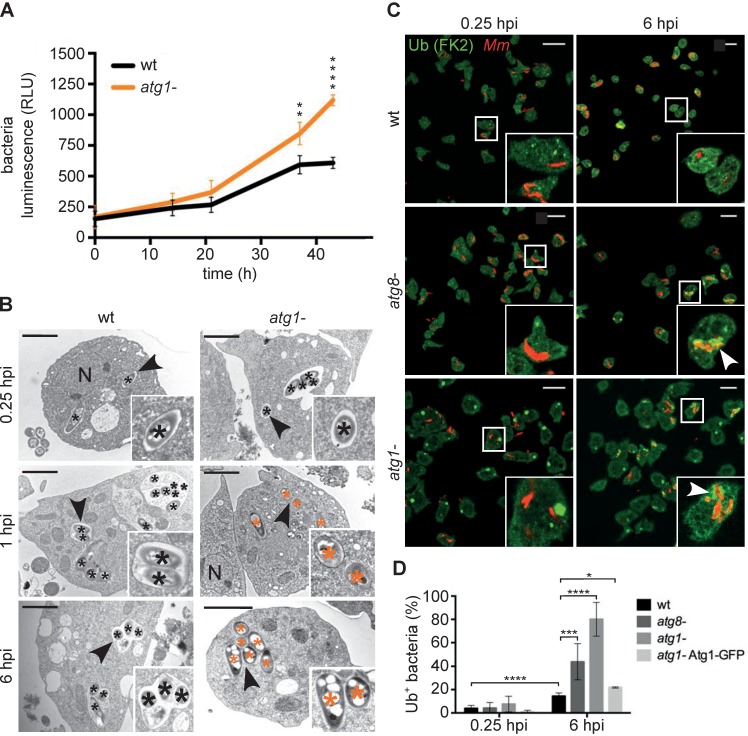
Fig 3 Autophagy is necessary for the maintenance of the MCV. A. The intracellular growth of lux-expressing M. marinum wt was monitored inside wt and atg1- cells. RLUs are represented as the mean and standard deviation from quadruplicates. Statistical differences were calculated with a Bonferroni post hoc test after two-way ANOVA (**p ≤ 0.01; (****p ≤ 0.0001); B. EM of the locations of M. marinum wt inside wt and atg1- cells at 0.25, 1 and 6 hpi. Black and orange asterisks label bacteria inside a compartment or in the cytosol, respectively. Black arrowheads mark the zoomIn. Nuclei <N>. Scale bars, 2 μm; C. D. discoideum wt, atg8- and atg1- cells were infected with mCherry-expressing M. marinum, fixed and stained against Ub (green) and mCherry (red). Representative maximum projections at 0.25 and 6 hpi are shown. White arrowheads label the ubiquitinated bacteria. Scale bars, 10 μm; D. Quantification of the percentage of intracellular bacteria/MCVs (red) positive for Ub (green) in wt, atg8-, atg1- and atg1-Atg1-GFP cells at 0.25 and 6 hpi. Means and standard deviations from 2–3 independent experiments. 128–299 infected cells were counted per time point and cell line. Unpaired t test (*p ≤ 0.05; ***p ≤ 0.001; **** p ≤ 0.0001).
Fig 3 Autophagy is necessary for the maintenance of the MCV. A. The intracellular growth of lux-expressing M. marinum wt was monitored inside wt and atg1- cells. RLUs are represented as the mean and standard deviation from quadruplicates. Statistical differences were calculated with a Bonferroni post hoc test after two-way ANOVA (**p ≤ 0.01; (****p ≤ 0.0001); B. EM of the locations of M. marinum wt inside wt and atg1- cells at 0.25, 1 and 6 hpi. Black and orange asterisks label bacteria inside a compartment or in the cytosol, respectively. Black arrowheads mark the zoomIn. Nuclei <N>. Scale bars, 2 μm; C. D. discoideum wt, atg8- and atg1- cells were infected with mCherry-expressing M. marinum, fixed and stained against Ub (green) and mCherry (red). Representative maximum projections at 0.25 and 6 hpi are shown. White arrowheads label the ubiquitinated bacteria. Scale bars, 10 μm; D. Quantification of the percentage of intracellular bacteria/MCVs (red) positive for Ub (green) in wt, atg8-, atg1- and atg1-Atg1-GFP cells at 0.25 and 6 hpi. Means and standard deviations from 2–3 independent experiments. 128–299 infected cells were counted per time point and cell line. Unpaired t test (*p ≤ 0.05; ***p ≤ 0.001; **** p ≤ 0.0001).CC BY · PubMed Central
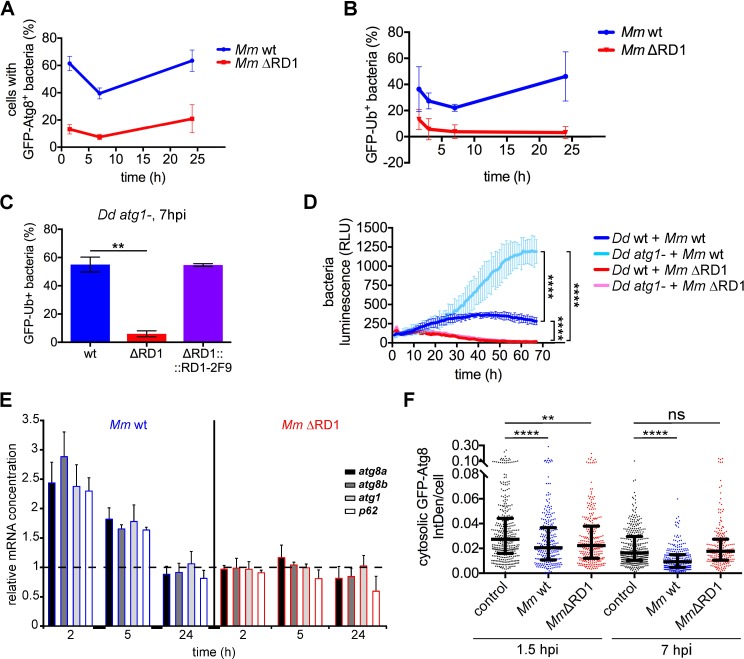
Fig 4 The early autophagic response caused by M. marinum infection is dependent on ESX-1. A. Percentage of cells containing GFP-Atg8+ M. marinum wt and ΔRD1 at 1.5, 7 and 24 hpi. Means and standard deviations from independent triplicates. A mean of 375 and 230 infected cells per time point was counted for M. marinum wt and ΔRD1 infection, respectively; B. Percentage of M. marinum wt and ΔRD1 bacteria positive for GFP-Ub. Mean and standard deviation from independent triplicates; C. GFP-Ub-expressing atg1- cells were infected with Vibrant DyeCycle Ruby-labelled M. marinum wt, ΔRD1 and ΔRD1::2F9. Means and standard deviations from independent duplicates of the percentage of bacteria positive for GFP-Ub at 7 hpi. A mean of 72–98 bacteria per infection was counted. Unpaired t test (**p ≤ 0.01); D. D. discoideum wt and atg1- cells were infected with lux-expressing M. marinum wt and ΔRD1. The intracellular bacteria growth (RLUs) from triplicates was monitored. Statistical differences at the end of the experiment were calculated with a Bonferroni post hoc test after two-way ANOVA (****p ≤ 0.0001); E. qPCR results of relative abundance of atg8a, atg8b, atg1 and p62 mRNAs at 2, 5 and 24 hpi with M. marinum wt (blue outline) and ΔRD1 (red outline). The mRNA level in non-infected cells is indicated as 1 in the figure (dashed line). The mRNA level of the housekeeping gene gapdh was used for normalization. Means and standard deviations from three independent experiments performed in triplicates are represented; F. GFP-Atg8-expressing cells were infected or mock-infected for 1.5 or 7 h with mCherry-expressing M. marinum wt or with DsRed-expressing M. marinum ΔRD1. Maximum projections were used to measure the Integrated Density (IntDen) of the cytosolic GFP-Atg8 fluorescence compared to the extracellular IntDen (background). Median with interquartile ranges of the cytosolic GFP-Atg8 IntDen per cell. Each dot represents one cell. 210–357 cells per condition from three independent experiments were counted. Mann-Whitney test (****p ≤ 0.0001; **p ≤ 0.01; ns, p > 0.05).
Fig 4 The early autophagic response caused by M. marinum infection is dependent on ESX-1. A. Percentage of cells containing GFP-Atg8+ M. marinum wt and ΔRD1 at 1.5, 7 and 24 hpi. Means and standard deviations from independent triplicates. A mean of 375 and 230 infected cells per time point was counted for M. marinum wt and ΔRD1 infection, respectively; B. Percentage of M. marinum wt and ΔRD1 bacteria positive for GFP-Ub. Mean and standard deviation from independent triplicates; C. GFP-Ub-expressing atg1- cells were infected with Vibrant DyeCycle Ruby-labelled M. marinum wt, ΔRD1 and ΔRD1::2F9. Means and standard deviations from independent duplicates of the percentage of bacteria positive for GFP-Ub at 7 hpi. A mean of 72–98 bacteria per infection was counted. Unpaired t test (**p ≤ 0.01); D. D. discoideum wt and atg1- cells were infected with lux-expressing M. marinum wt and ΔRD1. The intracellular bacteria growth (RLUs) from triplicates was monitored. Statistical differences at the end of the experiment were calculated with a Bonferroni post hoc test after two-way ANOVA (****p ≤ 0.0001); E. qPCR results of relative abundance of atg8a, atg8b, atg1 and p62 mRNAs at 2, 5 and 24 hpi with M. marinum wt (blue outline) and ΔRD1 (red outline). The mRNA level in non-infected cells is indicated as 1 in the figure (dashed line). The mRNA level of the housekeeping gene gapdh was used for normalization. Means and standard deviations from three independent experiments performed in triplicates are represented; F. GFP-Atg8-expressing cells were infected or mock-infected for 1.5 or 7 h with mCherry-expressing M. marinum wt or with DsRed-expressing M. marinum ΔRD1. Maximum projections were used to measure the Integrated Density (IntDen) of the cytosolic GFP-Atg8 fluorescence compared to the extracellular IntDen (background). Median with interquartile ranges of the cytosolic GFP-Atg8 IntDen per cell. Each dot represents one cell. 210–357 cells per condition from three independent experiments were counted. Mann-Whitney test (****p ≤ 0.0001; **p ≤ 0.01; ns, p > 0.05).CC BY · PubMed Central
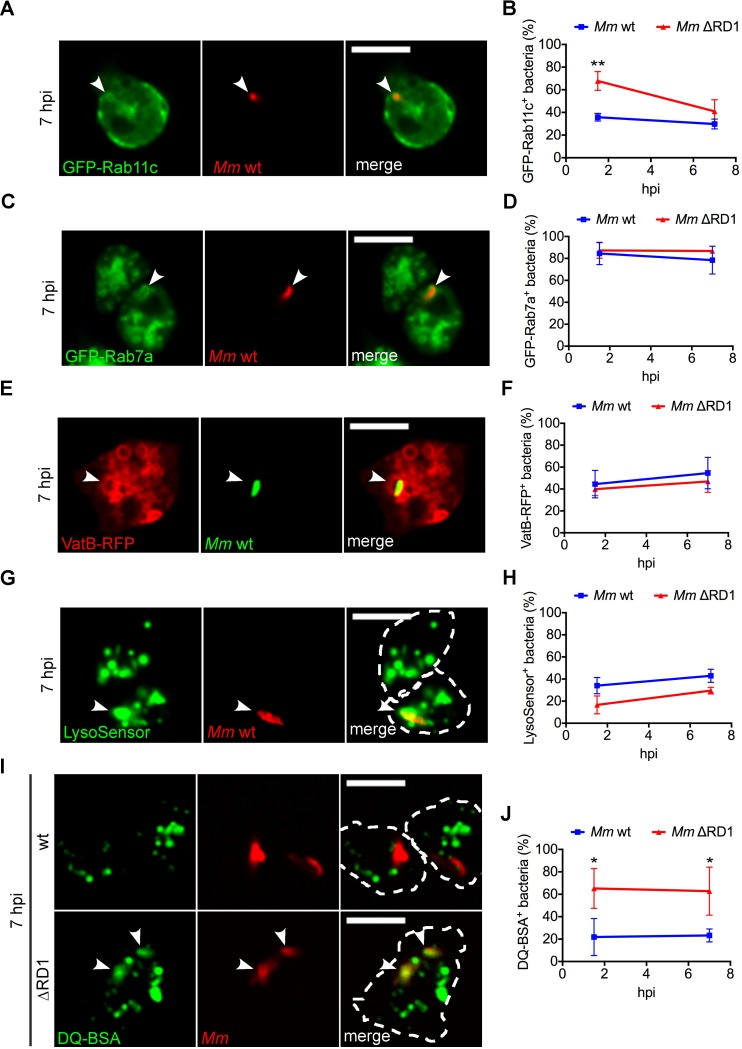
Fig 5 Expression of ESX-1 is essential to devoid the MCV of proteolytic activity. Cells expressing GFP-Rab11c, GFP-Rab7a or VatB-RFP, or incubated with LysoSensor Green or DQ Green BSA were infected for 1.5 and 7h with M. marinum wt or ΔRD1 labelled with Vibrant DyeCycle Ruby or expressing mCherry, DsRed or GFP. Representative sections of live imaging at 7 hpi are shown in A, C, E, G and I. White arrowheads point to the sites of recruitment/co-localization to the MCV. Scale bars, 10 μm; The percentage of bacteria/MCVs positive for GFP-Rab11c (B), GFP-Rab7a (D), VatB-RFP (F), LysoSensor Green (H) or DQ Green BSA (J) at 1.5 and 7 hpi was quantified. Mean and standard deviation from 2–3 independent experiments. A minimum of 100 infected cells were counted for each cell line. Unpaired t test compared wt and ΔRD1 bacteria (*p ≤ 0.05; **p ≤ 0.01).
Fig 5 Expression of ESX-1 is essential to devoid the MCV of proteolytic activity. Cells expressing GFP-Rab11c, GFP-Rab7a or VatB-RFP, or incubated with LysoSensor Green or DQ Green BSA were infected for 1.5 and 7h with M. marinum wt or ΔRD1 labelled with Vibrant DyeCycle Ruby or expressing mCherry, DsRed or GFP. Representative sections of live imaging at 7 hpi are shown in A, C, E, G and I. White arrowheads point to the sites of recruitment/co-localization to the MCV. Scale bars, 10 μm; The percentage of bacteria/MCVs positive for GFP-Rab11c (B), GFP-Rab7a (D), VatB-RFP (F), LysoSensor Green (H) or DQ Green BSA (J) at 1.5 and 7 hpi was quantified. Mean and standard deviation from 2–3 independent experiments. A minimum of 100 infected cells were counted for each cell line. Unpaired t test compared wt and ΔRD1 bacteria (*p ≤ 0.05; **p ≤ 0.01).CC BY · PubMed Central
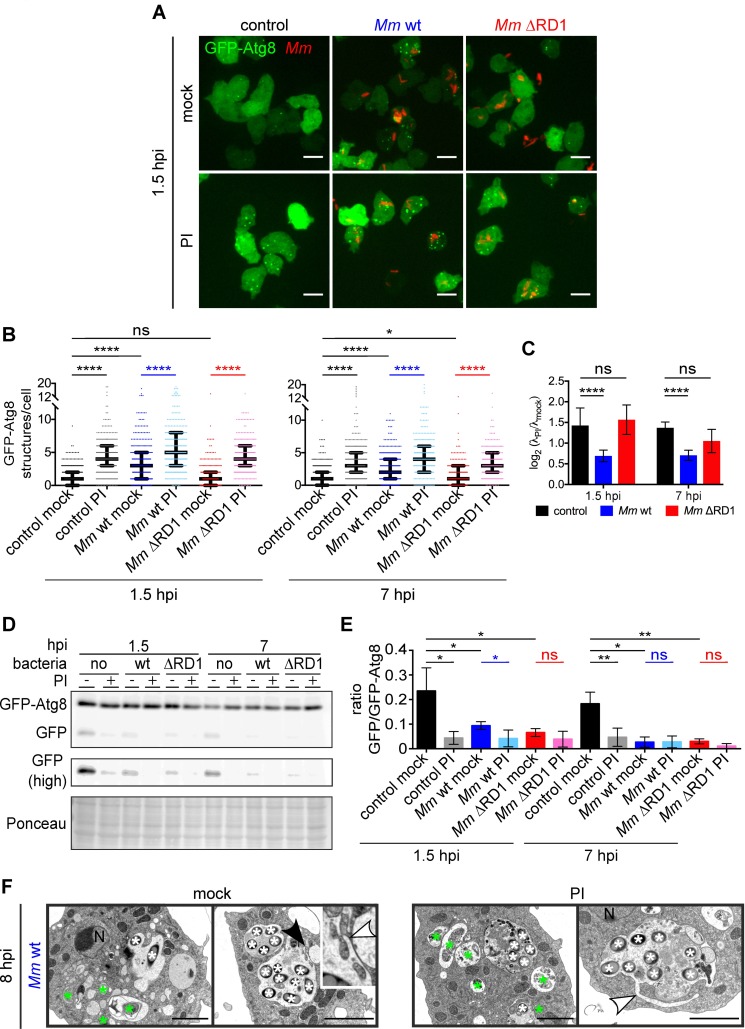
Fig 6 The autophagic flux is blocked during wt M. marinum infection. A. GFP-Atg8-expressing cells were infected or mock-infected for 0.5 or 6 h with mCherry-expressing M. marinum wt or with DsRed-expressing M. marinum ΔRD1 and treated or not with a PI cocktail at 2.5× for one additional hour. Representative maximum projections of live imaging at 1.5 hpi are shown. Scale bars, 10 μm; B. Medians with interquartile ranges of the number of GFP-Atg8 structures per cell from the infections carried out in A. Each dot represents one cell. 178–338 cells per condition from three independent experiments were counted. The λ that define the Poisson distribution of each data set and differences between them were calculated as described in Materials and Methods (*p ≤ 0.05; ****p ≤ 0.0001; ns, p > 0.05); C. Mean and standard deviation of the log2 (λPI/λmock) from the three independent replicates represented in B. A log2 (λPI/λmock) of zero implies that there was a total autophagic block. p-values calculated as described in Materials and Methods (****p ≤ 0.0001; ns, p > 0.05). D. Samples from infections (A) were immunoblotted against GFP. Longer exposure of the free GFP bands is shown as "GFP (high)". Ponceau-S staining as loading control. Representative result from four independent experiments E. Means and standard deviations of the ratio GFP/GFP-Atg8 from the immunoblots represented in D. Unpaired t test (*p ≤ 0.05; **p ≤ 0.01; ns, p > 0.05). F. EM of D. discoideum infected with M. marinum wt for 7 h and incubated or not with PI at 2.5× for an additional hour. White and green asterisks label bacteria and autophagosomes, respectively. White arrowheads point to membrane extensions originating at the MCV. The black arrowhead marks the zoomIn. Scale bars, 2 μm.
Fig 6 The autophagic flux is blocked during wt M. marinum infection. A. GFP-Atg8-expressing cells were infected or mock-infected for 0.5 or 6 h with mCherry-expressing M. marinum wt or with DsRed-expressing M. marinum ΔRD1 and treated or not with a PI cocktail at 2.5× for one additional hour. Representative maximum projections of live imaging at 1.5 hpi are shown. Scale bars, 10 μm; B. Medians with interquartile ranges of the number of GFP-Atg8 structures per cell from the infections carried out in A. Each dot represents one cell. 178–338 cells per condition from three independent experiments were counted. The λ that define the Poisson distribution of each data set and differences between them were calculated as described in Materials and Methods (*p ≤ 0.05; ****p ≤ 0.0001; ns, p > 0.05); C. Mean and standard deviation of the log2 (λPI/λmock) from the three independent replicates represented in B. A log2 (λPI/λmock) of zero implies that there was a total autophagic block. p-values calculated as described in Materials and Methods (****p ≤ 0.0001; ns, p > 0.05). D. Samples from infections (A) were immunoblotted against GFP. Longer exposure of the free GFP bands is shown as "GFP (high)". Ponceau-S staining as loading control. Representative result from four independent experiments E. Means and standard deviations of the ratio GFP/GFP-Atg8 from the immunoblots represented in D. Unpaired t test (*p ≤ 0.05; **p ≤ 0.01; ns, p > 0.05). F. EM of D. discoideum infected with M. marinum wt for 7 h and incubated or not with PI at 2.5× for an additional hour. White and green asterisks label bacteria and autophagosomes, respectively. White arrowheads point to membrane extensions originating at the MCV. The black arrowhead marks the zoomIn. Scale bars, 2 μm.CC BY · PubMed Central
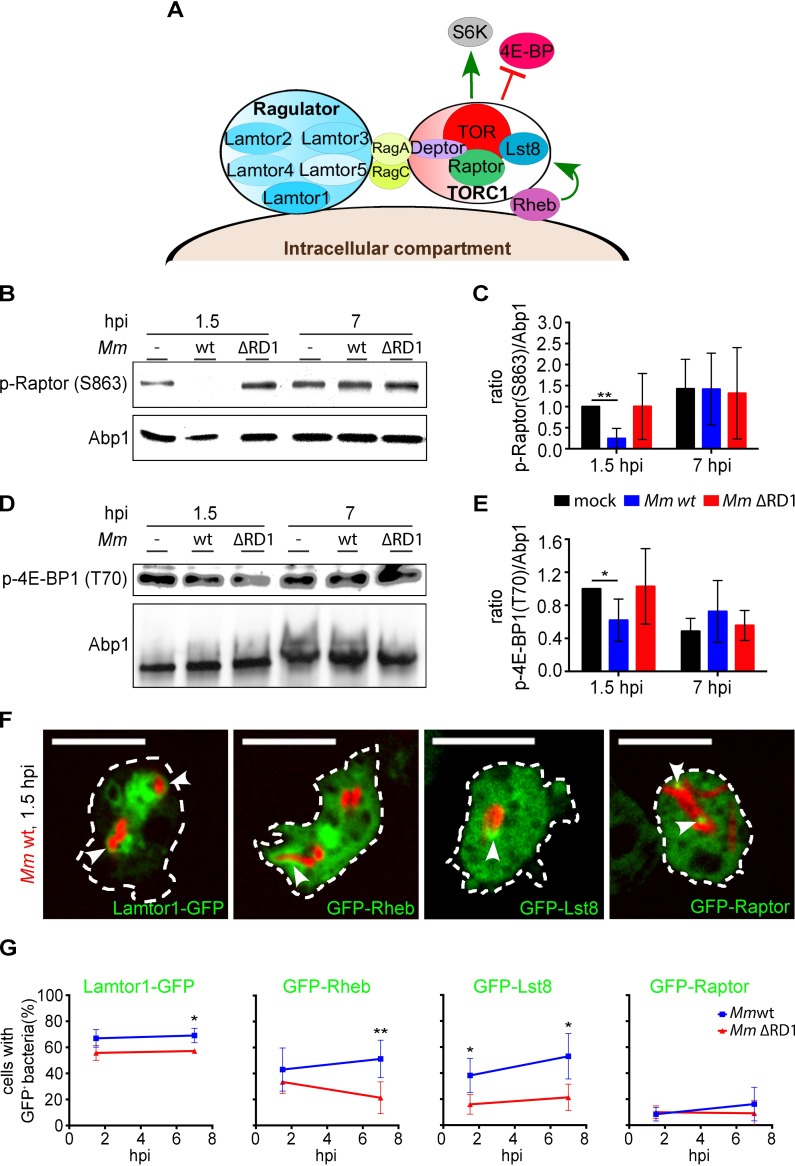
Fig 7 The early autophagic response, but not the flux blockade induced by M. marinum depends on TORC1. A. Scheme of the putative TORC1 and Ragulator complexes in D. discoideum. Only the proteins conserved in the amoeba are represented. Green arrows indicate activation; red lines, inhibition; B and D. D. discoideum was infected or not with mCherry-expressing M. marinum wt or with DsRed-expressing M. marinum ΔRD1 for 1.5 and 7 hpi and immunoblotted against p-Raptor(S863) (B), and p-4E-BP1(T70) (D). Abp1 was used as loading control. Shown are representative results from four independent experiments; C and E. Mean and standard deviation of the ratio p-Raptor(S863)/Abp1 (C) and p-4E-BP1(T70)/Abp1 (E) from the immunoblots represented in B and D. Unpaired t test (*p ≤ 0.05; **p ≤ 0.01); F. Sections of live cells expressing Lamtor1-GFP, GFP-Rheb, GFP-Lst8 or GFP-Raptor and infected with mCherry-expressing M. marinum wt for 1.5 h. White arrowheads point to the recruitment of the GFP-constructs to the MCV. Scale bars, 10 μm; G. Quantification of the percentage of cells carrying mCherry-expressing M. marinum wt or DsRed-expressing M. marinum ΔRD1 positive for Lamtor1-GFP, GFP-Rheb, GFP-Lst8 or GFP-Raptor at 1.5 and 7 hpi. Mean and standard deviation from three to six independent experiments. A minimum of 100 infected cells were counted for each cell line. Unpaired t test compared wt and ΔRD1 bacteria (*p ≤ 0.05; **p ≤ 0.01).
Fig 7 The early autophagic response, but not the flux blockade induced by M. marinum depends on TORC1. A. Scheme of the putative TORC1 and Ragulator complexes in D. discoideum. Only the proteins conserved in the amoeba are represented. Green arrows indicate activation; red lines, inhibition; B and D. D. discoideum was infected or not with mCherry-expressing M. marinum wt or with DsRed-expressing M. marinum ΔRD1 for 1.5 and 7 hpi and immunoblotted against p-Raptor(S863) (B), and p-4E-BP1(T70) (D). Abp1 was used as loading control. Shown are representative results from four independent experiments; C and E. Mean and standard deviation of the ratio p-Raptor(S863)/Abp1 (C) and p-4E-BP1(T70)/Abp1 (E) from the immunoblots represented in B and D. Unpaired t test (*p ≤ 0.05; **p ≤ 0.01); F. Sections of live cells expressing Lamtor1-GFP, GFP-Rheb, GFP-Lst8 or GFP-Raptor and infected with mCherry-expressing M. marinum wt for 1.5 h. White arrowheads point to the recruitment of the GFP-constructs to the MCV. Scale bars, 10 μm; G. Quantification of the percentage of cells carrying mCherry-expressing M. marinum wt or DsRed-expressing M. marinum ΔRD1 positive for Lamtor1-GFP, GFP-Rheb, GFP-Lst8 or GFP-Raptor at 1.5 and 7 hpi. Mean and standard deviation from three to six independent experiments. A minimum of 100 infected cells were counted for each cell line. Unpaired t test compared wt and ΔRD1 bacteria (*p ≤ 0.05; **p ≤ 0.01).CC BY · PubMed Central
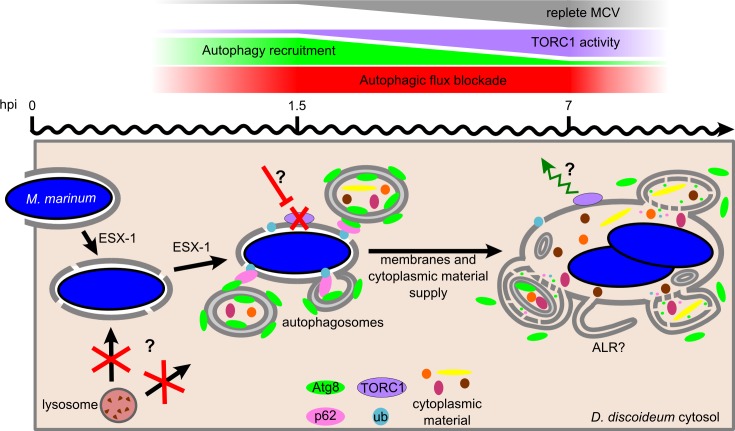
Fig 8 Model of the D. discoideum autophagic response during M. marinum infection. Early after engulfment, M. marinum damages the membrane of its MCV in an ESX-1-dependent manner. Membrane perforations might block lysosome fusion and, consequently, autophagic flux. In addition, ESX-1 inhibits TORC1 activity early during infection (1.5 hpi), presumably through a nutrient-sensing pathway as described for other bacteria [75–77]. Downregulation of TORC1, which is always bound to the wt MCV membrane, induces the formation of autophagosomes that somehow repair the membrane damages and provide the MCV with cytoplasmic material. TORC1 re-activation at 7 hpi leads to the decrease in autophagosome formation and recruitment to the MCV, and enhances the blockade of the autophagic flux, which generates proto-lysosomal tubules (ALR). The block in autophagic flux prevents bacteria killing in autolysosomes and degradation of membranes and cytoplasmic material delivered to the MCV via the recruited autophagosomes.
Fig 8 Model of the D. discoideum autophagic response during M. marinum infection. Early after engulfment, M. marinum damages the membrane of its MCV in an ESX-1-dependent manner. Membrane perforations might block lysosome fusion and, consequently, autophagic flux. In addition, ESX-1 inhibits TORC1 activity early during infection (1.5 hpi), presumably through a nutrient-sensing pathway as described for other bacteria [75–77]. Downregulation of TORC1, which is always bound to the wt MCV membrane, induces the formation of autophagosomes that somehow repair the membrane damages and provide the MCV with cytoplasmic material. TORC1 re-activation at 7 hpi leads to the decrease in autophagosome formation and recruitment to the MCV, and enhances the blockade of the autophagic flux, which generates proto-lysosomal tubules (ALR). The block in autophagic flux prevents bacteria killing in autolysosomes and degradation of membranes and cytoplasmic material delivered to the MCV via the recruited autophagosomes.CC BY · PubMed Central

Verification

Claims the paper makes

The claims and statistics of this paper haven’t been checked yet.

Run the check — free, no account needed. It reads the open-access text and checks the sources it cites.

A few free checks a day · papers already verified open instantly · results are public

Claims other papers make about this one

Each is checked against this paper’s own text: does it say what the citing paper says it does?

Self-check

Percentages, sums and reported differences re-computed from the paper’s own numbers.

The self-check needs the paper’s full text.

Citations

Cites

Research works printed but not linked: 69

  1. CC Dibble, 2013, Signal integration by mTORC1 coordinates nutrient input with biosynthetic output, Nat Cell Biol, 15, 555, 10.1038/ncb2763 · DOI
  2. S Sengupta, 2010, Regulation of the mTOR complex 1 pathway by nutrients, growth factors, and stress, Mol Cell, 40, 310, 10.1016/j.molcel.2010.09.026 · DOI
  3. J Calvo-Garrido, 2010, Autophagy in Dictyostelium: genes and pathways, cell death and infection, Autophagy, 6, 686, 10.4161/auto.6.6.12513 · DOI
  4. SR Carlsson, 2015, Membrane dynamics in autophagosome biogenesis, J Cell Sci, 128, 193, 10.1242/jcs.141036 · DOI
  5. S Mostowy, 2013, Autophagy and bacterial clearance: a not so clear picture, Cell Microbiol, 15, 395, 10.1111/cmi.12063 · DOI
  6. A Schnaith, 2007, Staphylococcus aureus subvert autophagy for induction of caspase-independent host cell death, J Biol Chem, 282, 2695, 10.1074/jbc.M609784200 · DOI
  7. JA MacGurn, 2007, A genetic screen for Mycobacterium tuberculosis mutants defective for phagosome maturation arrest identifies components of the ESX-1 secretion system, Infect Immun, 75, 2668, 10.1128/IAI.01872-06 · DOI
  8. M Hagedorn, 2009, Infection by tubercular mycobacteria is spread by nonlytic ejection from their amoeba hosts, Science, 323, 1729, 10.1126/science.1169381 · DOI
  9. EF Castillo, 2012, Autophagy protects against active tuberculosis by suppressing bacterial burden and inflammation, Proc Natl Acad Sci U S A, 109, E3168, 10.1073/pnas.1210500109 · DOI
  10. A Romagnoli, 2012, ESX-1 dependent impairment of autophagic flux by Mycobacterium tuberculosis in human dendritic cells, Autophagy, 8, 1357, 10.4161/auto.20881 · DOI
  11. DM Shin, 2010, Mycobacterium tuberculosis eis regulates autophagy, inflammation, and cell death through redox-dependent signaling, PLoS Pathog, 6, e1001230, 10.1371/journal.ppat.1001230 · DOI
  12. S Mohanty, 2015, A mycobacterial phosphoribosyltransferase promotes bacillary survival by inhibiting oxidative stress and autophagy pathways in macrophages and zebrafish, J Biol Chem, 290, 13321, 10.1074/jbc.M114.598482 · DOI
  13. W Shui, 2011, Organelle membrane proteomics reveals differential influence of mycobacterial lipoglycans on macrophage phagosome maturation and autophagosome accumulation, J Proteome Res, 10, 339, 10.1021/pr100688h · DOI
  14. L Srinivasan, 2016, Identification of a Transcription Factor That Regulates Host Cell Exit and Virulence of Mycobacterium tuberculosis, PLoS Pathog, 12, e1005652, 10.1371/journal.ppat.1005652 · DOI
  15. D Hu, 2015, Autophagy regulation revealed by SapM-induced block of autophagosome-lysosome fusion via binding RAB7, Biochem Biophys Res Commun, 461, 401, 10.1016/j.bbrc.2015.04.051 · DOI
  16. J Augenstreich, 2017, ESX-1 and phthiocerol dimycocerosates of Mycobacterium tuberculosis act in concert to cause phagosomal rupture and host cell apoptosis, Cell Microbiol
  17. DM Tobin, 2008, Comparative pathogenesis of Mycobacterium marinum and Mycobacterium tuberculosis, Cell Microbiol, 10, 1027, 10.1111/j.1462-5822.2008.01133.x · DOI · Paper page
  18. MC Lerena, 2011, Mycobacterium marinum induces a marked LC3 recruitment to its containing phagosome that depends on a functional ESX-1 secretion system, Cell Microbiol, 13, 814, 10.1111/j.1462-5822.2011.01581.x · DOI · Paper page
  19. J Smith, 2008, Evidence for pore formation in host cell membranes by ESX-1-secreted ESAT-6 and its role in Mycobacterium marinum escape from the vacuole, Infect Immun, 76, 5478, 10.1128/IAI.00614-08 · DOI
  20. S Bozzaro, 2011, The professional phagocyte Dictyostelium discoideum as a model host for bacterial pathogens, Curr Drug Targets, 12, 942, 10.2174/138945011795677782 · DOI
  21. A Mesquita, 2016, Autophagy in Dictyostelium: Mechanisms, regulation and disease in a simple biomedical model, Autophagy, 1
  22. L Gerstenmaier, 2015, The autophagic machinery ensures nonlytic transmission of mycobacteria, Proc Natl Acad Sci U S A, 112, E687, 10.1073/pnas.1423318112 · DOI
  23. A Mesquita, 2015, Dissecting the function of Atg1 complex in Dictyostelium autophagy reveals a connection with the pentose phosphate pathway enzyme transketolase, Open Biol, 5, 10.1098/rsob.150088 · DOI
  24. JS King, 2011, The induction of autophagy by mechanical stress, Autophagy, 7, 1490, 10.4161/auto.7.12.17924 · DOI
  25. PB Swer, 2014, Analysis of rapamycin induced autophagy in Dictyostelium discoideum, Indian J Exp Biol, 52, 295
  26. HE Polson, 2010, Mammalian Atg18 (WIPI2) localizes to omegasome-anchored phagophores and positively regulates LC3 lipidation, Autophagy, 6, 506, 10.4161/auto.6.4.11863 · DOI · Paper page
  27. M Gao, 2008, OSU-03012, a novel celecoxib derivative, induces reactive oxygen species-related autophagy in hepatocellular carcinoma, Cancer Res, 68, 9348, 10.1158/0008-5472.CAN-08-1642 · DOI
  28. S Huang, 2011, Inhibition of mTOR kinase by AZD8055 can antagonize chemotherapy-induced cell death through autophagy induction and down-regulation of p62/sequestosome 1, J Biol Chem, 286, 40002, 10.1074/jbc.M111.297432 · DOI
  29. QW Fan, 2006, A dual PI3 kinase/mTOR inhibitor reveals emergent efficacy in glioma, Cancer Cell, 9, 341, 10.1016/j.ccr.2006.03.029 · DOI
  30. GP Otto, 2004, Dictyostelium macroautophagy mutants vary in the severity of their developmental defects, J Biol Chem, 279, 15621, 10.1074/jbc.M311139200 · DOI
  31. M Hagedorn, 2007, Flotillin and RacH modulate the intracellular immunity of Dictyostelium to Mycobacterium marinum infection, Cell Microbiol, 9, 2716, 10.1111/j.1462-5822.2007.00993.x · DOI
  32. MG Gutierrez, 2005, Autophagy induction favours the generation and maturation of the Coxiella-replicative vacuoles, Cell Microbiol, 7, 981, 10.1111/j.1462-5822.2005.00527.x · DOI
  33. C Pujol, 2009, Yersinia pestis can reside in autophagosomes and avoid xenophagy in murine macrophages by preventing vacuole acidification, Infect Immun, 77, 2251, 10.1128/IAI.00068-09 · DOI
  34. CA Collins, 2009, Atg5-independent sequestration of ubiquitinated mycobacteria, PLoS Pathog, 5, e1000430, 10.1371/journal.ppat.1000430 · DOI
  35. X Peng, 2016, Characterization of differential pore-forming activities of ESAT-6 proteins from Mycobacterium tuberculosis and Mycobacterium smegmatis, FEBS Lett, 590, 509, 10.1002/1873-3468.12072 · DOI
  36. M Abdel-Nour, 2014, The emerging role of mTOR signalling in antibacterial immunity, Immunol Cell Biol, 92, 346, 10.1038/icb.2014.3 · DOI
  37. LY Gao, 2004, A mycobacterial virulence gene cluster extending RD1 is required for cytolysis, bacterial spreading and ESAT-6 secretion, Mol Microbiol, 53, 1677, 10.1111/j.1365-2958.2004.04261.x · DOI
  38. AS Pym, 2002, Loss of RD1 contributed to the attenuation of the live tuberculosis vaccines Mycobacterium bovis BCG and Mycobacterium microti, Mol Microbiol, 46, 709, 10.1046/j.1365-2958.2002.03237.x · DOI · Paper page
  39. CA Lamb, 2013, The autophagosome: origins unknown, biogenesis complex, Nat Rev Mol Cell Biol, 14, 759, 10.1038/nrm3696 · DOI
  40. J Zhang, 2016, Autophagic lysosomal reformation depends on mTOR reactivation in H2O2-induced autophagy, Int J Biochem Cell Biol, 70, 76, 10.1016/j.biocel.2015.11.009 · DOI
  41. M Binda, 2009, The Vam6 GEF controls TORC1 by activating the EGO complex, Mol Cell, 35, 563, 10.1016/j.molcel.2009.06.033 · DOI
  42. L Bar-Peled, 2014, Regulation of mTORC1 by amino acids, Trends Cell Biol, 24, 400, 10.1016/j.tcb.2014.03.003 · DOI · Paper page
  43. M Steinert, 2011, Pathogen-host interactions in Dictyostelium, Legionella, Mycobacterium and other pathogens, Semin Cell Dev Biol, 22, 70, 10.1016/j.semcdb.2010.11.003 · DOI
  44. M van der Vaart, 2014, The DNA damage-regulated autophagy modulator DRAM1 links mycobacterial recognition via TLR-MYD88 to autophagic defense [corrected], Cell Host Microbe, 15, 753, 10.1016/j.chom.2014.05.005 · DOI
  45. J Geng, 2008, The Atg8 and Atg12 ubiquitin-like conjugation systems in macroautophagy. 'Protein modifications: beyond the usual suspects' review series, EMBO Rep, 9, 859, 10.1038/embor.2008.163 · DOI
  46. S Kreibich, 2015, Autophagy Proteins Promote Repair of Endosomal Membranes Damaged by the Salmonella Type Three Secretion System 1, Cell Host Microbe, 18, 527, 10.1016/j.chom.2015.10.015 · DOI
  47. RO Watson, 2012, Extracellular M. tuberculosis DNA targets bacteria for autophagy by activating the host DNA-sensing pathway, Cell, 150, 803, 10.1016/j.cell.2012.06.040 · DOI · Paper page
  48. SB Singh, 2006, Human IRGM induces autophagy to eliminate intracellular mycobacteria, Science, 313, 1438, 10.1126/science.1129577 · DOI · Paper page
  49. LM Shaughnessy, 2006, Membrane perforations inhibit lysosome fusion by altering pH and calcium in Listeria monocytogenes vacuoles, Cell Microbiol, 8, 781, 10.1111/j.1462-5822.2005.00665.x · DOI
  50. JK Malet, 2017, Alteration of epithelial cell lysosomal integrity induced by bacterial cholesterol-dependent cytolysins, Cell Microbiol, 19, 10.1111/cmi.12682 · DOI
  51. AJ Zullo, 2012, Mycobacterial induction of autophagy varies by species and occurs independently of mammalian target of rapamycin inhibition, J Biol Chem, 287, 12668, 10.1074/jbc.M111.320135 · DOI
  52. H Dong, 2016, ESAT6 inhibits autophagy flux and promotes BCG proliferation through MTOR, Biochem Biophys Res Commun
  53. J Faix, 2004, A rapid and efficient method to generate multiple gene disruptions in Dictyostelium discoideum using a single selectable marker and the Cre-loxP system, Nucleic Acids Res, 32, e143, 10.1093/nar/gnh136 · DOI
  54. S Arafah, 2013, Setting up and monitoring an infection of Dictyostelium discoideum with mycobacteria, Methods Mol Biol, 983, 403, 10.1007/978-1-62703-302-2_22 · DOI
  55. KG Foster, 2010, Regulation of mTOR complex 1 (mTORC1) by raptor Ser863 and multisite phosphorylation, J Biol Chem, 285, 80, 10.1074/jbc.M109.029637 · DOI
  56. AC Gingras, 1999, Regulation of 4E-BP1 phosphorylation: a novel two-step mechanism, Genes Dev, 13, 1422, 10.1101/gad.13.11.1422 · DOI
  57. K Ravanel, 2001, Membrane sorting in the endocytic and phagocytic pathway of Dictyostelium discoideum, Eur J Cell Biol, 80, 754, 10.1078/0171-9335-00215 · DOI
  58. R Dieckmann, 2010, A myosin IK-Abp1-PakB circuit acts as a switch to regulate phagocytosis efficiency, Mol Biol Cell, 21, 1505, 10.1091/mbc.E09-06-0485 · DOI
  59. UK Laemmli, 1970, Cleavage of structural proteins during the assembly of the head of bacteriophage T4, Nature, 227, 680, 10.1038/227680a0 · DOI · Paper page
  60. EC Schwarz, 2000, Dictyostelium myosin IK is involved in the maintenance of cortical tension and affects motility and phagocytosis, J Cell Sci, 113, 621, 10.1242/jcs.113.4.621 · DOI
  61. M Hagedorn, 2006, Optimized fixation and immunofluorescence staining methods for Dictyostelium cells, Methods Mol Biol, 346, 327
  62. C Barisch, 2015, Live imaging of Mycobacterium marinum infection in Dictyostelium discoideum, Methods Mol Biol, 1285, 369, 10.1007/978-1-4939-2450-9_23 · DOI
  63. A Marchetti, 2004, Formation of multivesicular endosomes in Dictyostelium, J Cell Sci, 117, 6053, 10.1242/jcs.01524 · DOI
  64. C Barisch, 2015, Lipid droplet dynamics at early stages of Mycobacterium marinum infection in Dictyostelium, Cell Microbiol, 17, 1332, 10.1111/cmi.12437 · DOI
  65. J Calvo-Garrido, 2011, A proteolytic cleavage assay to monitor autophagy in Dictyostelium discoideum, Autophagy, 7, 1063, 10.4161/auto.7.9.16629 · DOI · Paper page
  66. B Phipson, 2010, Permutation P-values should never be zero: calculating exact P-values when permutations are randomly drawn, Stat Appl Genet Mol Biol, 9, 10.2202/1544-6115.1585 · DOI · Paper page
  67. I Tattoli, 2013, Listeria phospholipases subvert host autophagic defenses by stalling pre-autophagosomal structures, EMBO J, 32, 3066, 10.1038/emboj.2013.234 · DOI
  68. I Tattoli, 2012, The bacterial and cellular determinants controlling the recruitment of mTOR to the Salmonella-containing vacuole, Biol Open, 1, 1215, 10.1242/bio.20122840 · DOI
  69. I Tattoli, 2012, Amino acid starvation induced by invasive bacterial pathogens triggers an innate host defense program, Cell Host Microbe, 11, 563, 10.1016/j.chom.2012.04.012 · DOI

Cited by

Sorted by citations

See all 84

Metadata

Authors
Cardenal-Muñoz, E., Arafah, S., López-Jiménez, A. T., Kicka, S., Falaise, A., Bach, F., Schaad, O., King, J. S., Hagedorn, M., & Soldati, T.
Venue
PLOS Pathogens
Published
2017-04-17
Volume
13
Issue
4
Pages
e1006344
ISSN
1553-7374
Cited by
84
References
8
Language
en
Funders
  • Schweizerischer Nationalfonds zur Förderung der Wissenschaftlichen Forschung (310030_149390)
  • European Cooperation in Science and Technology (CA15138)

About these checks

Registry, retraction, Cites and statistics results are computed, not judged, with one exception: a printed reference that no index lists is read once by a model before it counts as a citation error. Claims are extracted by a model and kept only when their quote appears verbatim in the text; each cited source is then checked, with a model’s help, for whether it says what the claim relies on. Those verdicts can be wrong — read the claim’s quote and the cited source before relying on one.

Statistics and arithmetic are recomputed, not judged.

Confidence bands are shown only for fields calibrated on our annotated test set. None is calibrated yet, so no band is shown.

What counts as a claim ›How we measure confidence ›How we check this ›

Are you an author, or do you see a problem with this page? Request a review