Cited by 135Alzheimer's disease research and treatmentsNeuroscience and Neuropharmacology ResearchDementia and Cognitive Impairment Research

The DOI matches its Crossref record; 71 of the 71 references it cites were found in a registry or an index.

Aβ mediates F-actin disassembly in dendritic spines leading to cognitive deficits in Alzheimer's disease

Open access

Abstract

Dendritic spine loss is recognized as an early feature of Alzheimer's disease (AD), but the underlying mechanisms are poorly understood. Dendritic spine structure is defined by filamentous actin (F-actin) and we observed depolymerization of synaptosomal F-actin accompanied by increased globular-actin (G-actin) at as early as 1 month of age in a mouse model of AD (APPswe/PS1ΔE9, male mice). This led to recall deficit after contextual fear conditioning (cFC) at 2 months of age in APPswe/PS1ΔE9 male mice, which could be reversed by the actin-polymerizing agent jasplakinolide. Further, the F-actin-depolymerizing agent latrunculin induced recall deficit after cFC in WT mice, indicating the importance of maintaining F-/G-actin equilibrium for optimal behavioral response. Using direct stochastic optical reconstruction microscopy (dSTORM), we show that F-actin depolymerization in spines leads to a breakdown of the nano-organization of outwardly radiating F-actin rods in cortical neurons from APPswe/PS1ΔE9 mice. Our results demonstrate that synaptic dysfunction seen as F-actin disassembly occurs very early, before onset of pathological hallmarks in AD mice, and contributes to behavioral dysfunction, indicating that depolymerization of F-actin is causal and not consequent to decreased spine density. Further, we observed decreased synaptosomal F-actin levels in postmortem brain from mild cognitive impairment and AD patients compared with subjects with normal cognition. F-actin decrease correlated inversely with increasing AD pathology (Braak score, Aβ load, and tangle density) and directly with performance in episodic and working memory tasks, suggesting its role in human disease pathogenesis and progression. SIGNIFICANCE STATEMENT Synaptic dysfunction underlies cognitive deficits in Alzheimer's disease (AD). The cytoskeletal protein actin plays a critical role in maintaining structure and function of synapses. Using cultured neurons and an AD mouse model, we show for the first time that filamentous actin (F-actin) is lost selectively from synapses early in the disease process, long before the onset of classical AD pathology. We also demonstrate that loss of synaptic F-actin contributes directly to memory deficits. Loss of synaptosomal F-actin in human postmortem tissue correlates directly with decreased performance in memory test and inversely with AD pathology. Our data highlight that synaptic cytoarchitectural changes occur early in AD and they may be targeted for the development of therapeutics.

Overview

The claims and statistics of this paper haven’t been checked yet.

Run the check — free, no account needed. It reads the open-access text and checks the sources it cites.

A few free checks a day · papers already verified open instantly · results are public

Integrity signals

Registry

Crossref · 10.1523/jneurosci.2127-17.2017

Cites

71 of 71 references verified0 citation errors · 0 not checkable

Statistics

Figures

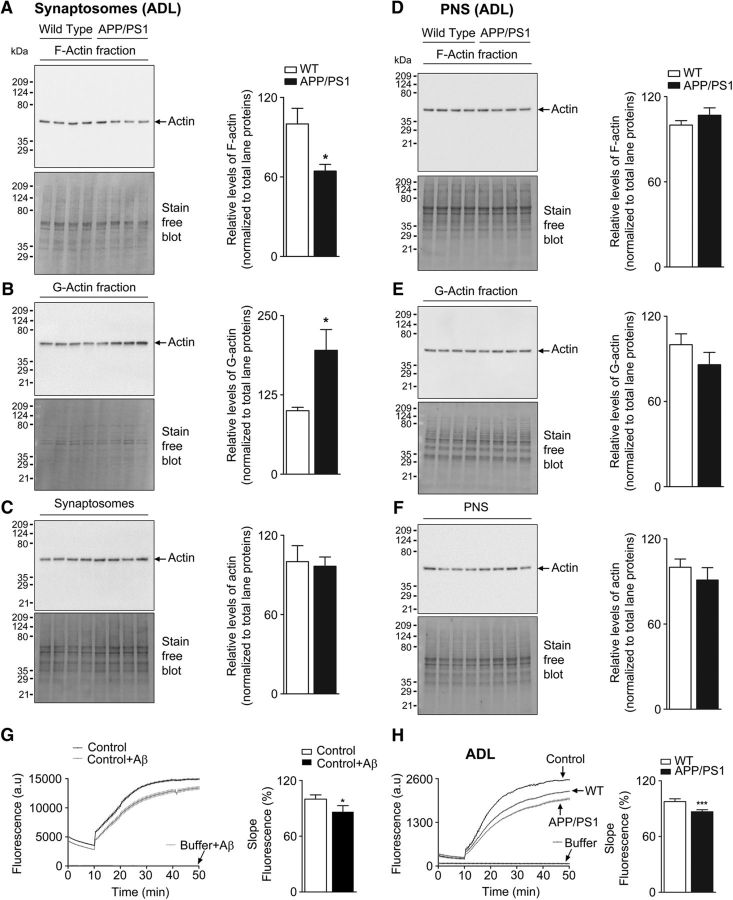
Figure 1. Decreased synaptosomal F-actin levels in cerebral cortex of APP/PS1 mice (see Fig. 1-1, Fig. 1-2, Fig. 1-3). Enriched G-actin and F-actin fractions were isolated from synaptosomes and PNS of ADL (1-month-old) WT and APP/PS1 mouse brain cortex samples. These fractions were resolved on TGX-stain-free gels and levels of F-actin (A, D), G-actin (B, E), and total actin (C, F) were analyzed by immunoblotting with anti-actin antibody. Densitometric analyses for actin levels were normalized to total lane proteins. Statistical analysis: A, ADL mice quantification of F-actin (p = 0.0144, t = 2.792, df = 14); B, G-actin (p = 0.0125, t = 2.865, df = 14); C, total actin (p = 0.8089, t = 0.2465, df = 14); D, ADL mice quantification of F-actin (p = 0.2710, t = 1.146, df = 14); E, G-actin (p = 0.2438, t = 1.217, df = 14); F, total actin (p = 0.4030, t = 0.8624, df = 14). Unpaired two-tailed t test was used. Results are shown as the mean ± SEM (n = 7–8 per group). G, In vitro actin polymerization assay was performed using control actin only and control actin reaction supplemented with 62.5 nm Aβ1-42 peptide (p = 0.0401, t = 2.996, df = 4). Results are shown from three experiments. Unpaired two-tailed t test was used. Asterisks indicates statistical significance. H, Rate of actin polymerization was measured from synaptosomes of ADL mice. For actin polymerization, results are shown from ADL (n = 8) mice per group. Statistical significance: p < 0.0001, t = 8.379, df = 14. *p < 0.05, ***p < 0.001 for WT versus APP/PS1 (unpaired Student's two-tailed t test).
Figure 1. Decreased synaptosomal F-actin levels in cerebral cortex of APP/PS1 mice (see Fig. 1-1, Fig. 1-2, Fig. 1-3). Enriched G-actin and F-actin fractions were isolated from synaptosomes and PNS of ADL (1-month-old) WT and APP/PS1 mouse brain cortex samples. These fractions were resolved on TGX-stain-free gels and levels of F-actin (A, D), G-actin (B, E), and total actin (C, F) were analyzed by immunoblotting with anti-actin antibody. Densitometric analyses for actin levels were normalized to total lane proteins. Statistical analysis: A, ADL mice quantification of F-actin (p = 0.0144, t = 2.792, df = 14); B, G-actin (p = 0.0125, t = 2.865, df = 14); C, total actin (p = 0.8089, t = 0.2465, df = 14); D, ADL mice quantification of F-actin (p = 0.2710, t = 1.146, df = 14); E, G-actin (p = 0.2438, t = 1.217, df = 14); F, total actin (p = 0.4030, t = 0.8624, df = 14). Unpaired two-tailed t test was used. Results are shown as the mean ± SEM (n = 7–8 per group). G, In vitro actin polymerization assay was performed using control actin only and control actin reaction supplemented with 62.5 nm Aβ1-42 peptide (p = 0.0401, t = 2.996, df = 4). Results are shown from three experiments. Unpaired two-tailed t test was used. Asterisks indicates statistical significance. H, Rate of actin polymerization was measured from synaptosomes of ADL mice. For actin polymerization, results are shown from ADL (n = 8) mice per group. Statistical significance: p < 0.0001, t = 8.379, df = 14. *p < 0.05, ***p < 0.001 for WT versus APP/PS1 (unpaired Student's two-tailed t test).CC BY · PubMed Central
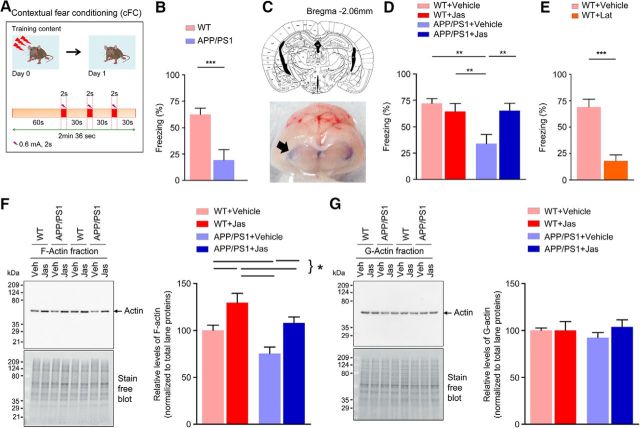
Figure 2. Long-term fear memory is impaired in 2-month- old APP/PS1 mice (see Fig. 2-1). A, Schematic of the experimental design. B, APP/PS1 mice exhibit significantly reduced freezing response than the WT control (p = 0.0021, t = 3.633, df = 17; n = 9–10 per group). C, Analysis of dye spread. Top, Schematic drawing based on the atlas of Franklin and Paxinos (1997) of coronal section of mouse brain depicting the location of cerebral ventricles (3V, D3V, LV), along with anteroposterior coordinates caudal to bregma. Bottom, Coronal cross-section of the brain harvested 4 h after intrathecal dye injection (100 μl of 1% methylene blue solution) to illustrate localization of dye spread in the cerebral ventricles (arrow). D, Intrathecal delivery of jasplakinolide (Jas) or vehicle after cFC rescued fear memory in APP/PS1 mice (interaction: F = 7.34482, p = 0.0101, df = 37; Jas: F = 2.77348, p = 0.1043, df = 37; genotype: F = 6.76938, p = 0.0133, df = 37; n = 9–11 per group). E, Reduced conditioned freezing levels were observed in WT control mice after intrathecal delivery of vehicle or latrunculin A (Lat) after training (p < 0.0001, t = 5.411, df = 16).(n = 9 per group). F, G, Representative immunoblot analysis for the synaptosomal F-actin and G-actin fractions in samples collected 24 h after injection of vehicle or Jas. Quantification of F-actin (interaction: F = 0.0443737, p = 0.8347, df = 28; Jas: F = 17.7623, p = 0.0002, df = 28; Genotype: F = 9.80714, p = 0.0040, df = 28; n = 7–9 per group). Quantification of G-actin (interaction: F = 0.686628, p = 0.4143, df = 28; Jas: F = 0.676441, p = 0.4178, df = 28; genotype: F = 0.0813757, p = 0.7775, df = 28; n = 7–9 per group). Statistical comparison was performed using unpaired two-tailed t test (B, E) or two-way ANOVA followed by Newman–Keuls post test (D, F, G). Data are presented as mean ± SEM. Statistical significance: *p < 0.05,**p < 0.01,***p < 0.001.
Figure 2. Long-term fear memory is impaired in 2-month- old APP/PS1 mice (see Fig. 2-1). A, Schematic of the experimental design. B, APP/PS1 mice exhibit significantly reduced freezing response than the WT control (p = 0.0021, t = 3.633, df = 17; n = 9–10 per group). C, Analysis of dye spread. Top, Schematic drawing based on the atlas of Franklin and Paxinos (1997) of coronal section of mouse brain depicting the location of cerebral ventricles (3V, D3V, LV), along with anteroposterior coordinates caudal to bregma. Bottom, Coronal cross-section of the brain harvested 4 h after intrathecal dye injection (100 μl of 1% methylene blue solution) to illustrate localization of dye spread in the cerebral ventricles (arrow). D, Intrathecal delivery of jasplakinolide (Jas) or vehicle after cFC rescued fear memory in APP/PS1 mice (interaction: F = 7.34482, p = 0.0101, df = 37; Jas: F = 2.77348, p = 0.1043, df = 37; genotype: F = 6.76938, p = 0.0133, df = 37; n = 9–11 per group). E, Reduced conditioned freezing levels were observed in WT control mice after intrathecal delivery of vehicle or latrunculin A (Lat) after training (p < 0.0001, t = 5.411, df = 16).(n = 9 per group). F, G, Representative immunoblot analysis for the synaptosomal F-actin and G-actin fractions in samples collected 24 h after injection of vehicle or Jas. Quantification of F-actin (interaction: F = 0.0443737, p = 0.8347, df = 28; Jas: F = 17.7623, p = 0.0002, df = 28; Genotype: F = 9.80714, p = 0.0040, df = 28; n = 7–9 per group). Quantification of G-actin (interaction: F = 0.686628, p = 0.4143, df = 28; Jas: F = 0.676441, p = 0.4178, df = 28; genotype: F = 0.0813757, p = 0.7775, df = 28; n = 7–9 per group). Statistical comparison was performed using unpaired two-tailed t test (B, E) or two-way ANOVA followed by Newman–Keuls post test (D, F, G). Data are presented as mean ± SEM. Statistical significance: *p < 0.05,**p < 0.01,***p < 0.001.CC BY · PubMed Central
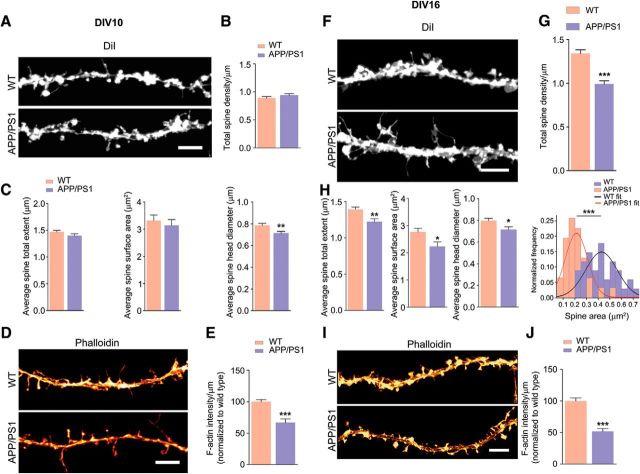
Figure 3. Loss of total dendritic spines, spine total extent, spine surface area, spine head diameter, and F-actin in APP/PS1 primary cortical neurons. A, F, Primary cortical neurons were fixed at DIV 10 and DIV 16 and analyzed. Representative confocal images of dendritic spines were visualized by DiI labeling. B, C, Quantitative dendritic spine analysis: B, DIV 10; total spine density, p = 0.2056, t = 1.283, df = 48; C, Spine total extent, p = 0.1654, t = 1.409, df = 47; spine surface area, p = 0.5573, t = 0.5911, df = 47; spine head diameter, p = 0.0063, t = 2.860, df = 47. D, Confocal images showing F-actin staining of tertiary dendrite using phalloidin labeling. Scale bar, 5 μm. E, F-actin quantification (DIV 10; p < 0.0001, t = 5.162, df = 62). G, DIV 16 total spine density (p < 0.0001, t = 6.244, df = 58; H, spine total extent (p = 0.0017, t = 3.283, df = 58; spine surface area, p = 0.0166, t = 2.468, df = 58; spine head diameter, p = 0.0162, t = 2.477, df = 58). Cross-sectional area of 2D maximum intensity projections of spines (expressed as square micrometers) were plotted and fitted by normal distribution curve; the fit generated WT mean = 0.427, variance = 0.018; APP/PS1 mean = 0.213, variance = 0.009. Using unpaired two-tailed t test, the statistical significance is as follows: p < 0.0001, t = 7.293, df = 63. I, Confocal images showing F-actin staining of tertiary dendrite using phalloidin. Scale bar, 5 μm. J, F-actin quantification (DIV 16; p < 0.0001, t = 7.025, df = 62). E, J, Phalloidin (F-actin) quantification was performed from two tertiary neurites (similar lengths of dendrites including spines) from single neuron. Data are represented as mean ± SEM from three independent experiments. n = 30–34 neurites (5–6 neurons and 10–12 tertiary neurites from each independent experiment). Statistical significance: *p < 0.05,**p < 0.01,***p < 0.001. Statistical comparisons were performed using unpaired two-tailed t test.
Figure 3. Loss of total dendritic spines, spine total extent, spine surface area, spine head diameter, and F-actin in APP/PS1 primary cortical neurons. A, F, Primary cortical neurons were fixed at DIV 10 and DIV 16 and analyzed. Representative confocal images of dendritic spines were visualized by DiI labeling. B, C, Quantitative dendritic spine analysis: B, DIV 10; total spine density, p = 0.2056, t = 1.283, df = 48; C, Spine total extent, p = 0.1654, t = 1.409, df = 47; spine surface area, p = 0.5573, t = 0.5911, df = 47; spine head diameter, p = 0.0063, t = 2.860, df = 47. D, Confocal images showing F-actin staining of tertiary dendrite using phalloidin labeling. Scale bar, 5 μm. E, F-actin quantification (DIV 10; p < 0.0001, t = 5.162, df = 62). G, DIV 16 total spine density (p < 0.0001, t = 6.244, df = 58; H, spine total extent (p = 0.0017, t = 3.283, df = 58; spine surface area, p = 0.0166, t = 2.468, df = 58; spine head diameter, p = 0.0162, t = 2.477, df = 58). Cross-sectional area of 2D maximum intensity projections of spines (expressed as square micrometers) were plotted and fitted by normal distribution curve; the fit generated WT mean = 0.427, variance = 0.018; APP/PS1 mean = 0.213, variance = 0.009. Using unpaired two-tailed t test, the statistical significance is as follows: p < 0.0001, t = 7.293, df = 63. I, Confocal images showing F-actin staining of tertiary dendrite using phalloidin. Scale bar, 5 μm. J, F-actin quantification (DIV 16; p < 0.0001, t = 7.025, df = 62). E, J, Phalloidin (F-actin) quantification was performed from two tertiary neurites (similar lengths of dendrites including spines) from single neuron. Data are represented as mean ± SEM from three independent experiments. n = 30–34 neurites (5–6 neurons and 10–12 tertiary neurites from each independent experiment). Statistical significance: *p < 0.05,**p < 0.01,***p < 0.001. Statistical comparisons were performed using unpaired two-tailed t test.CC BY · PubMed Central
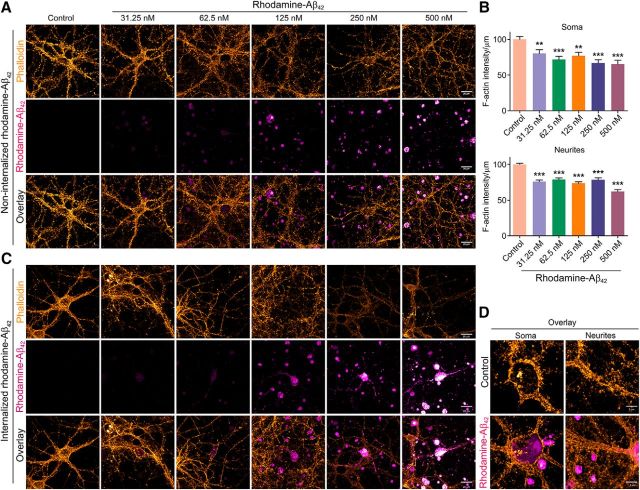
Figure 4. Exposure of primary cortical neurons to synthetic Aβ42 leads to decreased F-actin levels. A, Primary cortical neurons (DIV 16) were treated with or without different doses of synthetic rhodamine-tagged Aβ42 (31.25, 62.5, 125, 250, or 500 nm) for 24 h. Neurons were then fixed and stained with phalloidin. Representative confocal images in pseudocolor are shown with rhodamine-Aβ42 in magenta-hot and phalloidin in orange hot (Alexa Fluor 488). Scale bar, 20 μm. Images shown are from one of three independent experiments. B, Quantification of phalloidin signal from soma (p < 0.0001, F = 8.016, df = 142) and neurites (p < 0.0001, F = 32.7, df = 669). One-way ANOVA was used. n = 22–28 neurons from three independent experiments. Data are shown as mean ± SEM. Statistical significance: **p < 0.01,***p < 0.001. C, Rhodamine-tagged Aβ42 is internalized by a small percentage (∼10–15%) of primary cortical neurons exposed to it. Representative confocal images show cells that have internalized rhodamine-tagged Aβ42. Intensity of phalloidin signal (orange hot) was too low to be quantified for several of the cases. Scale bar, 20 μm. D, Representative high-resolution confocal images (magnified) are shown with rhodamine-Aβ42 in magenta hot and phalloidin in orange hot (Alexa Fluor 488). Imaging parameters were as follows: objective = 100×/1.4 NA, oil-immersion, pixel format = 1024 × 1024, bit depth = 16 bit, zoom factor = 1.8, and step size interval = 0.150 μm. Scale bar, 5 μm.
Figure 4. Exposure of primary cortical neurons to synthetic Aβ42 leads to decreased F-actin levels. A, Primary cortical neurons (DIV 16) were treated with or without different doses of synthetic rhodamine-tagged Aβ42 (31.25, 62.5, 125, 250, or 500 nm) for 24 h. Neurons were then fixed and stained with phalloidin. Representative confocal images in pseudocolor are shown with rhodamine-Aβ42 in magenta-hot and phalloidin in orange hot (Alexa Fluor 488). Scale bar, 20 μm. Images shown are from one of three independent experiments. B, Quantification of phalloidin signal from soma (p < 0.0001, F = 8.016, df = 142) and neurites (p < 0.0001, F = 32.7, df = 669). One-way ANOVA was used. n = 22–28 neurons from three independent experiments. Data are shown as mean ± SEM. Statistical significance: **p < 0.01,***p < 0.001. C, Rhodamine-tagged Aβ42 is internalized by a small percentage (∼10–15%) of primary cortical neurons exposed to it. Representative confocal images show cells that have internalized rhodamine-tagged Aβ42. Intensity of phalloidin signal (orange hot) was too low to be quantified for several of the cases. Scale bar, 20 μm. D, Representative high-resolution confocal images (magnified) are shown with rhodamine-Aβ42 in magenta hot and phalloidin in orange hot (Alexa Fluor 488). Imaging parameters were as follows: objective = 100×/1.4 NA, oil-immersion, pixel format = 1024 × 1024, bit depth = 16 bit, zoom factor = 1.8, and step size interval = 0.150 μm. Scale bar, 5 μm.CC BY · PubMed Central
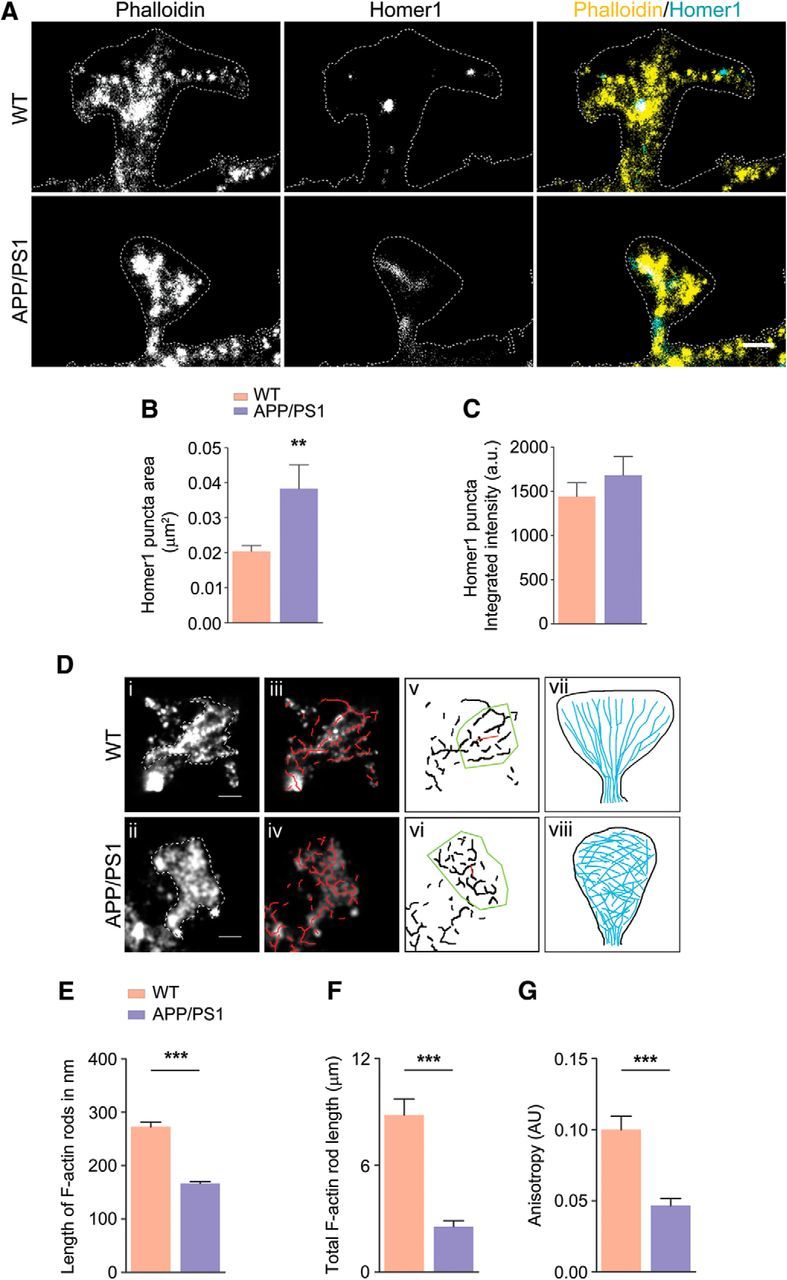
Figure 5. Perturbation of F-actin nanoarchitecture in dendritic spines of WT and APP/PS1 primary cortical neurons (see Fig. 5-1, and Fig. 5-2). A, Representative reconstructed images of mushroom spines from WT and APP/PS1 primary neurons; merged images show phalloidin signal in yellow and Homer1 signal in cyan. B, Homer1 puncta area showing a significant increase in case of APP/PS1 (p = 0.0014, t = 3.291, df = 102). C, No change was detected in integrated intensity of Homer1 puncta (p = 0.3634, t = 0.9131, df = 102). D, Automated filament detection and orientation were performed on representative WT (i) and APP/PS1 (ii) spines obtained using dSTORM imaging (iii) and indicate the overlay of automatically detected actin rods (red; iv) labeled with phalloidin–Alexa Fluor 647 in mushroom spines indicated in i and ii; v and vi indicate anisotropy of the actin organization within WT and APP/PS1, respectively. The length of the red line in the ROI (yellow) indicates the extent of anisotropy for the spines in i and ii, 0.19 for WT and 0.06 for APP/PS1, whereas the angle that it makes indicates average orientation of fibrils vii and viii indicate the scheme of actin distribution in WT, where actin rods are organized laterally, and in APP/PS1 spines, where this organization is lost. E, Comparison of mean length of actin rods in WT and APP/PS1 spines indicating that WT spines have significantly longer actin structures within them compared with APP/PS1 spines. n = 30 for WT and n = 30 for APP/PS1 (p < 0.0001, t = 8.103, df = 1244). F, Comparison of cumulative rod length in WT and APP/PS1 indicating the significant reduction of F-actin. n = 30 for WT and n = 30 for APP/PS1 (p < 0.0001, t = 6.491, df = 58). G, Comparison of mean anisotropy of WT and APP/PS1 spines indicating that WT spines (n = 25) have significantly more directed actin structures within them compared with APP/PS1 spines (n = 25) (p < 0. 0001, t = 5.015, df = 49). Statistical comparison was performed using unpaired two-tailed t test. **p < 0.01,***p < 0.001. Scale bar, 500 nm.
Figure 5. Perturbation of F-actin nanoarchitecture in dendritic spines of WT and APP/PS1 primary cortical neurons (see Fig. 5-1, and Fig. 5-2). A, Representative reconstructed images of mushroom spines from WT and APP/PS1 primary neurons; merged images show phalloidin signal in yellow and Homer1 signal in cyan. B, Homer1 puncta area showing a significant increase in case of APP/PS1 (p = 0.0014, t = 3.291, df = 102). C, No change was detected in integrated intensity of Homer1 puncta (p = 0.3634, t = 0.9131, df = 102). D, Automated filament detection and orientation were performed on representative WT (i) and APP/PS1 (ii) spines obtained using dSTORM imaging (iii) and indicate the overlay of automatically detected actin rods (red; iv) labeled with phalloidin–Alexa Fluor 647 in mushroom spines indicated in i and ii; v and vi indicate anisotropy of the actin organization within WT and APP/PS1, respectively. The length of the red line in the ROI (yellow) indicates the extent of anisotropy for the spines in i and ii, 0.19 for WT and 0.06 for APP/PS1, whereas the angle that it makes indicates average orientation of fibrils vii and viii indicate the scheme of actin distribution in WT, where actin rods are organized laterally, and in APP/PS1 spines, where this organization is lost. E, Comparison of mean length of actin rods in WT and APP/PS1 spines indicating that WT spines have significantly longer actin structures within them compared with APP/PS1 spines. n = 30 for WT and n = 30 for APP/PS1 (p < 0.0001, t = 8.103, df = 1244). F, Comparison of cumulative rod length in WT and APP/PS1 indicating the significant reduction of F-actin. n = 30 for WT and n = 30 for APP/PS1 (p < 0.0001, t = 6.491, df = 58). G, Comparison of mean anisotropy of WT and APP/PS1 spines indicating that WT spines (n = 25) have significantly more directed actin structures within them compared with APP/PS1 spines (n = 25) (p < 0. 0001, t = 5.015, df = 49). Statistical comparison was performed using unpaired two-tailed t test. **p < 0.01,***p < 0.001. Scale bar, 500 nm.CC BY · PubMed Central
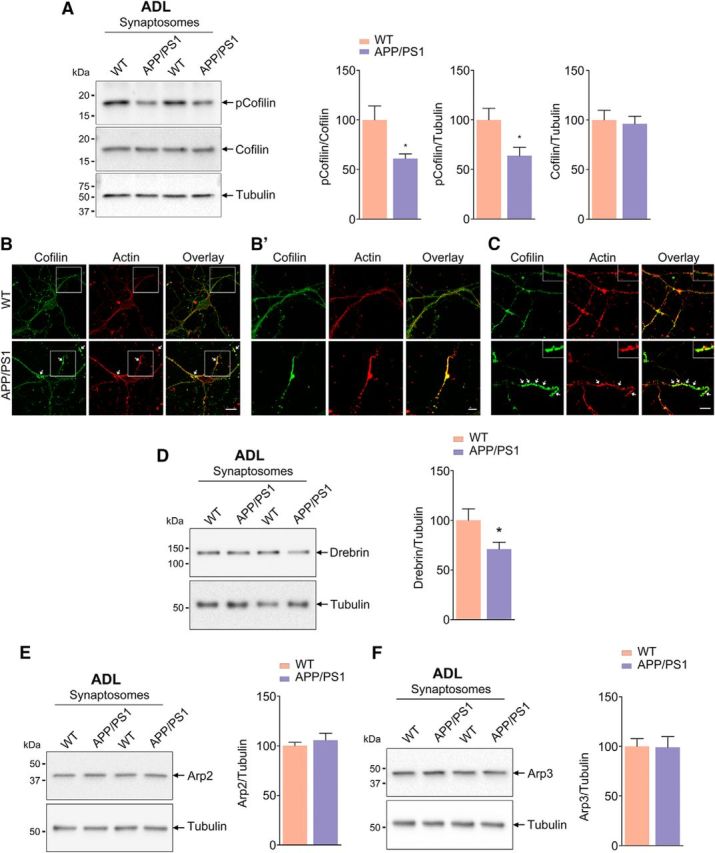
Figure 6. Decreased ADF/cofilin phosphorylation and Drebrin levels in synaptosomes of APP/PS1 mice (see Fig. 6-1). A, Phosphorylation of cofilin (Ser3) is reduced in synaptosomes isolated from ADL APP/PS1 mice compared with age-matched WT mice. Statistical analysis: p-cofilin/cofilin, p = 0.0181, t = 2.631, df = 16; p-cofilin/tubulin, p = 0.0238, t = 2.498, df = 16; cofilin/tubulin, p = 0.7692, t = 0.3051, df = 16; n = 8–9 per group. B, C, ADF/cofilin-actin rods observed in primary neurons derived from APP/PS1 mice. Representative confocal images of primary cortical neurons from WT and APP/PS1 mice immunostained for actin (red) and cofilin (green). Arrows indicates ADF/cofilin-actin rods (B′). Insets show magnified images. Scale bar, 5 μm. D, Drebrin levels are reduced in synaptosomes isolated from ADL APP/PS1 mice compared with age-matched WT mice. Statistical analysis: Drebrin/tubulin, p = 0.0458, t = 2.146, df = 18; n = 10 per group. E, F, Arp2 and Arp3 protein levels are unaffected in synaptosomes isolated from ADL APP/PS1 mice compared with age-matched WT mice. Statistical analysis: Arp2/tubulin, p = 0.4899, t = 0.7090, df = 14; Arp3/tubulin, p = 0.9445, t = 0.07088, df = 14; n = 8 per group. Unpaired two-tailed t test was used. Asterisks indicate statistical significance for WT versus APP/PS1.
Figure 6. Decreased ADF/cofilin phosphorylation and Drebrin levels in synaptosomes of APP/PS1 mice (see Fig. 6-1). A, Phosphorylation of cofilin (Ser3) is reduced in synaptosomes isolated from ADL APP/PS1 mice compared with age-matched WT mice. Statistical analysis: p-cofilin/cofilin, p = 0.0181, t = 2.631, df = 16; p-cofilin/tubulin, p = 0.0238, t = 2.498, df = 16; cofilin/tubulin, p = 0.7692, t = 0.3051, df = 16; n = 8–9 per group. B, C, ADF/cofilin-actin rods observed in primary neurons derived from APP/PS1 mice. Representative confocal images of primary cortical neurons from WT and APP/PS1 mice immunostained for actin (red) and cofilin (green). Arrows indicates ADF/cofilin-actin rods (B′). Insets show magnified images. Scale bar, 5 μm. D, Drebrin levels are reduced in synaptosomes isolated from ADL APP/PS1 mice compared with age-matched WT mice. Statistical analysis: Drebrin/tubulin, p = 0.0458, t = 2.146, df = 18; n = 10 per group. E, F, Arp2 and Arp3 protein levels are unaffected in synaptosomes isolated from ADL APP/PS1 mice compared with age-matched WT mice. Statistical analysis: Arp2/tubulin, p = 0.4899, t = 0.7090, df = 14; Arp3/tubulin, p = 0.9445, t = 0.07088, df = 14; n = 8 per group. Unpaired two-tailed t test was used. Asterisks indicate statistical significance for WT versus APP/PS1.CC BY · PubMed Central
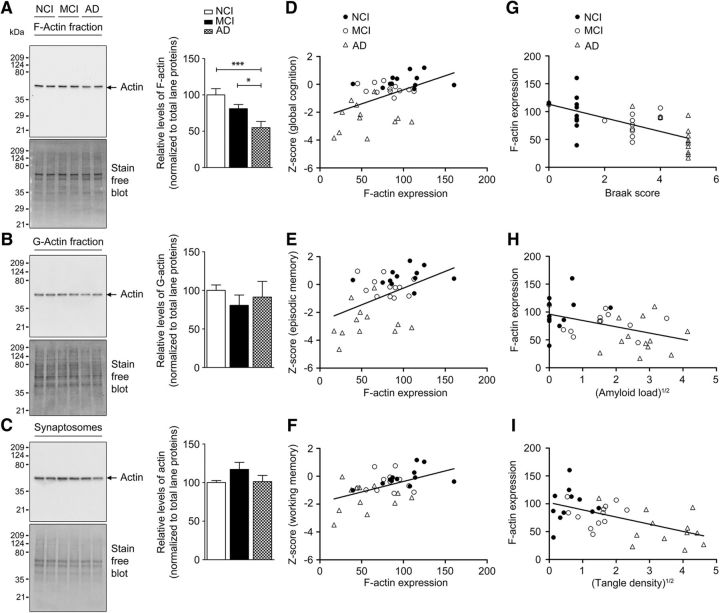
Figure 7. Decreased F-actin levels in synaptosomes from AD patients. A–C, Enriched F-actin and G-actin fractions were isolated from synaptosomes of NCI, MCI, and AD human brain cortex samples. All fractions were subjected to TGX-stain-free gels and immunoblotted with antibody to actin. Densitometric analyses for F-actin, G-actin, and total actin levels were normalized to total lane proteins. Results are shown as the mean ± SEM of 12 samples per group except in the case of synaptosomes, in which n = 8 per group. Statistical analysis: A, quantification of F-actin, p = 0.0011, F = 8.475, df = 35; B, quantification of G-actin, p = 0.6493, F = 0.4375, df = 35; C, quantification of total actin (p = 0.1937, F = 1.777, df = 23). One-way ANOVA followed by Newman–Keuls post test was used. *p < 0.05, ***p < 0.001 indicates statistical significance for control versus AD and MCI versus AD (n = 36). F-actin loss is associated with loss of memory-related cognitive performance and AD-related histopathology. Selected GLM analyses results from Tables 1 and 2 have been plotted for the primary factors. D–F, Effects of F-actin expression on cognitive performance after controlling for education and age at death with regression curves plotting global cognitive score (D), episodic memory score (E), and working memory score (F) against synaptosomal F-actin. G–I, Effects of AD-related histopathological scores on F-actin expression after controlling for postmortem delay and age at death with regression curves plotting synaptosomal F-actin levels against Braak scores (G), square root of amyloid load (H), and square root of tangle density (I). Respective p-values are listed in Tables 1 and 2 (n = 36).
Figure 7. Decreased F-actin levels in synaptosomes from AD patients. A–C, Enriched F-actin and G-actin fractions were isolated from synaptosomes of NCI, MCI, and AD human brain cortex samples. All fractions were subjected to TGX-stain-free gels and immunoblotted with antibody to actin. Densitometric analyses for F-actin, G-actin, and total actin levels were normalized to total lane proteins. Results are shown as the mean ± SEM of 12 samples per group except in the case of synaptosomes, in which n = 8 per group. Statistical analysis: A, quantification of F-actin, p = 0.0011, F = 8.475, df = 35; B, quantification of G-actin, p = 0.6493, F = 0.4375, df = 35; C, quantification of total actin (p = 0.1937, F = 1.777, df = 23). One-way ANOVA followed by Newman–Keuls post test was used. *p < 0.05, ***p < 0.001 indicates statistical significance for control versus AD and MCI versus AD (n = 36). F-actin loss is associated with loss of memory-related cognitive performance and AD-related histopathology. Selected GLM analyses results from Tables 1 and 2 have been plotted for the primary factors. D–F, Effects of F-actin expression on cognitive performance after controlling for education and age at death with regression curves plotting global cognitive score (D), episodic memory score (E), and working memory score (F) against synaptosomal F-actin. G–I, Effects of AD-related histopathological scores on F-actin expression after controlling for postmortem delay and age at death with regression curves plotting synaptosomal F-actin levels against Braak scores (G), square root of amyloid load (H), and square root of tangle density (I). Respective p-values are listed in Tables 1 and 2 (n = 36).CC BY · PubMed Central

Verification

Claims the paper makes

The claims and statistics of this paper haven’t been checked yet.

Run the check — free, no account needed. It reads the open-access text and checks the sources it cites.

A few free checks a day · papers already verified open instantly · results are public

Claims other papers make about this one

Each is checked against this paper’s own text: does it say what the citing paper says it does?

Self-check

Percentages, sums and reported differences re-computed from the paper’s own numbers.

The self-check needs the paper’s full text.

Citations

Cites

1 retracted

Show all 71 references

Cited by

Sorted by citations

See all 135

Metadata

Authors
Kommaddi, R. P., Das, D., Karunakaran, S., Nanguneri, S., Bapat, D., Ray, A., Shaw, E., Bennett, D. A., Nair, D., & Ravindranath, V.
Affiliations
  • Indian Institute of Science Bangalore (IN)
  • Rush University Medical Center (US)
Corresponding author
Ravindranath, Vijayalakshmi
Venue
The Journal of Neuroscience
Published
2017-12-15
Volume
38
Issue
5
Pages
1085-1099
ISSN
  • 0270-6474 (ISSN-L)
  • 1529-2401
OpenAlex
W2774657197
Cited by
135
References
71
Citations by year
2026: 3 · 2025: 22 · 2024: 13 · 2023: 16 · 2022: 13 · 2021: 25 · 2020: 17 · 2019: 20 · 2018: 6
FWCI
8.70
Type
journal article
Language
en
Open access
Locations
  • Journal of Neuroscience (publishedVersion, cc-by)
  • Europe PMC (PubMed Central) (publishedVersion, cc-by)
  • PubMed Central (publishedVersion, cc-by)
  • PubMed (publishedVersion)
  • NOT FOUND REPOSITORY (Indian Institute of Science Bangalore) (acceptedVersion)
Funders
  • Tata Trusts
  • Science and Engineering Research Board (PDF/2016/003226)
  • National Institute on Aging (R01AG017917, R01AG015819, P30AG010161, RF1AG015819)
Topics
  • Life Sciences › Neuroscience › Cellular and Molecular Neuroscience › Alzheimer's disease research and treatments
  • Life Sciences › Neuroscience › Cellular and Molecular Neuroscience › Neuroscience and Neuropharmacology Research
  • Health Sciences › Medicine › Psychiatry and Mental health › Dementia and Cognitive Impairment Research
Keywords
amyloid-beta, F-actin depolymerization, dendritic spines, actin cytoskeleton, synaptic dysfunction, APPswe/PS1ΔE9 mice, contextual fear conditioning, memory impairment, jasplakinolide, latrunculin, actin polymerization, postmortem brain, working memory
MeSH terms
Actins, Aging, Alzheimer Disease, Animals, Autopsy, Cognition Disorders, Conditioning, Classical, Fear, Female, Humans, Male, Mice, Inbred C57BL, Mice, Transgenic, Mental Recall, Synaptosomes, Amyloid beta-Peptides, Dendritic Spines, Actin Depolymerizing Factors, Mice, Cognitive Dysfunction, Primary Cell Culture

About these checks

Registry, retraction, Cites and statistics results are computed, not judged, with one exception: a printed reference that no index lists is read once by a model before it counts as a citation error. Claims are extracted by a model and kept only when their quote appears verbatim in the text; each cited source is then checked, with a model’s help, for whether it says what the claim relies on. Those verdicts can be wrong — read the claim’s quote and the cited source before relying on one.

Statistics and arithmetic are recomputed, not judged.

Confidence bands are shown only for fields calibrated on our annotated test set. None is calibrated yet, so no band is shown.

What counts as a claim ›How we measure confidence ›How we check this ›

Are you an author, or do you see a problem with this page? Request a review