

The DOI matches its Crossref record; 9 of the 9 references it cites were found in a registry or an index.
Central Resistin Induces Hepatic Insulin Resistance via Neuropeptide Y
Abstract
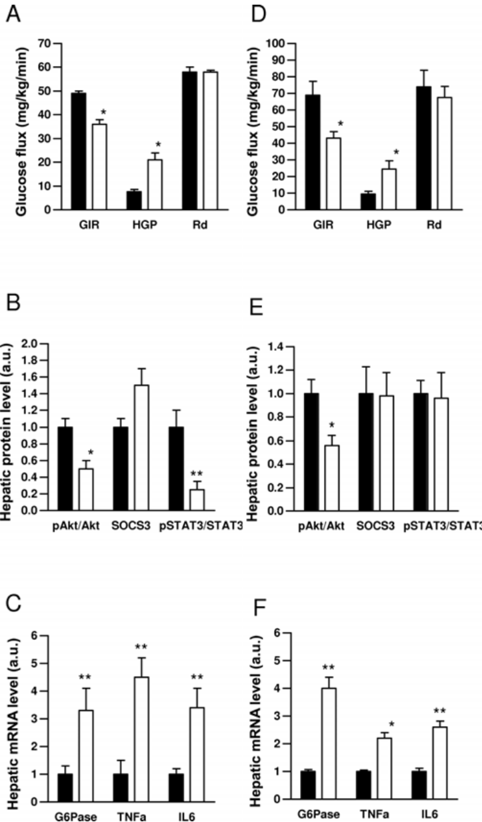
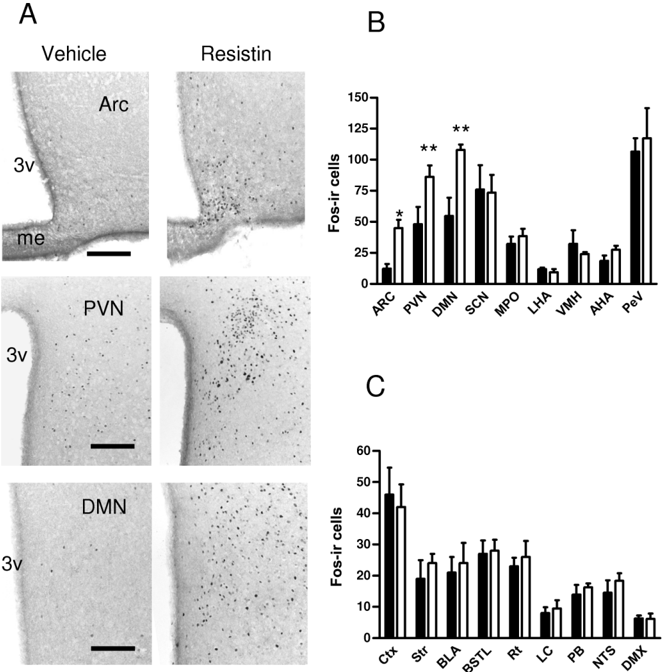
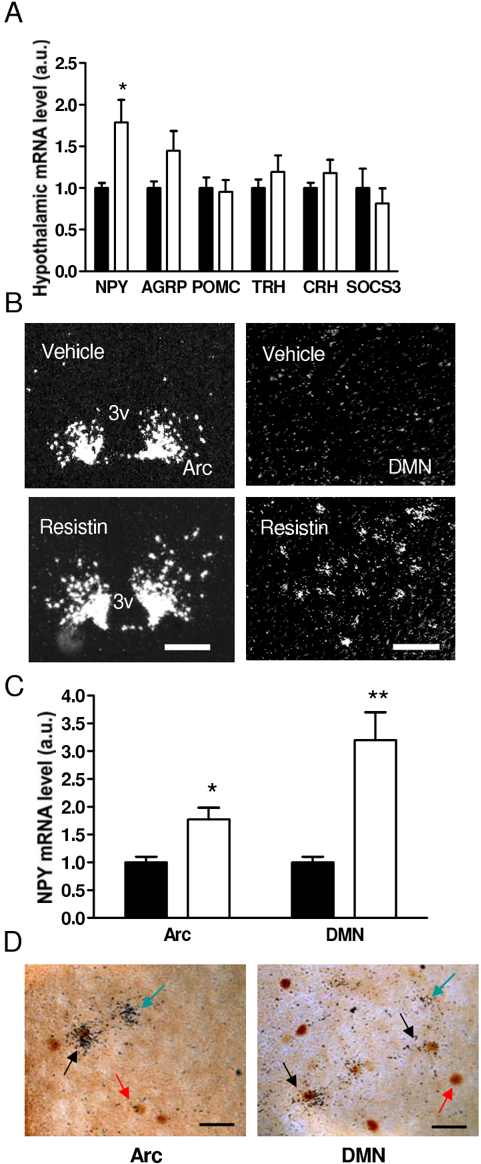
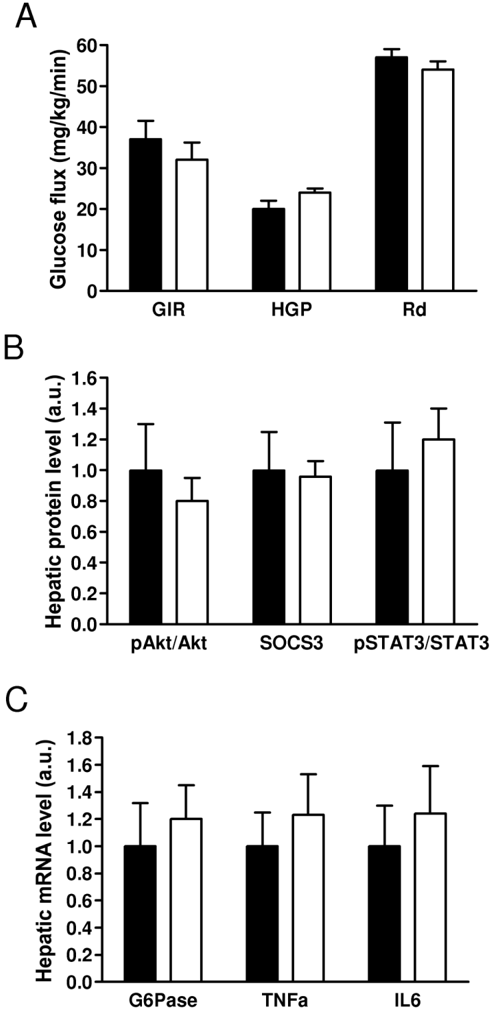
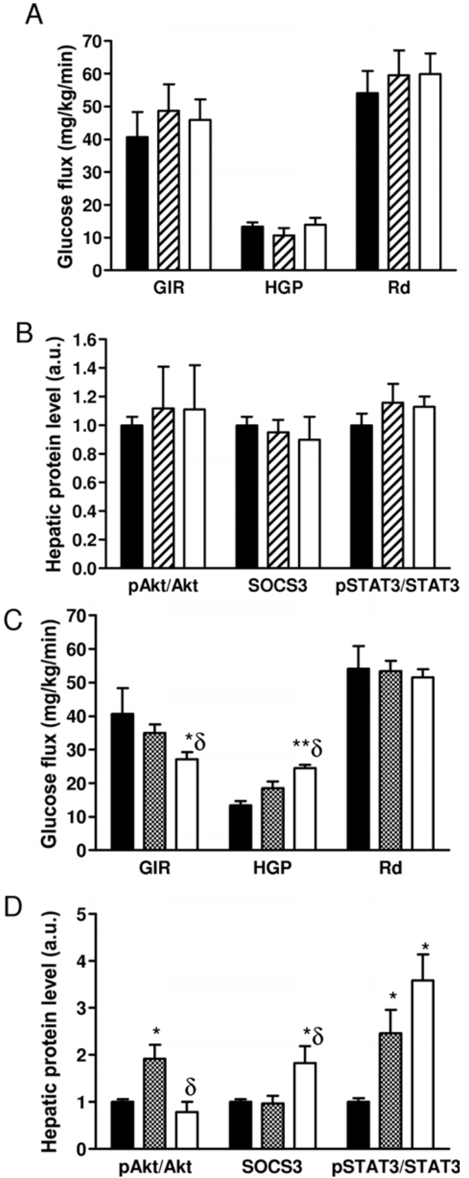
Sensing of peripheral hormones and nutrients by the hypothalamus plays an important role in maintaining peripheral glucose homeostasis. The hormone resistin impairs the response to insulin in liver and other peripheral tissues. Here we demonstrate that in normal mice resistin delivered in the lateral cerebral ventricle increased endogenous glucose production during hyperinsulinemic-euglycemic clamp, consistent with induction of hepatic insulin resistance. In agreement, central resistin inhibited Akt phosphorylation and increased the expression of glucose-6-phosphatase, the enzyme regulating glucose output in the liver. Central resistin induced expression of proinflammatory cytokines as well as suppressor of cytokine signaling-3, a negative regulator of insulin action in liver. Central infusion of resistin was associated with neuronal activation in the arcuate, paraventricular and dorsomedial nuclei, and increased neuropeptide Y (NPY) expression in the hypothalamus. The effects of central resistin on glucose production as well as hepatic expression of proinflammatory cytokines were abrogated in mice lacking NPY. Pretreatment of wild-type mice with antagonists of the NPY Y1 receptor, but not the Y5 receptor, also prevented the effects of central resistin. Together, these results suggest that resistin action on NPY neurons is an important regulator of hepatic insulin sensitivity.
Overview
The claims and statistics of this paper haven’t been checked yet.
Run the check — free, no account needed. It reads the open-access text and checks the sources it cites.
Integrity signals
Registry
Cites
Statistics
Figures
Verification
Claims the paper makes
The claims and statistics of this paper haven’t been checked yet.
Run the check — free, no account needed. It reads the open-access text and checks the sources it cites.
Claims other papers make about this one
Each is checked against this paper’s own text: does it say what the citing paper says it does?
In the citing paper
“Intriguingly, resistin mRNA expression has been detected in the hypothalamus [11], although its exact role within this brain region remains poorly defined.”
From The Resistin/TLR4/miR-155-5p axis: a novel signaling pathway in the onset of hypothalamic neuroinflammation (2025) · cites this paper as [11]
Self-check
Percentages, sums and reported differences re-computed from the paper’s own numbers.
The self-check needs the paper’s full text.
Citations
Cites
Inflammation and insulin resistance
Shoelson, S. E. (2006) · Journal of Clinical Investigation · doi:10.1172/jci29069 · Cited by 4,769
A role for ghrelin in the central regulation of feeding
Nakazato, M., Murakami, N., Date, Y., Kojima, M., Matsuo, H., Kangawa, K., & Matsukura, S. (2001) · Nature · doi:10.1038/35051587 · Cited by 3,443 · cited 1×
“…immunostaining does not establish whether a set of neurons are under the direct action of a hormone or stimulus, this technique has been useful in mapping CNS responses to leptin, various hormones and nutrients (Niimi et al., 1995; Elmquist et al., 1998; Elias et al., 2000; Nakazato et al., 2001).”
BackgroundAdipose Tissue as an Endocrine Organ
Ahima, R. S., & Flier, J. S. (2000) · Trends in Endocrinology & Metabolism · doi:10.1016/s1043-2760(00)00301-5 · Cited by 1,608
Self-citationAdiponectin acts in the brain to decrease body weight
Qi, Y., Takahashi, N., Hileman, S. M., Patel, H. R., Berg, A. H., Pajvani, U. B., Scherer, P. E., & Ahima, R. S. (2004) · Nature Medicine · doi:10.1038/nm1029 · Cited by 809
Self-citationInsulin Action in AgRP-Expressing Neurons Is Required for Suppression of Hepatic Glucose Production
Könner, A. C., Janoschek, R., Plum, L., Jordan, S. D., Rother, E., Ma, X., Xu, C., Enriori, P., Hampel, B., Barsh, G. S., et al. (2007) · Cell Metabolism · doi:10.1016/j.cmet.2007.05.004 · Cited by 695
Coppari, R., Ichinose, M., Lee, C. E., Pullen, A. E., Kenny, C. D., McGovern, R. A., Tang, V., Liu, S. M., Ludwig, T., Chua, S. C., et al. (2005) · Cell Metabolism · doi:10.1016/j.cmet.2004.12.004 · Cited by 457
A brain-liver circuit regulates glucose homeostasis
Pocai, A., Obici, S., Schwartz, G. J., & Rossetti, L. (2005) · Cell Metabolism · doi:10.1016/j.cmet.2004.11.001 · Cited by 392
Neural connections between the hypothalamus and the liver
Uyama, N., Geerts, A., & Reynaert, H. (2004) · The Anatomical Record Part A: Discoveries in Molecular, Cellular, and Evolutionary Biology · doi:10.1002/ar.a.20086 · Cited by 201
Marks, J. L., & Waite, K. (1997) · Journal of Neuroendocrinology · doi:10.1046/j.1365-2826.1997.00554.x · Cited by 80 · cited 2×
“A previous study has shown that infusion of NPY intracerebroventricularly impairs insulin sensitivity and increases endogenous glucose production (Marks and Waite, 1997; van den Hoek et al., 2004).”
Background
Research works printed but not linked: 39
- 10.1038/oby.2006.317 · DOI
- 10.1126/science.1092341 · DOI
- 10.1098/rstb.2006.1855 · DOI
- 10.1038/35013070 · DOI · Paper page
- 10.1172/JCI4188 · DOI
- 10.1016/0167-0115(96)00074-2 · DOI
- 10.1002/1096-9861(20000724)423:2<261::AID-CNE6>3.0.CO;2-6 · DOI
- 10.1073/pnas.95.2.741 · DOI
- 10.1172/JCI200316426 · DOI
- 10.1016/S0092-8674(03)01081-X · DOI
- 10.1097/00001756-199810260-00015 · DOI
- 10.1038/nature05485 · DOI · Paper page
- 10.1016/j.cmet.2006.02.009 · DOI
- 10.1016/j.cmet.2004.12.003 · DOI · Paper page
- 10.1523/JNEUROSCI.5328-03.2004 · DOI · Paper page
- 10.1016/j.cmet.2006.06.010 · DOI
- 10.1210/jc.2006-1841 · DOI
- Lin EJ Sainsbury A Lee NJ Boey D Couzens M Enriquez R Slack K Bland R During MJ Herzog H (2006) Combined deletion of Y1, Y2 and Y4 receptors prevents hypothalamic NPY overexpression-induced hyperinsulinemia despite persistence of hyperphagia and obesity. Endocrinology. · DOI
- 10.1172/JCI27775 · DOI
- 10.1038/nature02440 · DOI · Paper page
- 10.1080/00365510601032532 · DOI
- 10.1172/JCI200421270 · DOI
- 10.1172/JCI30440 · DOI
- 10.1016/0168-0102(95)00965-V · DOI
- 10.2337/db05-0624 · DOI
- 10.1126/science.1093466 · DOI
- 10.1074/jbc.M304869200 · DOI
- 10.2337/db05-0615 · DOI
- 10.1172/JCI200316521 · DOI
- 10.2337/diabetes.53.7.1671 · DOI
- 10.2337/diabetes.53.8.1937 · DOI
- 10.1172/JCI200420785 · DOI
- 10.1126/science.1104344 · DOI · Paper page
- 10.2337/diabetes.55.03.06.db05-0841 · DOI
- 10.1128/MCB.25.4.1569-1575.2005 · DOI
- 10.1016/j.jhep.2004.05.006 · DOI
- 10.1210/en.139.11.4634 · DOI · Paper page
- 10.2337/diabetes.53.10.2529 · DOI · Paper page
- 10.1159/000084871 · DOI
Cited by
Sorted by citations
Rapamycin-Induced Insulin Resistance Is Mediated by mTORC2 Loss and Uncoupled from Longevity
Lamming, D. W., Ye, L., Katajisto, P., Goncalves, M. D., Saitoh, M., Stevens, D. M., Davis, J. G., Salmon, A. B., Richardson, A., Ahima, R. S., et al. (2012) · Science · doi:10.1126/science.1215135 · Cited by 1,199
Self-citationPTP1B and SHP2 in POMC neurons reciprocally regulate energy balance in mice
Banno, R., Zimmer, D., De Jonghe, B. C., Atienza, M., Rak, K., Yang, W., & Bence, K. K. (2010) · Journal of Clinical Investigation · doi:10.1172/jci39620 · Cited by 214
Richards, J. C., Johnson, T. K., Kuzma, J. N., Lonac, M. C., Schweder, M. M., Voyles, W. F., & Bell, C. (2010) · The Journal of Physiology · doi:10.1113/jphysiol.2010.189886 · Cited by 187
The effects of a soluble activin type IIB receptor on obesity and insulin sensitivity
Akpan, I., Goncalves, M. D., Dhir, R., Yin, X., Pistilli, E. E., Bogdanovich, S., Khurana, T. S., Ucran, J., Lachey, J., & Ahima, R. S. (2009) · International Journal of Obesity · doi:10.1038/ijo.2009.162 · Cited by 140
Self-citationGonciarz, M., Bielański, W., Partyka, R., Brzozowski, T., Konturek, P. C., Eszyk, J., Celiński, K., Reiter, R. J., & Konturek, S. J. (2013) · Journal of Pineal Research · doi:10.1111/j.1600-079x.2012.01023.x · Cited by 56
Prévost, M., Crépin, D., Rifai, S. A., Poizat, G., Gonçalves, M., van Barneveld, F., Shadpay, R., Taouis, K., Riffault, L., Benomar, Y., et al. (2025) · Journal of Neuroinflammation · doi:10.1186/s12974-025-03522-3 · Cited by 19
Metadata
- Authors
- Singhal, N. S., Lazar, M. A., & Ahima, R. S.
- Venue
- The Journal of Neuroscience
- Publisher
- Society for Neuroscience
- Published
- 2007-11-21
- Volume
- 27
- Issue
- 47
- Pages
- 12924-12932
- ISSN
- 0270-6474
- 1529-2401
- Cited by
- 75
- References
- 9
- Language
- en
About these checks
Registry, retraction, Cites and statistics results are computed, not judged, with one exception: a printed reference that no index lists is read once by a model before it counts as a citation error. Claims are extracted by a model and kept only when their quote appears verbatim in the text; each cited source is then checked, with a model’s help, for whether it says what the claim relies on. Those verdicts can be wrong — read the claim’s quote and the cited source before relying on one.
Statistics and arithmetic are recomputed, not judged.
Confidence bands are shown only for fields calibrated on our annotated test set. None is calibrated yet, so no band is shown.
What counts as a claim ›How we measure confidence ›How we check this ›
Are you an author, or do you see a problem with this page? Request a review
