Cited by 121Hippo pathway signaling and YAP/TAZProtein Kinase Regulation and GTPase SignalingMicrotubule and mitosis dynamics

The DOI matches its Crossref record; 49 of the 49 references it cites were found in a registry or an index.

Opposing activities of the Ras and Hippo pathways converge on regulation of YAP protein turnover

Open access

Abstract

Cancer genomes accumulate numerous genetic and epigenetic modifications. Yet, human cellular transformation can be accomplished by a few genetically defined elements. These elements activate key pathways required to support replicative immortality and anchorage independent growth, a predictor of tumorigenesis in vivo. Here, we provide evidence that the Hippo tumor suppressor pathway is a key barrier to Ras-mediated cellular transformation. The Hippo pathway targets YAP1 for degradation via the βTrCP-SCF ubiquitin ligase complex. In contrast, the Ras pathway acts oppositely, to promote YAP1 stability through downregulation of the ubiquitin ligase complex substrate recognition factors SOCS5/6. Depletion of SOCS5/6 or upregulation of YAP1 can bypass the requirement for oncogenic Ras in anchorage independent growth in vitro and tumor formation in vivo. Through the YAP1 target, Amphiregulin, Ras activates the endogenous EGFR pathway, which is required for transformation. Thus, the oncogenic activity of Ras(V12) depends on its ability to counteract Hippo pathway activity, creating a positive feedback loop, which depends on stabilization of YAP1.

Overview

The claims and statistics of this paper haven’t been checked yet.

Run the check — free, no account needed. It reads the open-access text and checks the sources it cites.

A few free checks a day · papers already verified open instantly · results are public

Integrity signals

Registry

Crossref · 10.15252/embj.201489385

Cites

49 of 49 references verified0 citation errors · 0 not checkable

Statistics

Figures

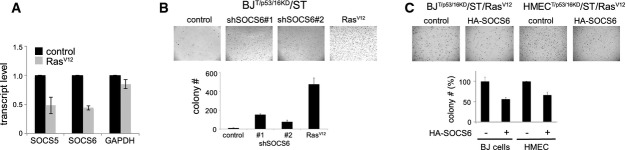
Figure 1 Downregulation of SOCS6 is required for Ras-mediated cellular transformation Effect of RasV12 expression on SOCS5 and SOCS6 mRNA levels. BJT/p53/p16KD/ST cells were transduced to express RasV12 or with empty vector as a control. P < 0.05 comparing RNA levels in control and RasV12-expressing cells (two-tailed Student's t-test). GAPDH mRNA was used as a control.Effect of SOCS5/6 depletion on soft agar colony formation. BJT/p53p16KD/ST cells were transduced to express shRNAs targeting SOCS5/6 or RasV12. Two independent shRNAs were used. Colony number: average of three independent experiment ± SD. t-test (two-tailed unequal variance): P < 0.05 comparing sh#1 or sh#2 to the vector control.Effect of SOCS6 overexpression on soft agar colony formation. BJT/p53/p16KD/ST/ER-RasV12 cells and HMECT/p53/p16KD/ST/ER-RasV12 cells were transduced to express SOCS6 or with empty vector as a control. Colony number: average of three independent experiments shown as % of the respective control ± SD. P < 0.05 comparing HA-SOCS6-expressing cells to their respective controls. SOCS6 and YAP immunoblot data for this experiment are shown in Fig3D.
Figure 1 Downregulation of SOCS6 is required for Ras-mediated cellular transformation Effect of RasV12 expression on SOCS5 and SOCS6 mRNA levels. BJT/p53/p16KD/ST cells were transduced to express RasV12 or with empty vector as a control. P < 0.05 comparing RNA levels in control and RasV12-expressing cells (two-tailed Student's t-test). GAPDH mRNA was used as a control.Effect of SOCS5/6 depletion on soft agar colony formation. BJT/p53p16KD/ST cells were transduced to express shRNAs targeting SOCS5/6 or RasV12. Two independent shRNAs were used. Colony number: average of three independent experiment ± SD. t-test (two-tailed unequal variance): P < 0.05 comparing sh#1 or sh#2 to the vector control.Effect of SOCS6 overexpression on soft agar colony formation. BJT/p53/p16KD/ST/ER-RasV12 cells and HMECT/p53/p16KD/ST/ER-RasV12 cells were transduced to express SOCS6 or with empty vector as a control. Colony number: average of three independent experiments shown as % of the respective control ± SD. P < 0.05 comparing HA-SOCS6-expressing cells to their respective controls. SOCS6 and YAP immunoblot data for this experiment are shown in Fig3D.CC BY · PubMed Central
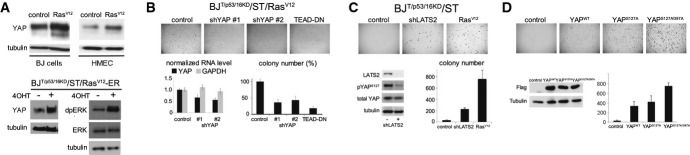
Figure 2 Regulation of YAP activity by Ras is required for cellular transformation Upper panels: effect of RasV12 expression on YAP1. BJ and HMEC T/p53/p16KD/ST cells were transduced to express RasV12 or with empty vector control and cultured for 4 days. Blots were probed with anti-YAP1 and with anti-tubulin to control for loading. Lower panels: BJT/p53/p16KD/ST cells were retrovirally transduced to express an estrogen receptor-RasV12 fusion protein. Cells were treated with 10−7 M 4-hydroxytamoxifen (4OHT) to activate RasV12. Right: anti-dpERK was used as a control for activation of ERK upon induction of ER-RasV12.BJT/p53p16KD/ST/RasV12 cells were transduced to express two different shRNAs targeting YAP1, or a dominant-negative form of TEAD2 (TEAD-DN). Lower left: YAP mRNA level was measured by quantitative PCR to monitor the efficacy of the shRNAs. Data show the average of three independent experiments ± SD. GAPDH RNA was used as a control. Lower right: Colony number: average of three independent experiments, represented as % of empty vector control ± SD. P < 0.05 comparing sh-YAP#1 to control. P < 0.01 comparing sh-YAP#2 to control. P < 0.001 comparing TEAD-DN to control.BJT/p53p16KD/ST cells were transduced to express an shRNA targeting LATS2. RasV12 was used as a positive control. Empty vector served as a negative control. LATS1 mRNA was undetectable in BJ and HMEC cells. Lower left: immunoblot for LATS2 protein to monitor the efficacy of the shRNA. The effect of LATS2 depletion on YAP activity was monitored by phospho-specific antibody to pS127 YAP. Anti-YAP and anti-tubulin were used to control for loading. Lower right: colony number: average of three independent experiments ± SD.BJT/p53p16KD/ST cells were transduced to express Flag-tagged wild-type YAP and mutant forms of YAP insensitive to LATS kinases. Empty vector served as a negative control. Lower left: immunoblot for YAP protein. Anti-tubulin was used to control for loading. Lower right: Colony number: average of three independent experiments ± SD. Comparable amounts of the three YAP proteins were expressed. Note the increased potency of the LATS-insensitive forms of YAP. Source data are available online for this figure.
Figure 2 Regulation of YAP activity by Ras is required for cellular transformation Upper panels: effect of RasV12 expression on YAP1. BJ and HMEC T/p53/p16KD/ST cells were transduced to express RasV12 or with empty vector control and cultured for 4 days. Blots were probed with anti-YAP1 and with anti-tubulin to control for loading. Lower panels: BJT/p53/p16KD/ST cells were retrovirally transduced to express an estrogen receptor-RasV12 fusion protein. Cells were treated with 10−7 M 4-hydroxytamoxifen (4OHT) to activate RasV12. Right: anti-dpERK was used as a control for activation of ERK upon induction of ER-RasV12.BJT/p53p16KD/ST/RasV12 cells were transduced to express two different shRNAs targeting YAP1, or a dominant-negative form of TEAD2 (TEAD-DN). Lower left: YAP mRNA level was measured by quantitative PCR to monitor the efficacy of the shRNAs. Data show the average of three independent experiments ± SD. GAPDH RNA was used as a control. Lower right: Colony number: average of three independent experiments, represented as % of empty vector control ± SD. P < 0.05 comparing sh-YAP#1 to control. P < 0.01 comparing sh-YAP#2 to control. P < 0.001 comparing TEAD-DN to control.BJT/p53p16KD/ST cells were transduced to express an shRNA targeting LATS2. RasV12 was used as a positive control. Empty vector served as a negative control. LATS1 mRNA was undetectable in BJ and HMEC cells. Lower left: immunoblot for LATS2 protein to monitor the efficacy of the shRNA. The effect of LATS2 depletion on YAP activity was monitored by phospho-specific antibody to pS127 YAP. Anti-YAP and anti-tubulin were used to control for loading. Lower right: colony number: average of three independent experiments ± SD.BJT/p53p16KD/ST cells were transduced to express Flag-tagged wild-type YAP and mutant forms of YAP insensitive to LATS kinases. Empty vector served as a negative control. Lower left: immunoblot for YAP protein. Anti-tubulin was used to control for loading. Lower right: Colony number: average of three independent experiments ± SD. Comparable amounts of the three YAP proteins were expressed. Note the increased potency of the LATS-insensitive forms of YAP. Source data are available online for this figure.CC BY · PubMed Central
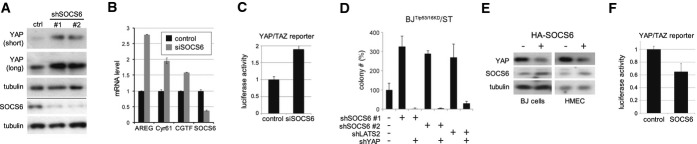
Figure 3 SOCS6 acts via YAP Effect of depleting SOCS5/6 on YAP1. BJT/p53/p16KD/RasV12/ST cells were transduced to express two independent shRNAs targeting SOCS6 or with empty vector. Blot probed with anti-YAP1. Anti-tubulin was used to control for loading. Below the line: Blot probed with anti-SOCS6 in a separate experiment.Quantitative real-time RT–PCR to measure YAP target levels in BJT/p53/p16KD/ST cells. Cells were treated with siRNA to deplete SOCS6 or with a scrambled control siRNA. The efficacy of SOCS6 depletion is shown at right. Error bars: mean ± SD for three independent experiments. Increased expression of the YAP targets was significant comparing SOCS6-depleted and control cells (ANOVA: P < 0.0001).Luciferase reporter assay. The 8× GTIIC luciferase reporter, containing 8 TEAD binding sites (Dupont et al, 2011), was used to monitor YAP/TAZ activity in HEK cells. Cells were transfected with siRNA to deplete SOCS6 or with a control siRNA. Data were normalized to co-transfected Renilla luciferase to control for transfection efficiency and to the empty vector control. Histogram: average of three independent experiments ± SD. P < 0.01 comparing SOCS6-depleted and control cells.Effect of co-depleting SOCS5/6 and YAP1 on colony formation. BJT/p53/p16KD/RasV12/ST cells were transduced to express shRNAs targeting SOCS6 or LATS2 with or without shRNA targeting YAP1. Colony number: average of three independent experiments, represented as % of control ± SD. P < 0.01 comparing sh-SOCS6#1 or #2 to control, P < 0.001 comparing sh-SOCS6#1 or #2 with and without shYAP. P < 0.05 comparing shLATS to control and shLATS with shYAP.Effect of SOCS6 overexpression on YAP1. BJT/p53/p16KD/RasV12/ST and HMECT/p53/p16KD/RasV12/ST cells were transduced to express HA-tagged SOCS6 or with an empty vector. Blots probed with anti-YAP1 and anti-tubulin.Luciferase reporter assay. HEK cells were transfected to express HA-SOCS6 or with empty vector as a control. Data were normalized to co-transfected Renilla luciferase to control for transfection efficiency and to the empty vector control. Histogram: average of three independent experiments ± SD. P < 0.05 comparing SOCS6-overexpressing cells to the vector control. Source data are available online for this figure.
Figure 3 SOCS6 acts via YAP Effect of depleting SOCS5/6 on YAP1. BJT/p53/p16KD/RasV12/ST cells were transduced to express two independent shRNAs targeting SOCS6 or with empty vector. Blot probed with anti-YAP1. Anti-tubulin was used to control for loading. Below the line: Blot probed with anti-SOCS6 in a separate experiment.Quantitative real-time RT–PCR to measure YAP target levels in BJT/p53/p16KD/ST cells. Cells were treated with siRNA to deplete SOCS6 or with a scrambled control siRNA. The efficacy of SOCS6 depletion is shown at right. Error bars: mean ± SD for three independent experiments. Increased expression of the YAP targets was significant comparing SOCS6-depleted and control cells (ANOVA: P < 0.0001).Luciferase reporter assay. The 8× GTIIC luciferase reporter, containing 8 TEAD binding sites (Dupont et al, 2011), was used to monitor YAP/TAZ activity in HEK cells. Cells were transfected with siRNA to deplete SOCS6 or with a control siRNA. Data were normalized to co-transfected Renilla luciferase to control for transfection efficiency and to the empty vector control. Histogram: average of three independent experiments ± SD. P < 0.01 comparing SOCS6-depleted and control cells.Effect of co-depleting SOCS5/6 and YAP1 on colony formation. BJT/p53/p16KD/RasV12/ST cells were transduced to express shRNAs targeting SOCS6 or LATS2 with or without shRNA targeting YAP1. Colony number: average of three independent experiments, represented as % of control ± SD. P < 0.01 comparing sh-SOCS6#1 or #2 to control, P < 0.001 comparing sh-SOCS6#1 or #2 with and without shYAP. P < 0.05 comparing shLATS to control and shLATS with shYAP.Effect of SOCS6 overexpression on YAP1. BJT/p53/p16KD/RasV12/ST and HMECT/p53/p16KD/RasV12/ST cells were transduced to express HA-tagged SOCS6 or with an empty vector. Blots probed with anti-YAP1 and anti-tubulin.Luciferase reporter assay. HEK cells were transfected to express HA-SOCS6 or with empty vector as a control. Data were normalized to co-transfected Renilla luciferase to control for transfection efficiency and to the empty vector control. Histogram: average of three independent experiments ± SD. P < 0.05 comparing SOCS6-overexpressing cells to the vector control. Source data are available online for this figure.CC BY · PubMed Central
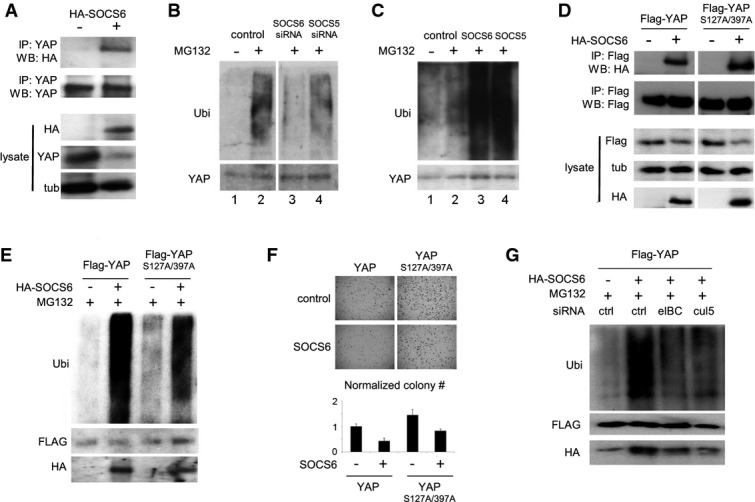
Figure 4 SOCS6 regulates YAP ubiquitylation Co-immunoprecipitation of SOCS6 with YAP1. HEK293T cells were transfected to express HA-tagged SOCS6 and treated with MG132 to block proteasome activity. Anti-YAP1 antibody was used for IP. Blots were probed with anti-HA to visualize HA-SOCS6. Total YAP1 was lower in cells expressing SOCS6. Co-transfection with ubiquitin increased recovery of SOCS6 in the YAP1 IP (not shown). 30% of the IP was loaded for immunoblot analysis. Lysate: 5% of the input.Effect of depleting SOCS5 and SOCS6 on YAP1 ubiquitylation. BJ cells were transfected with siRNAs to target SOCS5, SOCS6 or with a control siRNA. Cells were co-transfected with ubiquitin and treated with MG132 (+) or DMSO control (−) for 5 h before IP with anti-YAP1. Upper panel probed with anti-ubiquitin (Ubi). Lower panel probed with anti-YAP1. All samples were run on the same gel with an intervening lane removed (space between lanes 2 and 3).Effect of SOCS5 and SOCS6 overexpression on YAP1 ubiquitylation. Samples prepared as in (D).Co-IP of SOCS6 with phosphosite mutant YAP1. HEK293T cells were transfected to express HA-tagged SOCS6 and Flag-tagged YAP1 or YAP1S127A/S397A. Cells were treated with MG132. Anti-Flag antibody was used for IP. Blots were probed with anti-Flag to visualize recovered Flag YAP1 proteins and with anti-HA to visualize HA-SOCS6. All samples were run on the same gel with an intervening lane removed. 30% of the IP was loaded for immunoblot analysis.Effect of SOCS6 overexpression on YAP1 and YAP1S127A/S397A ubiquitylation. Samples prepared as in (D).Effect of SOCS6 overexpression on colony formation in BJT/p53/p16KD/ST cells expressing YAP1 or YAP1S127A/S397A. Colony number is the average of three independent experiment normalized to YAP1 control cells without SOCS6 overexpression ± SD. P < 0.05 comparing SOCS6-expressing cells to their respective controls.HEK293T cells were transfected with Flag-tagged YAP1, HA-tagged SOCS6 and with siRNAs targeting Elongin B/C or Cullin-5. Left panel: samples were immunoprecipitated with anti-Flag and probed with the indicated antibodies. SOCS6 overexpression increased ubiquitylation of Flag-tagged YAP1. This increase was limited by depletion of either Elongin B/C or Cullin-5. Endogenous SOCS6 was recovered at lower level in the Flag-IP sample without SOCS6 overexpression. Source data are available online for this figure.
Figure 4 SOCS6 regulates YAP ubiquitylation Co-immunoprecipitation of SOCS6 with YAP1. HEK293T cells were transfected to express HA-tagged SOCS6 and treated with MG132 to block proteasome activity. Anti-YAP1 antibody was used for IP. Blots were probed with anti-HA to visualize HA-SOCS6. Total YAP1 was lower in cells expressing SOCS6. Co-transfection with ubiquitin increased recovery of SOCS6 in the YAP1 IP (not shown). 30% of the IP was loaded for immunoblot analysis. Lysate: 5% of the input.Effect of depleting SOCS5 and SOCS6 on YAP1 ubiquitylation. BJ cells were transfected with siRNAs to target SOCS5, SOCS6 or with a control siRNA. Cells were co-transfected with ubiquitin and treated with MG132 (+) or DMSO control (−) for 5 h before IP with anti-YAP1. Upper panel probed with anti-ubiquitin (Ubi). Lower panel probed with anti-YAP1. All samples were run on the same gel with an intervening lane removed (space between lanes 2 and 3).Effect of SOCS5 and SOCS6 overexpression on YAP1 ubiquitylation. Samples prepared as in (D).Co-IP of SOCS6 with phosphosite mutant YAP1. HEK293T cells were transfected to express HA-tagged SOCS6 and Flag-tagged YAP1 or YAP1S127A/S397A. Cells were treated with MG132. Anti-Flag antibody was used for IP. Blots were probed with anti-Flag to visualize recovered Flag YAP1 proteins and with anti-HA to visualize HA-SOCS6. All samples were run on the same gel with an intervening lane removed. 30% of the IP was loaded for immunoblot analysis.Effect of SOCS6 overexpression on YAP1 and YAP1S127A/S397A ubiquitylation. Samples prepared as in (D).Effect of SOCS6 overexpression on colony formation in BJT/p53/p16KD/ST cells expressing YAP1 or YAP1S127A/S397A. Colony number is the average of three independent experiment normalized to YAP1 control cells without SOCS6 overexpression ± SD. P < 0.05 comparing SOCS6-expressing cells to their respective controls.HEK293T cells were transfected with Flag-tagged YAP1, HA-tagged SOCS6 and with siRNAs targeting Elongin B/C or Cullin-5. Left panel: samples were immunoprecipitated with anti-Flag and probed with the indicated antibodies. SOCS6 overexpression increased ubiquitylation of Flag-tagged YAP1. This increase was limited by depletion of either Elongin B/C or Cullin-5. Endogenous SOCS6 was recovered at lower level in the Flag-IP sample without SOCS6 overexpression. Source data are available online for this figure.CC BY · PubMed Central
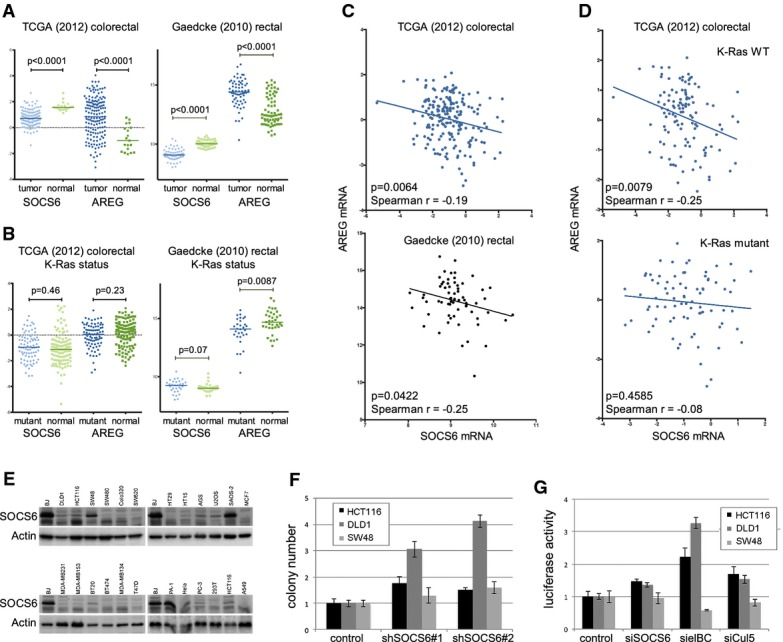
Figure 5 SOCS6 activity in colorectal cancer Scatter plots comparing SOCS6 and AREG mRNA levels in tumor and normal control samples from the TCGA colorectal cancer dataset (Network, 2012) and the Gaedcke rectal carcinoma dataset (Gaedcke et al, 2010). Median, upper, and lower quartiles are indicated. P-values were determined using the Mann–Whitney test (two-tailed).Scatter plots comparing SOCS6 and AREG mRNA levels in tumors with mutated versus normal K-Ras. P-values were determined using the Mann–Whitney test (two-tailed).Scatter plots comparing SOCS6 and AREG mRNA levels in individual tumors from the TCGA and Gaedcke datasets. Spearman's rho and P-value are shown in the figures.Scatter plots comparing SOCS6 and AREG mRNA levels in individual tumors from the TCGA dataset separated by K-Ras status.Immunoblots of a panel of cancer cell lines probed with anti-SOCS6 and anti-actin.Soft agar colony formation by three colorectal cancer cell lines transduced with shRNAs to deplete SOCS6 or with empty vector as a control. Data represent the average of three independent experiments ± SD. HCT116 and DLD1 cells P < 0.05 compared to control for each siRNA. SW48 cells: not significant.YAP/TAZ luciferase reporter assay in colorectal cancer cell lines transduced with shRNAs to deplete SOCS6, Elongin B/C, Cullin-5 or with empty vector as a control. Data represent the average of three independent experiments ± SD. HCT116 and DLD1 cells P < 0.05 compared to control for each siRNA. SW48 cells: not significant. Source data are available online for this figure.
Figure 5 SOCS6 activity in colorectal cancer Scatter plots comparing SOCS6 and AREG mRNA levels in tumor and normal control samples from the TCGA colorectal cancer dataset (Network, 2012) and the Gaedcke rectal carcinoma dataset (Gaedcke et al, 2010). Median, upper, and lower quartiles are indicated. P-values were determined using the Mann–Whitney test (two-tailed).Scatter plots comparing SOCS6 and AREG mRNA levels in tumors with mutated versus normal K-Ras. P-values were determined using the Mann–Whitney test (two-tailed).Scatter plots comparing SOCS6 and AREG mRNA levels in individual tumors from the TCGA and Gaedcke datasets. Spearman's rho and P-value are shown in the figures.Scatter plots comparing SOCS6 and AREG mRNA levels in individual tumors from the TCGA dataset separated by K-Ras status.Immunoblots of a panel of cancer cell lines probed with anti-SOCS6 and anti-actin.Soft agar colony formation by three colorectal cancer cell lines transduced with shRNAs to deplete SOCS6 or with empty vector as a control. Data represent the average of three independent experiments ± SD. HCT116 and DLD1 cells P < 0.05 compared to control for each siRNA. SW48 cells: not significant.YAP/TAZ luciferase reporter assay in colorectal cancer cell lines transduced with shRNAs to deplete SOCS6, Elongin B/C, Cullin-5 or with empty vector as a control. Data represent the average of three independent experiments ± SD. HCT116 and DLD1 cells P < 0.05 compared to control for each siRNA. SW48 cells: not significant. Source data are available online for this figure.CC BY · PubMed Central
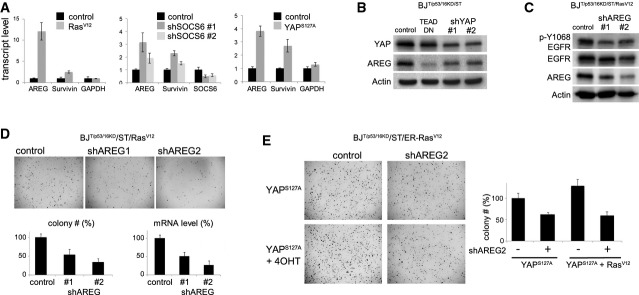
Figure 6 The Ras/SOCS/YAP/AREG feedback loop Upregulation of AREG and survivin in BJT/p53KD/p16KD/ST cells transduced to express RasV12, two independent shRNAs targeting SOCS5/6, or YAPS127A. RNA was isolated from a subset of the cells prepared for the colony formation assay in Fig3A. The immunoblot control for SOCS6 depletion is shown in Fig3A. Transcript levels were measured by quantitative PCR. Data: average of three independent experiments ± SD. GAPDH was used as a control.Immunoblot showing the effect of YAP depletion on AREG protein levels. BJT/p53KD/p16KD/ST cells were transduced to express two independent shRNAs targeting YAP or TEAD-DN. Blots were probed with antibody to YAP and AREG. Actin served as a loading control.Immunoblot showing the effect of AREG depletion on EGFR activity in BJT/p53KD/p16KD/ST/Rasv12 cells. Cells were transduced to express two independent shRNAs targeting AREG. Blots were probed with antibody to Y1068 phosphorylated EGFR to monitor EGFR activity, and with antibody to EGFR and AREG. Actin served as a loading control.Effect of AREG depletion on soft agar colony formation by fully transformation-competent BJT/p53KD/p16KD/ST/RasV12 cells. Cells were transduced to express two independent shRNAs targeting AREG or with empty vector as a control. Lower left: average colony number from three independent experiments ± SD shown as % of vector control. P < 0.05 comparing each siRNA to control. Lower right: AREG mRNA levels were measured by quantitative PCR to monitor shRNA efficacy.Effect of AREG depletion on soft agar colony formation by YAP1S127A-expressing cells. BJT/p53KD/p16KD/ST/ER-Rasv12 cells were transduced to express YAP1S127A and with shRNA targeting AREG or with empty vector as a control. Below: average colony number from three independent experiments ± SD, normalized to YAP1S127A-expressing cells. P < 0.05 comparing each siRNA to it respective control. Source data are available online for this figure.
Figure 6 The Ras/SOCS/YAP/AREG feedback loop Upregulation of AREG and survivin in BJT/p53KD/p16KD/ST cells transduced to express RasV12, two independent shRNAs targeting SOCS5/6, or YAPS127A. RNA was isolated from a subset of the cells prepared for the colony formation assay in Fig3A. The immunoblot control for SOCS6 depletion is shown in Fig3A. Transcript levels were measured by quantitative PCR. Data: average of three independent experiments ± SD. GAPDH was used as a control.Immunoblot showing the effect of YAP depletion on AREG protein levels. BJT/p53KD/p16KD/ST cells were transduced to express two independent shRNAs targeting YAP or TEAD-DN. Blots were probed with antibody to YAP and AREG. Actin served as a loading control.Immunoblot showing the effect of AREG depletion on EGFR activity in BJT/p53KD/p16KD/ST/Rasv12 cells. Cells were transduced to express two independent shRNAs targeting AREG. Blots were probed with antibody to Y1068 phosphorylated EGFR to monitor EGFR activity, and with antibody to EGFR and AREG. Actin served as a loading control.Effect of AREG depletion on soft agar colony formation by fully transformation-competent BJT/p53KD/p16KD/ST/RasV12 cells. Cells were transduced to express two independent shRNAs targeting AREG or with empty vector as a control. Lower left: average colony number from three independent experiments ± SD shown as % of vector control. P < 0.05 comparing each siRNA to control. Lower right: AREG mRNA levels were measured by quantitative PCR to monitor shRNA efficacy.Effect of AREG depletion on soft agar colony formation by YAP1S127A-expressing cells. BJT/p53KD/p16KD/ST/ER-Rasv12 cells were transduced to express YAP1S127A and with shRNA targeting AREG or with empty vector as a control. Below: average colony number from three independent experiments ± SD, normalized to YAP1S127A-expressing cells. P < 0.05 comparing each siRNA to it respective control. Source data are available online for this figure.CC BY · PubMed Central

Verification

Claims the paper makes

The claims and statistics of this paper haven’t been checked yet.

Run the check — free, no account needed. It reads the open-access text and checks the sources it cites.

A few free checks a day · papers already verified open instantly · results are public

Claims other papers make about this one

Each is checked against this paper’s own text: does it say what the citing paper says it does?

Self-check

Percentages, sums and reported differences re-computed from the paper’s own numbers.

The self-check needs the paper’s full text.

Citations

Cites

1 retracted

Show all 49 references

Cited by

Sorted by citations

Items 101–121 of 121

Metadata

Authors
Hong, X., Nguyen, H. T., Chen, Q., Zhang, R., Hagman, Z., Voorhoeve, P. M., & Cohen, S. M.
Affiliations
  • National University of Singapore (SG)
  • Singapore-MIT Alliance for Research and Technology (SG)
  • Stanford University (US)
  • University of Copenhagen (DK)
Corresponding author
Cohen, Stephen M
Venue
The EMBO Journal
Published
2014-09-01
Volume
33
Issue
21
Pages
2447-2457
ISSN
  • 0261-4189 (ISSN-L)
  • 1460-2075
OpenAlex
W2153517086
Cited by
121
References
49
Citations by year
2026: 2 · 2025: 4 · 2024: 7 · 2023: 12 · 2022: 4 · 2021: 15 · 2020: 12 · 2019: 10 · 2018: 13 · 2017: 15 · 2016: 18 · 2015: 8 · 2014: 1
FWCI
6.97
Type
journal article
Language
en
Open access
Locations
  • The EMBO Journal (publishedVersion, other-oa)
  • Europe PMC (PubMed Central) (publishedVersion, cc-by)
  • PubMed Central (publishedVersion, cc-by)
  • PubMed (publishedVersion)
  • Research at the University of Copenhagen (University of Copenhagen) (submittedVersion, cc-by)
Funders
  • NMRC (CBRG12nov010)
  • Duke‐NUS Signature Research Program
  • Ministry of Health (MOE2010‐T2‐2‐006)
  • IMCB
  • NovoNordisk Foundation Laureate Award
Topics
  • Life Sciences › Biochemistry, Genetics and Molecular Biology › Cell Biology › Hippo pathway signaling and YAP/TAZ
  • Life Sciences › Biochemistry, Genetics and Molecular Biology › Molecular Biology › Protein Kinase Regulation and GTPase Signaling
  • Life Sciences › Biochemistry, Genetics and Molecular Biology › Cell Biology › Microtubule and mitosis dynamics
Keywords
Ras signaling, Hippo signaling pathway, YAP, protein turnover, ubiquitin ligase, anchorage-independent growth, cell transformation, tumor suppressor, EGFR signaling, amphiregulin, positive feedback loop, oncogenic Ras
MeSH terms
Hippo Signaling Pathway, YAP-Signaling Proteins, Cell Transformation, Neoplastic, Humans, Phosphoproteins, Transcription Factors, Signal Transduction, Up-Regulation, Protein Serine-Threonine Kinases, ras Proteins, SKP Cullin F-Box Protein Ligases, beta-Transducin Repeat-Containing Proteins, Adaptor Proteins, Signal Transducing, Suppressor of Cytokine Signaling Proteins, Protein Stability, HEK293 Cells, ErbB Receptors

About these checks

Registry, retraction, Cites and statistics results are computed, not judged, with one exception: a printed reference that no index lists is read once by a model before it counts as a citation error. Claims are extracted by a model and kept only when their quote appears verbatim in the text; each cited source is then checked, with a model’s help, for whether it says what the claim relies on. Those verdicts can be wrong — read the claim’s quote and the cited source before relying on one.

Statistics and arithmetic are recomputed, not judged.

Confidence bands are shown only for fields calibrated on our annotated test set. None is calibrated yet, so no band is shown.

What counts as a claim ›How we measure confidence ›How we check this ›

Are you an author, or do you see a problem with this page? Request a review