Cited by 22DNA Repair MechanismsGenomics and Chromatin DynamicsMicrotubule and mitosis dynamics

The DOI matches its Crossref record; 4 of the 4 references it cites were found in a registry or an index.

Characterization of the REC114‐MEI4‐IHO1 complex regulating meiotic DNA double‐strand break formation

Open access
Laroussi, Hamida, Juarez‐Martinez, Ariadna B, Le Roy, Aline, Boeri Erba, Elisabetta, Gabel, Frank, de Massy, Bernard, Kadlec, Jan·2023·The EMBO Journal

Published version of a preprint

Abstract

Meiotic recombination is initiated by the formation of DNA double-strand breaks (DSBs), essential for fertility and genetic diversity. In the mouse, DSBs are formed by the catalytic TOPOVIL complex consisting of SPO11 and TOPOVIBL. To preserve genome integrity, the activity of the TOPOVIL complex is finely controlled by several meiotic factors including REC114, MEI4, and IHO1, but the underlying mechanism is poorly understood. Here, we report that mouse REC114 forms homodimers, that it associates with MEI4 as a 2:1 heterotrimer that further dimerizes, and that IHO1 forms coiled-coil-based tetramers. Using AlphaFold2 modeling combined with biochemical characterization, we uncovered the molecular details of these assemblies. Finally, we show that IHO1 directly interacts with the PH domain of REC114 by recognizing the same surface as TOPOVIBL and another meiotic factor ANKRD31. These results provide strong evidence for the existence of a ternary IHO1-REC114-MEI4 complex and suggest that REC114 could act as a potential regulatory platform mediating mutually exclusive interactions with several partners.

Overview

The claims and statistics of this paper haven’t been checked yet.

Run the check — free, no account needed. It reads the open-access text and checks the sources it cites.

A few free checks a day · papers already verified open instantly · results are public

Integrity signals

Registry

Crossref · 10.15252/embj.2023113866

Cites

4 of 4 references verified0 citation errors · 0 not checkable

Statistics

Figures

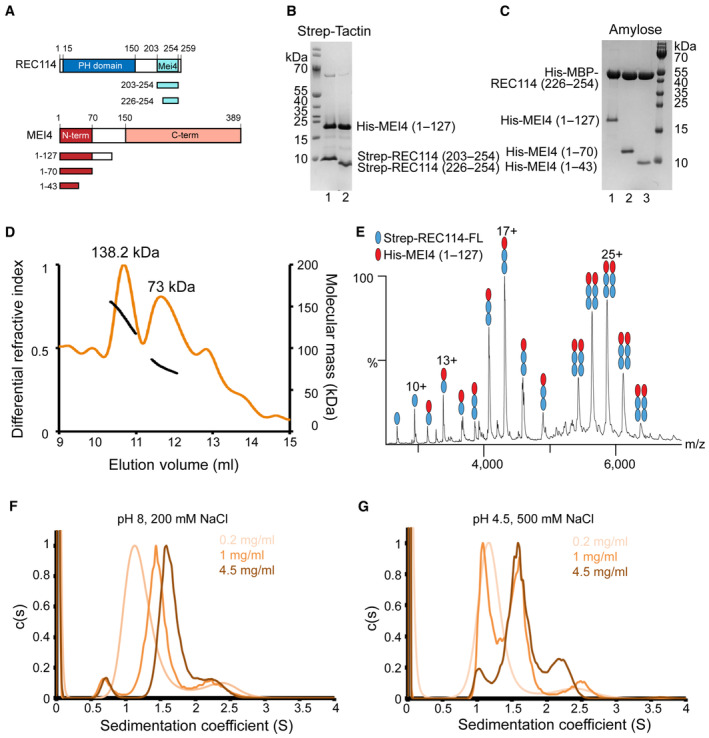
Figure 1 REC114‐MEI4 complex stoichiometry characterization Schematic representation of the domain structure of mouse REC114 (in blue) and MEI4 (in red ) and the constructs used in this study. PH, Pleckstrin homology domain; MEI4, MEI4 binding region.SDS–PAGE analysis of the binding of Strep‐tagged REC114 variants (using a single Strep‐tag [WSHPQFEK]) to co‐expressed His‐MEI41–127 after purification on Strep‐Tactin resin.SDS–PAGE analysis of the binding of His‐MBP‐REC114226–254 to co‐expressed His‐MEI4 variants after purification on Amylose resin.Molecular mass determination of the complex between the full‐length Strep‐REC114 and MEI41–127 by MALLS using Superdex 200 column. The calculated molecular weight of Strep‐REC114 is 29.5 kDa and of MEI4 is 14.5 kDa. The measured molecular mass of the two main peaks is 138.2 and 73 kDa corresponding to a REC114:MEI4 ratios 2:1 (73.4 kDa) and 4:2 (146.8 kDa), respectively. The injected sample was at 5 mg/ml.Native MS spectrum of co‐purified Strep‐REC114 and MEI41–127. The main complexes are Strep‐REC114:MEI41–127 in ratios 2:1 and 4:2. There are also free Strep‐REC114 and 1:1 Strep‐REC114‐MEI4 complex.Sedimentation velocity profiles of the REC114226–254‐MEI41–43 complex obtained at 280 nm at three concentrations (0.2, 1, and 4.5 mg/ml) in a solution containing 20 mM Tris pH 8.0 and 200 mM NaCl. Expected sedimentation coefficient for the 2:1 complex is 1.13S and for 4:2 is 1.58S. The sedimentation coefficient of the main peak increases with increasing protein concentration: s = 1.2S at 0.2 mg/ml, s = 1.44S at 1 mg/ml, and s = 1.64S at 4 mg/ml. These results suggest a fast exchange between the two forms.Sedimentation velocity profiles of the REC114226–254‐MEI41–43 complex obtained at 280 nm at three concentrations (0.2, 1, and 4.5 mg/ml) in a solution containing Sodium Acetate pH 4.5 and 500 mM NaCl. Expected sedimentation coefficient for the 2:1 complex is 1.13S and for the 4:2 complex is 1.58S. The sedimentation coefficient of the main peak is s = 1.13S at 0.2 mg/ml and s = 1.58S at 4 mg/ml. At 1 mg/ml, both forms of REC114226–254‐MEI41–43 are present. At pH 4.5, a slow exchange between the two forms is observed. Source data are available online for this figure.
Figure 1 REC114‐MEI4 complex stoichiometry characterization Schematic representation of the domain structure of mouse REC114 (in blue) and MEI4 (in red ) and the constructs used in this study. PH, Pleckstrin homology domain; MEI4, MEI4 binding region.SDS–PAGE analysis of the binding of Strep‐tagged REC114 variants (using a single Strep‐tag [WSHPQFEK]) to co‐expressed His‐MEI41–127 after purification on Strep‐Tactin resin.SDS–PAGE analysis of the binding of His‐MBP‐REC114226–254 to co‐expressed His‐MEI4 variants after purification on Amylose resin.Molecular mass determination of the complex between the full‐length Strep‐REC114 and MEI41–127 by MALLS using Superdex 200 column. The calculated molecular weight of Strep‐REC114 is 29.5 kDa and of MEI4 is 14.5 kDa. The measured molecular mass of the two main peaks is 138.2 and 73 kDa corresponding to a REC114:MEI4 ratios 2:1 (73.4 kDa) and 4:2 (146.8 kDa), respectively. The injected sample was at 5 mg/ml.Native MS spectrum of co‐purified Strep‐REC114 and MEI41–127. The main complexes are Strep‐REC114:MEI41–127 in ratios 2:1 and 4:2. There are also free Strep‐REC114 and 1:1 Strep‐REC114‐MEI4 complex.Sedimentation velocity profiles of the REC114226–254‐MEI41–43 complex obtained at 280 nm at three concentrations (0.2, 1, and 4.5 mg/ml) in a solution containing 20 mM Tris pH 8.0 and 200 mM NaCl. Expected sedimentation coefficient for the 2:1 complex is 1.13S and for 4:2 is 1.58S. The sedimentation coefficient of the main peak increases with increasing protein concentration: s = 1.2S at 0.2 mg/ml, s = 1.44S at 1 mg/ml, and s = 1.64S at 4 mg/ml. These results suggest a fast exchange between the two forms.Sedimentation velocity profiles of the REC114226–254‐MEI41–43 complex obtained at 280 nm at three concentrations (0.2, 1, and 4.5 mg/ml) in a solution containing Sodium Acetate pH 4.5 and 500 mM NaCl. Expected sedimentation coefficient for the 2:1 complex is 1.13S and for the 4:2 complex is 1.58S. The sedimentation coefficient of the main peak is s = 1.13S at 0.2 mg/ml and s = 1.58S at 4 mg/ml. At 1 mg/ml, both forms of REC114226–254‐MEI41–43 are present. At pH 4.5, a slow exchange between the two forms is observed. Source data are available online for this figure.CC BY-NC-ND · PubMed Central
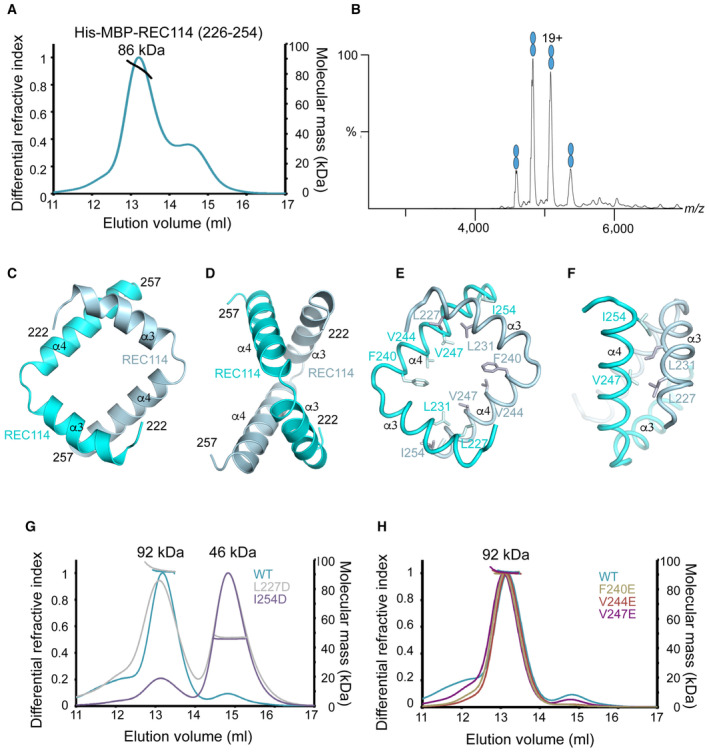
Figure 2 Characterization of the REC114 dimerization domain A Molecular mass determination of His‐MBP‐REC114226–254 by MALLS using Superdex 200 column. The calculated molecular weight of His‐MBP‐REC114226–254 is 48 kDa. The measured molecular mass of the main peak is 86 kDa, which corresponds to dimeric His‐MBP‐REC114226–254 of 96 kDa. The injected sample was at 3 mg/ml.B Native MS spectrum of His‐MBP‐REC114226–254. This protein is a dimer.C, D AlphaFold2 model of the REC114 dimer including its C terminus (residues 222–257). The secondary structures are labeled. The modeled complex structure colored according to the AlphaFold2 per‐residue estimate of confidence (pLDDT), and predicted aligned error plots are shown in Fig EV1D–F.E, F Details of the predicted interactions between the two REC114 molecules formed by the extremities of the two helices.G Comparison of molecular mass between WT and mutated versions of His‐MBP‐REC114222–256 by MALLS. L227D elutes partially as a monomer and I254D elutes mostly as a monomer. The injected samples were at 3 mg/ml.H Comparison of molecular mass between WT and mutated versions of His‐MBP‐REC114222–256 by MALLS. All three tested REC114 mutants remain dimeric. The injected samples were at 3 mg/ml. Source data are available online for this figure.
Figure 2 Characterization of the REC114 dimerization domain A Molecular mass determination of His‐MBP‐REC114226–254 by MALLS using Superdex 200 column. The calculated molecular weight of His‐MBP‐REC114226–254 is 48 kDa. The measured molecular mass of the main peak is 86 kDa, which corresponds to dimeric His‐MBP‐REC114226–254 of 96 kDa. The injected sample was at 3 mg/ml.B Native MS spectrum of His‐MBP‐REC114226–254. This protein is a dimer.C, D AlphaFold2 model of the REC114 dimer including its C terminus (residues 222–257). The secondary structures are labeled. The modeled complex structure colored according to the AlphaFold2 per‐residue estimate of confidence (pLDDT), and predicted aligned error plots are shown in Fig EV1D–F.E, F Details of the predicted interactions between the two REC114 molecules formed by the extremities of the two helices.G Comparison of molecular mass between WT and mutated versions of His‐MBP‐REC114222–256 by MALLS. L227D elutes partially as a monomer and I254D elutes mostly as a monomer. The injected samples were at 3 mg/ml.H Comparison of molecular mass between WT and mutated versions of His‐MBP‐REC114222–256 by MALLS. All three tested REC114 mutants remain dimeric. The injected samples were at 3 mg/ml. Source data are available online for this figure.CC BY-NC-ND · PubMed Central
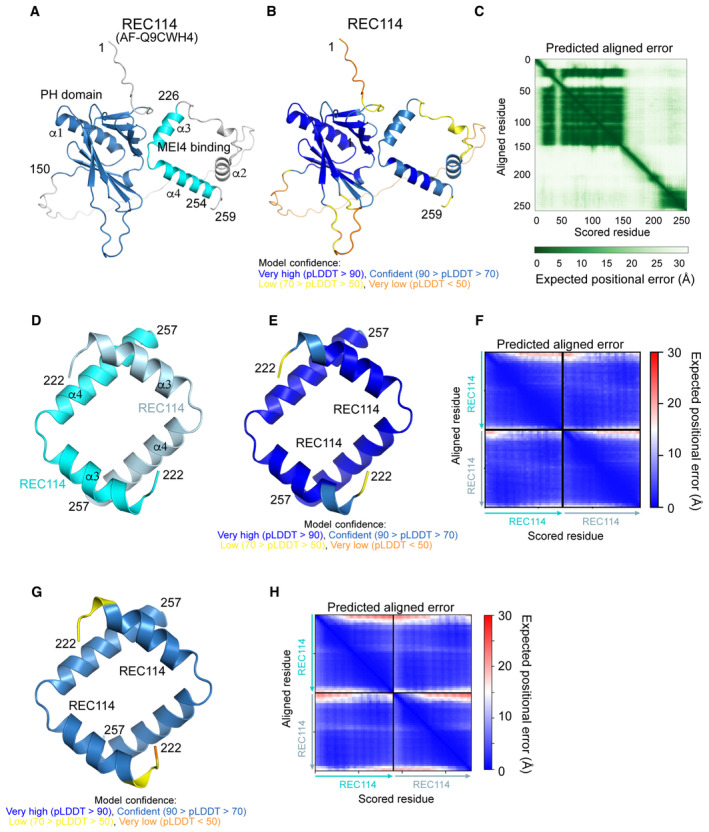
Figure EV1 Structure prediction of the REC114 dimer AlphaFold2 model of REC114 (AF‐Q9CWH4) colored by domain.AlphaFold2 model of REC114 (AF‐Q9CWH4) colored according to the AlphaFold2 per‐residue estimate of confidence (pLDDT).Predicted aligned error plot for the model shown in (A).AlphaFold2 model of the homodimeric complex of REC114222–527 colored by protein chain.AlphaFold2 model of the homodimeric complex of REC114222–257 colored according to pLDDT.Predicted aligned error plot for the model shown in (D).ESMfold model of the homodimeric complex of REC114222–257 colored according to pLDDT.Predicted aligned error plot for the ESMfold model shown in (G).
Figure EV1 Structure prediction of the REC114 dimer AlphaFold2 model of REC114 (AF‐Q9CWH4) colored by domain.AlphaFold2 model of REC114 (AF‐Q9CWH4) colored according to the AlphaFold2 per‐residue estimate of confidence (pLDDT).Predicted aligned error plot for the model shown in (A).AlphaFold2 model of the homodimeric complex of REC114222–527 colored by protein chain.AlphaFold2 model of the homodimeric complex of REC114222–257 colored according to pLDDT.Predicted aligned error plot for the model shown in (D).ESMfold model of the homodimeric complex of REC114222–257 colored according to pLDDT.Predicted aligned error plot for the ESMfold model shown in (G).CC BY-NC-ND · PubMed Central
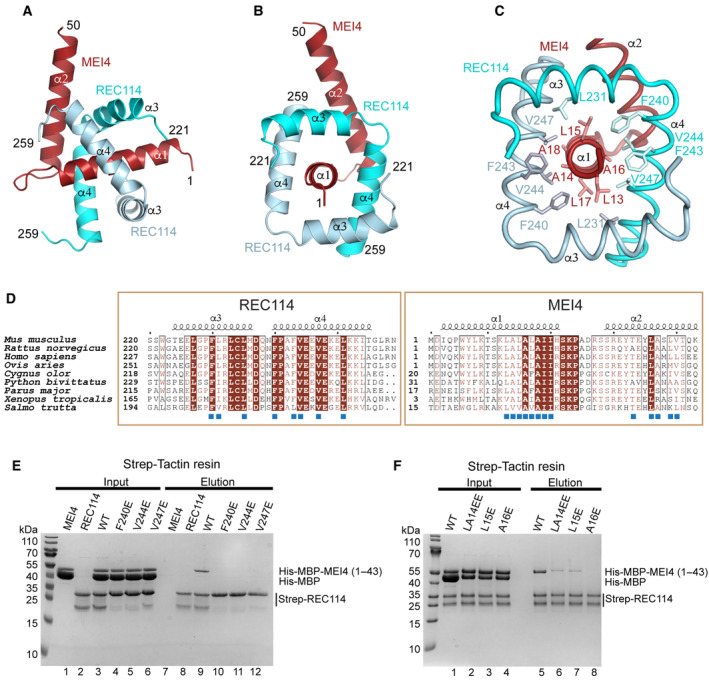
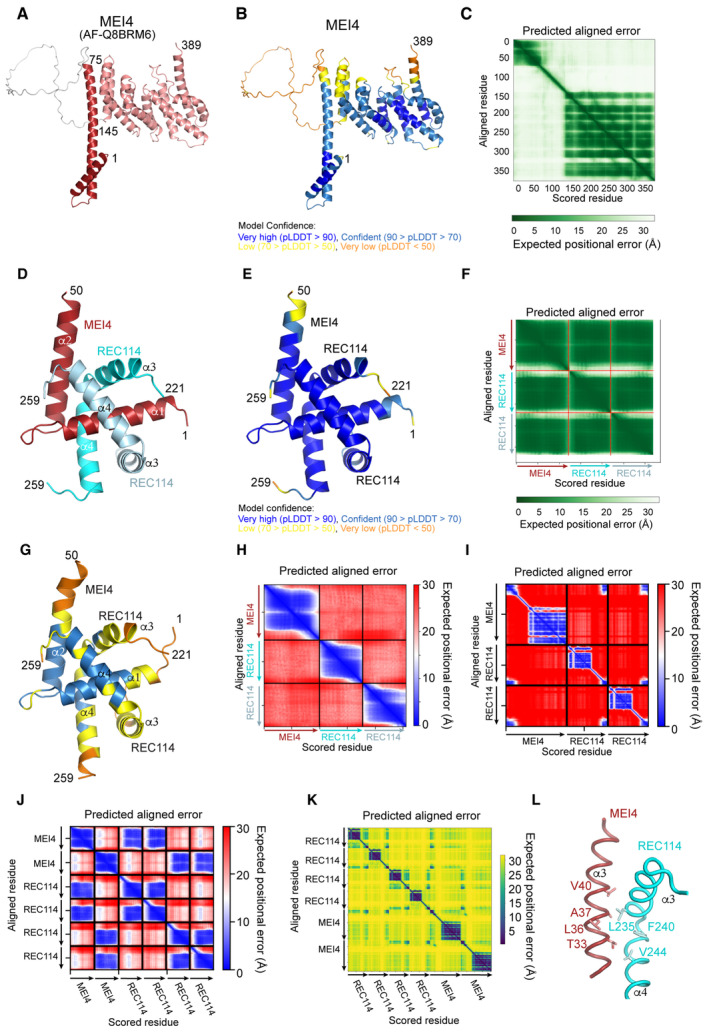
Figure 3 REC114‐MEI4 complex structure prediction A, B AlphaFold2 model of the REC114‐MEI4 complex structure in 2:1 stoichiometry, including the REC114 C terminus (residues 221–259) and the MEI4 N terminus (residues 1–50). The secondary structures are labeled. The modeled complex structure colored according to the AlphaFold2 per‐residue estimate of confidence (pLDDT), and the predicted aligned error plots are shown in Fig EV2D–F.C Details of the predicted interactions between REC114 and MEI4. A sequence of hydrophobic residues of the MEI4 helix α1 is interacting with hydrophobic surfaces of the two molecules of REC114 wrapping around it.D Sequence alignments of the interacting regions of REC114 and MEI4. Identical residues are in brown boxes. The residues involved in the interaction are shown as blue squares.E Pull‐down experiments of full‐length Strep‐tagged REC114 mutants indicated above the lanes with His‐MBP‐MEI41–43. All proteins were first purified by affinity chromatography and gel filtration. A total of 0.9% of the input (lanes 1–6) and 1% of the eluates (lanes 7–12) were analyzed on 15% SDS–PAGE gels stained with Coomassie brilliant blue. Control lanes 1–2 and 7–8 show inputs and elutions of REC114 and MEI4 alone, respectively. The MEI4 sample contains also free MBP tag. The REC114 sample also contains a degradation product, likely corresponding to its PH domain.F Pull‐down experiments of Strep‐tagged REC114 with His‐MBP‐MEI41–43 mutants indicated above the lanes. All proteins were first purified by affinity chromatography and gel filtration. A total of 0.9% of the input (lanes 1–4) and 1% of the eluates (lanes 5–8) were analyzed on 15% SDS–PAGE gels stained with Coomassie brilliant blue. The MEI4 sample contains also free MBP tag. The REC114 sample also contains a degradation product, likely corresponding to its PH domain. Source data are available online for this figure.
Figure 3 REC114‐MEI4 complex structure prediction A, B AlphaFold2 model of the REC114‐MEI4 complex structure in 2:1 stoichiometry, including the REC114 C terminus (residues 221–259) and the MEI4 N terminus (residues 1–50). The secondary structures are labeled. The modeled complex structure colored according to the AlphaFold2 per‐residue estimate of confidence (pLDDT), and the predicted aligned error plots are shown in Fig EV2D–F.C Details of the predicted interactions between REC114 and MEI4. A sequence of hydrophobic residues of the MEI4 helix α1 is interacting with hydrophobic surfaces of the two molecules of REC114 wrapping around it.D Sequence alignments of the interacting regions of REC114 and MEI4. Identical residues are in brown boxes. The residues involved in the interaction are shown as blue squares.E Pull‐down experiments of full‐length Strep‐tagged REC114 mutants indicated above the lanes with His‐MBP‐MEI41–43. All proteins were first purified by affinity chromatography and gel filtration. A total of 0.9% of the input (lanes 1–6) and 1% of the eluates (lanes 7–12) were analyzed on 15% SDS–PAGE gels stained with Coomassie brilliant blue. Control lanes 1–2 and 7–8 show inputs and elutions of REC114 and MEI4 alone, respectively. The MEI4 sample contains also free MBP tag. The REC114 sample also contains a degradation product, likely corresponding to its PH domain.F Pull‐down experiments of Strep‐tagged REC114 with His‐MBP‐MEI41–43 mutants indicated above the lanes. All proteins were first purified by affinity chromatography and gel filtration. A total of 0.9% of the input (lanes 1–4) and 1% of the eluates (lanes 5–8) were analyzed on 15% SDS–PAGE gels stained with Coomassie brilliant blue. The MEI4 sample contains also free MBP tag. The REC114 sample also contains a degradation product, likely corresponding to its PH domain. Source data are available online for this figure.CC BY-NC-ND · PubMed Central
Figure EV2 REC114‐MEI4 complex structure prediction AlphaFold2 model of MEI4 (AF‐Q8BRM6) colored by domain.AlphaFold2 model of REC114 (AF‐Q8BRM6) colored according to the AlphaFold2 per‐residue estimate of confidence (pLDDT).Predicted aligned error plot for the model shown in (A).AlphaFold2 model of the heterotrimeric complex between REC114221–259 and MEI41–50 colored by protein chain.AlphaFold2 model of the heterotrimeric complex between REC114221–259 and MEI41–50 colored according to pLDDT.Predicted aligned error plot for the model shown in (D).ESMfold model of the heterotrimeric complex between REC114221–259 and MEI41–50 colored according to pLDDT.Predicted aligned error plot for the model shown in (G).Predicted aligned error plot for AlphaFold2 modeling the 2:1 complex of full‐length REC114‐MEI4. Only contacts between N‐term. of MEI4 and C‐term. of REC114 are predicted as reliable.Predicted aligned error plot for AlphaFold2 modeling the 4:2 complex of REC114211–259‐MEI41–50. Only 2:1 REC114‐MEI4 reliable contacts are predicted.Predicted aligned error plot for AlphaFold2 modeling the 4:2 complex of FL REC114 and MEI4. The little dark blue squares indicate interactions of the short regions of REC114 and MEI4.Details of the predicted interaction between one of the REC114 molecules with the helix α2 of MEI4.
Figure EV2 REC114‐MEI4 complex structure prediction AlphaFold2 model of MEI4 (AF‐Q8BRM6) colored by domain.AlphaFold2 model of REC114 (AF‐Q8BRM6) colored according to the AlphaFold2 per‐residue estimate of confidence (pLDDT).Predicted aligned error plot for the model shown in (A).AlphaFold2 model of the heterotrimeric complex between REC114221–259 and MEI41–50 colored by protein chain.AlphaFold2 model of the heterotrimeric complex between REC114221–259 and MEI41–50 colored according to pLDDT.Predicted aligned error plot for the model shown in (D).ESMfold model of the heterotrimeric complex between REC114221–259 and MEI41–50 colored according to pLDDT.Predicted aligned error plot for the model shown in (G).Predicted aligned error plot for AlphaFold2 modeling the 2:1 complex of full‐length REC114‐MEI4. Only contacts between N‐term. of MEI4 and C‐term. of REC114 are predicted as reliable.Predicted aligned error plot for AlphaFold2 modeling the 4:2 complex of REC114211–259‐MEI41–50. Only 2:1 REC114‐MEI4 reliable contacts are predicted.Predicted aligned error plot for AlphaFold2 modeling the 4:2 complex of FL REC114 and MEI4. The little dark blue squares indicate interactions of the short regions of REC114 and MEI4.Details of the predicted interaction between one of the REC114 molecules with the helix α2 of MEI4.CC BY-NC-ND · PubMed Central
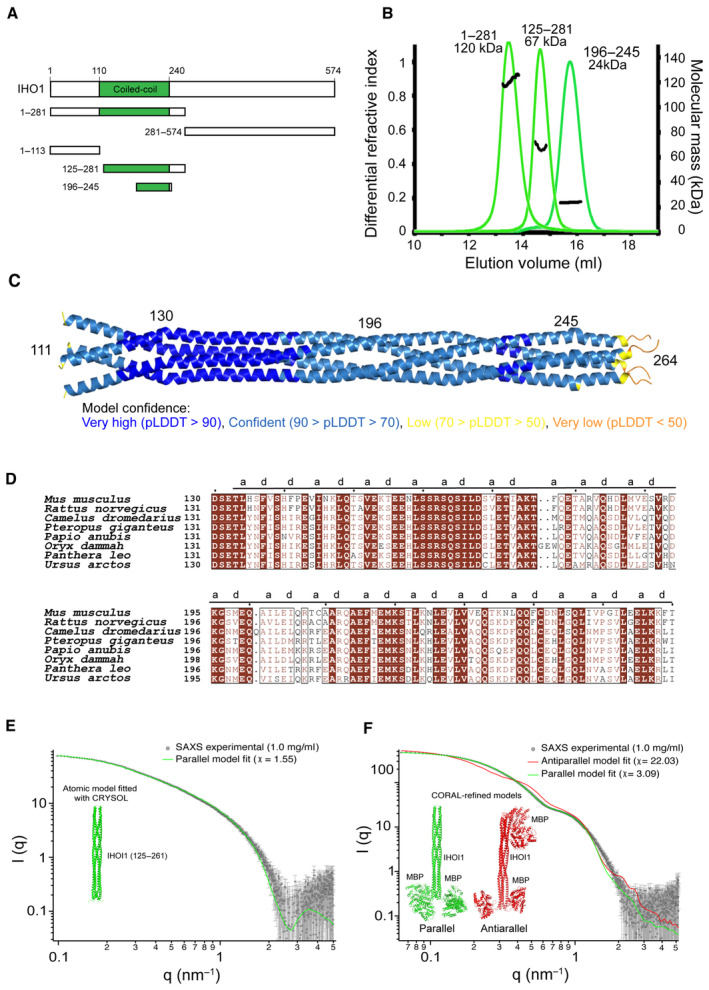
Figure 4 IHO1 forms tetramers Schematic representation of the domain structure of mouse IHO1 and its constructs used in this study.Molecular mass determination of IHO11–281, IHO1125–281, and IHO1196–245 by MALLS using Superose 6 column. The measured molecular mass of the main peak of each construct is 120, 67, and 24 kDa, respectively. These values correspond to calculated molecular weights of IHO1 tetramers (125, 72, and 24 kDa, respectively). The samples were injected at 5–10 mg/ml.AlphaFold2 model of tetrameric IHO1111–280 colored according to the AlphaFold2 per‐residue estimate of confidence (pLDDT). Only residues 111–264 are shown. The predicted aligned error plot for this model is shown in Fig EV3C.Sequence alignments of the helical region of IHO1 (residues 130–260). Identical residues are in brown boxes. (A) and (D) positions of the heptad repeats are shown.Comparison of experimental SAXS curve of IHO1125–261 construct at 1.0 mg/ml and the CRYSOL fit of the parallel atomic model (green line).Comparison of CORAL fits of a parallel (green line) and antiparallel (red line) MBP‐IHO1 models against experimental SAXS data (1 mg/ml). The comparison and χ‐values show that the parallel model is in very good agreement with the data, while the antiparallel model cannot fit them within the conformational space allowed by the linkers. A slight mismatch of the predicted curve of the parallel model with the experimental data in the q‐range between 1 and 2 nm−1 can most likely be attributed to the fact that a single model was fitted, while the flexible linker allows for multiple conformations. Source data are available online for this figure.
Figure 4 IHO1 forms tetramers Schematic representation of the domain structure of mouse IHO1 and its constructs used in this study.Molecular mass determination of IHO11–281, IHO1125–281, and IHO1196–245 by MALLS using Superose 6 column. The measured molecular mass of the main peak of each construct is 120, 67, and 24 kDa, respectively. These values correspond to calculated molecular weights of IHO1 tetramers (125, 72, and 24 kDa, respectively). The samples were injected at 5–10 mg/ml.AlphaFold2 model of tetrameric IHO1111–280 colored according to the AlphaFold2 per‐residue estimate of confidence (pLDDT). Only residues 111–264 are shown. The predicted aligned error plot for this model is shown in Fig EV3C.Sequence alignments of the helical region of IHO1 (residues 130–260). Identical residues are in brown boxes. (A) and (D) positions of the heptad repeats are shown.Comparison of experimental SAXS curve of IHO1125–261 construct at 1.0 mg/ml and the CRYSOL fit of the parallel atomic model (green line).Comparison of CORAL fits of a parallel (green line) and antiparallel (red line) MBP‐IHO1 models against experimental SAXS data (1 mg/ml). The comparison and χ‐values show that the parallel model is in very good agreement with the data, while the antiparallel model cannot fit them within the conformational space allowed by the linkers. A slight mismatch of the predicted curve of the parallel model with the experimental data in the q‐range between 1 and 2 nm−1 can most likely be attributed to the fact that a single model was fitted, while the flexible linker allows for multiple conformations. Source data are available online for this figure.CC BY-NC-ND · PubMed Central
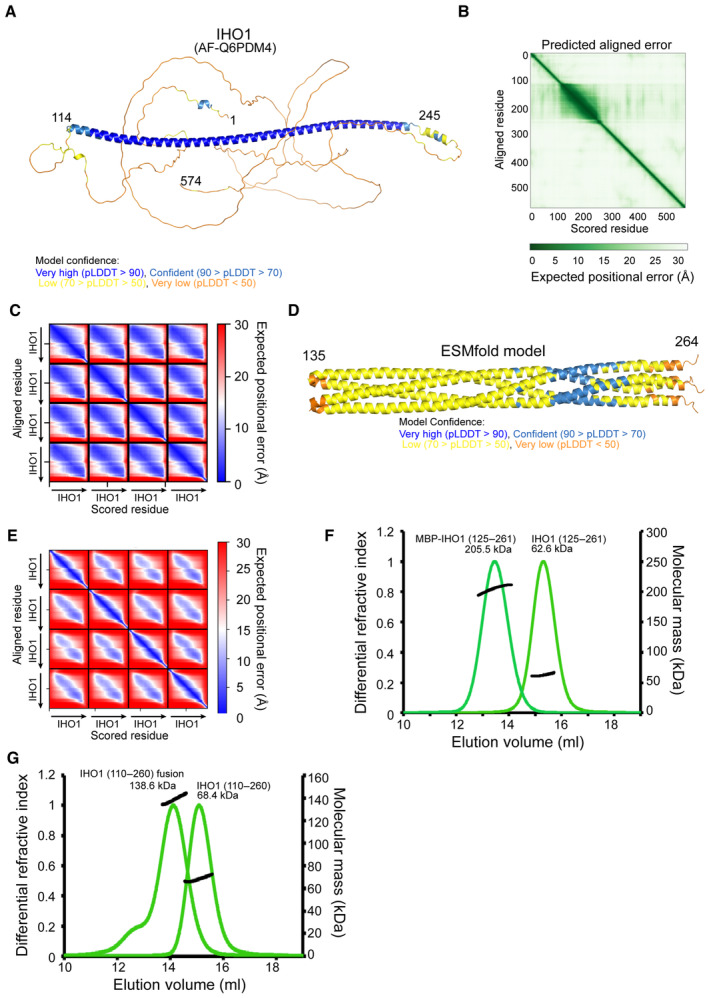
Figure EV3 Structure prediction of the IHO1 coiled‐coil AlphaFold2 model of IHO1 (AF‐Q6PDM4) colored according to the AlphaFold2 per‐residue estimate of confidence (pLDDT).Predicted aligned error plot for the model shown in (A).Predicted aligned error plot for the AlphaFold2 model shown in Fig 4C.ESMfold model of the tetrameric IHO1110–281 colored according to pLDDT. Only residues 135–264 are shown.The predicted aligned error plot for the ESMfold model is shown in (D).Molecular mass determination of IHO1125–261 and MBP‐IHO1125–261 by MALLS using Superose 6 column. The measured molecular mass of the main peak of the two constructs is 62.6 Da and 205.5 kDa, respectively. These values correspond to calculated molecular weights of IHO1 tetramers (63.2 and 224.4 kDa, respectively). The samples were injected at 4 mg/ml.Molecular mass determination of IHO1110–260 and the fusion construct containing two copies of IHO1110–260 separated by a 16 residues linker by MALLS using Superose 6 column. The measured molecular mass of the main peak of the two constructs is 68.4 Da and 138.6 kDa, respectively. These values correspond to calculated molecular weights of IHO1 tetramers (69.6 and 143.2 kDa, respectively). The samples were injected at 4 mg/ml.
Figure EV3 Structure prediction of the IHO1 coiled‐coil AlphaFold2 model of IHO1 (AF‐Q6PDM4) colored according to the AlphaFold2 per‐residue estimate of confidence (pLDDT).Predicted aligned error plot for the model shown in (A).Predicted aligned error plot for the AlphaFold2 model shown in Fig 4C.ESMfold model of the tetrameric IHO1110–281 colored according to pLDDT. Only residues 135–264 are shown.The predicted aligned error plot for the ESMfold model is shown in (D).Molecular mass determination of IHO1125–261 and MBP‐IHO1125–261 by MALLS using Superose 6 column. The measured molecular mass of the main peak of the two constructs is 62.6 Da and 205.5 kDa, respectively. These values correspond to calculated molecular weights of IHO1 tetramers (63.2 and 224.4 kDa, respectively). The samples were injected at 4 mg/ml.Molecular mass determination of IHO1110–260 and the fusion construct containing two copies of IHO1110–260 separated by a 16 residues linker by MALLS using Superose 6 column. The measured molecular mass of the main peak of the two constructs is 68.4 Da and 138.6 kDa, respectively. These values correspond to calculated molecular weights of IHO1 tetramers (69.6 and 143.2 kDa, respectively). The samples were injected at 4 mg/ml.CC BY-NC-ND · PubMed Central
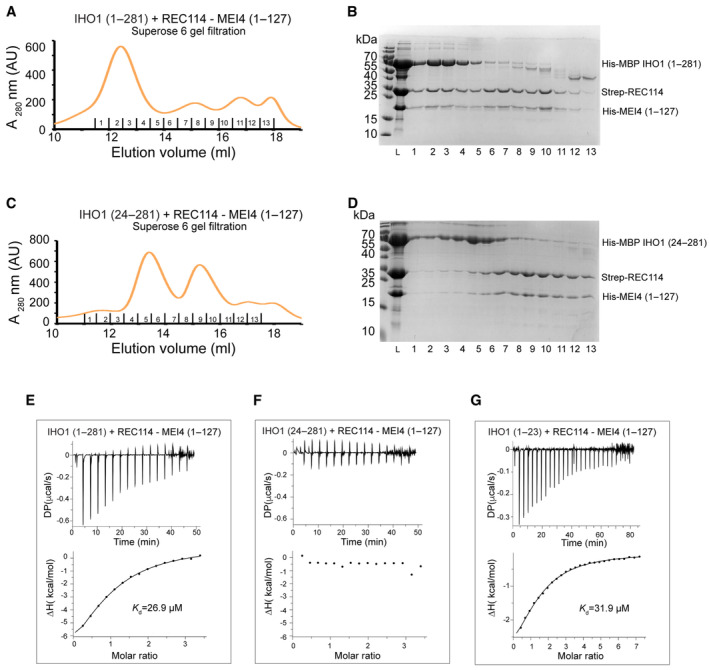
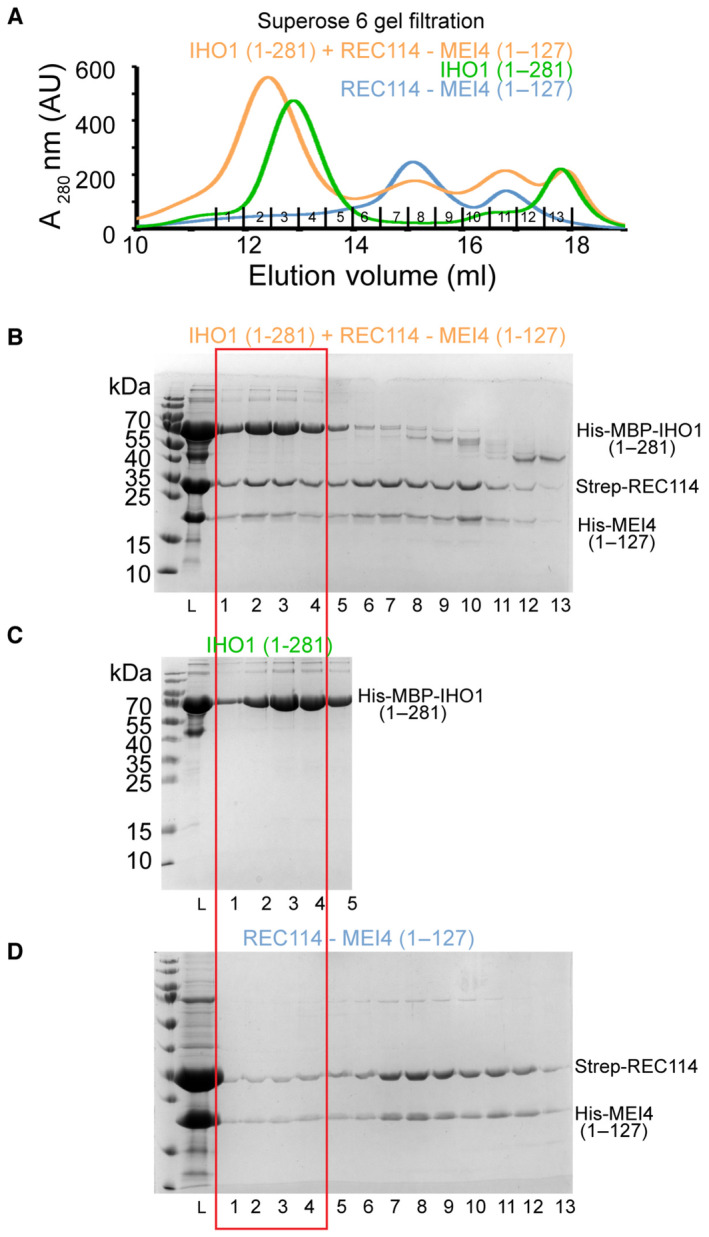
Figure 5 IHO1 forms a complex with REC114‐MEI4 Superose 6 gel filtration elution profile of His‐MBP‐IHO11–281 mixed with Strep‐REC114‐His‐MEI41–127. Overlay with individual elution profiles of His‐MBP‐IHO11–281 and the Strep‐REC114‐His‐MEI41–127 complex and the corresponding SDS–PAGE analysis of the elution fractions are shown in Fig EV4.SDS–PAGE analysis of fraction 1–13 of the Superose 6 gel filtration elution profile shown in (A). L indicates input sample loaded onto the column.Superose 6 gel filtration elution profile of His‐MBP‐IHO124–281 mixed with Strep‐REC114‐His‐MEI41–127, showing a lack of binding. Overlay with individual elution profiles of His‐MBP‐IHO124–281 and the Strep‐REC114‐His‐MEI41–127 complex and the corresponding SDS–PAGE analysis of the elution fractions are shown in Appendix Fig S7.SDS–PAGE analysis of fraction 1–13 of the Superose 6 gel filtration elution profile shown in (C). L indicates input sample loaded onto the column.ITC measurement of the interaction affinity between His‐MBP‐IHO11–281 and Strep‐REC114‐His‐MEI41–127.ITC measurement of the interaction affinity between His‐MBP‐IHO124–281 and Strep‐REC114‐His‐MEI41–127 ITC measurement of the interaction affinity between His‐MBP‐IHO11–23 and Strep‐REC114‐His‐MEI41–127. Source data are available online for this figure.
Figure 5 IHO1 forms a complex with REC114‐MEI4 Superose 6 gel filtration elution profile of His‐MBP‐IHO11–281 mixed with Strep‐REC114‐His‐MEI41–127. Overlay with individual elution profiles of His‐MBP‐IHO11–281 and the Strep‐REC114‐His‐MEI41–127 complex and the corresponding SDS–PAGE analysis of the elution fractions are shown in Fig EV4.SDS–PAGE analysis of fraction 1–13 of the Superose 6 gel filtration elution profile shown in (A). L indicates input sample loaded onto the column.Superose 6 gel filtration elution profile of His‐MBP‐IHO124–281 mixed with Strep‐REC114‐His‐MEI41–127, showing a lack of binding. Overlay with individual elution profiles of His‐MBP‐IHO124–281 and the Strep‐REC114‐His‐MEI41–127 complex and the corresponding SDS–PAGE analysis of the elution fractions are shown in Appendix Fig S7.SDS–PAGE analysis of fraction 1–13 of the Superose 6 gel filtration elution profile shown in (C). L indicates input sample loaded onto the column.ITC measurement of the interaction affinity between His‐MBP‐IHO11–281 and Strep‐REC114‐His‐MEI41–127.ITC measurement of the interaction affinity between His‐MBP‐IHO124–281 and Strep‐REC114‐His‐MEI41–127 ITC measurement of the interaction affinity between His‐MBP‐IHO11–23 and Strep‐REC114‐His‐MEI41–127. Source data are available online for this figure.CC BY-NC-ND · PubMed Central
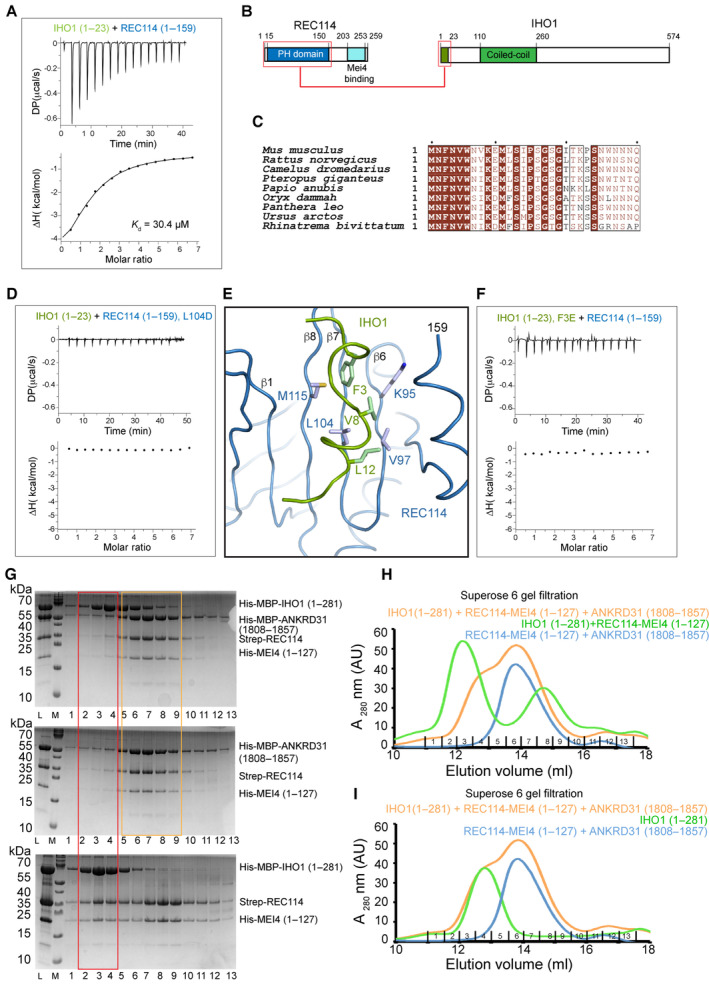
Figure 6 IHO1 interacts with the PH domain of REC114 ITC measurement of the interaction affinity between His‐MBP‐IHO11–23 and Strep‐REC1141–159 (PH domain).Schematic representation of the interacting regions of REC114 and IHO1 highlighted with red boxes.Sequence alignments of the N‐terminal sequence of IHO1. Identical residues are in brown boxes. Only first 30 residues are shown.ITC measurement of the interaction affinity between His‐MBP‐IHO11–23 and the L104D mutant of Strep‐REC1141–159.AlphaFold2 model of the complex between the REC114 PH domain (blue) and the N‐terminal peptide of IHO1 (residues 1–15, green). Hydrophobic IHO1 residues are predicted to interact with the REC114 β‐sheet formed of strands β1 and β6–β8. The secondary structures are labeled. The modeled complex structure colored according to the AlphaFold2 per‐residue estimate of confidence (pLDDT), and predicted aligned error plot is shown in Fig EV5A and B.ITC measurement of the interaction affinity between the F3E mutant of His‐MBP‐IHO11–23 and Strep‐REC1141–159.SDS–PAGE analysis of fractions 1–13 of Superose 6 gel filtration elution profiles of His‐MBP‐IHO11–281 mixed with His‐MBP‐ANKRD311808–1857, Strep‐REC114, and His‐MEI41–127 (upper panel); mixture of His‐MBP‐ANKRD311808–1857 with Strep‐REC114‐His‐MEI41–127 (middle panel) and His‐MBP‐IHO11–281 mixed with Strep‐REC114 and His‐MEI41–127 (lower panel). L indicates input sample loaded onto the column. The red frame highlights the complex of IHO1 bound to REC114 and MEI4 (lower panel) and the lack of this complex in the presence of ANKRD31 (upper panel). Orange square shows equivalent elution of ANKRD31, REC114, and MEI4 in the presence or absence of IHO1.Superose 6 gel filtration elution profiles of His‐MBP‐IHO11–281 mixed with His‐MBP‐ANKRD311808–1857, Strep‐REC114, and His‐MEI41–127 (orange); His‐MBP‐ANKRD311808–1857, Strep‐REC114 and His‐MEI41–127 (blue) and His‐MBP‐IHO11–281 mixed with Strep‐REC114‐His‐MEI41–127 (green). Corresponding SDS–PAGE gel analysis is shown in (G).Superose 6 gel filtration elution profiles of His‐MBP‐IHO11–281 mixed with His‐MBP‐ANKRD311808–1857, Strep‐REC114, and His‐MEI41–127 (orange); His‐MBP‐ANKRD311808–1857, Strep‐REC114 and His‐MEI41–127 (blue) and His‐MBP‐IHO11–281 (green). Corresponding SDS–PAGE gel analysis is shown in Appendix Fig S8. Source data are available online for this figure.
Figure 6 IHO1 interacts with the PH domain of REC114 ITC measurement of the interaction affinity between His‐MBP‐IHO11–23 and Strep‐REC1141–159 (PH domain).Schematic representation of the interacting regions of REC114 and IHO1 highlighted with red boxes.Sequence alignments of the N‐terminal sequence of IHO1. Identical residues are in brown boxes. Only first 30 residues are shown.ITC measurement of the interaction affinity between His‐MBP‐IHO11–23 and the L104D mutant of Strep‐REC1141–159.AlphaFold2 model of the complex between the REC114 PH domain (blue) and the N‐terminal peptide of IHO1 (residues 1–15, green). Hydrophobic IHO1 residues are predicted to interact with the REC114 β‐sheet formed of strands β1 and β6–β8. The secondary structures are labeled. The modeled complex structure colored according to the AlphaFold2 per‐residue estimate of confidence (pLDDT), and predicted aligned error plot is shown in Fig EV5A and B.ITC measurement of the interaction affinity between the F3E mutant of His‐MBP‐IHO11–23 and Strep‐REC1141–159.SDS–PAGE analysis of fractions 1–13 of Superose 6 gel filtration elution profiles of His‐MBP‐IHO11–281 mixed with His‐MBP‐ANKRD311808–1857, Strep‐REC114, and His‐MEI41–127 (upper panel); mixture of His‐MBP‐ANKRD311808–1857 with Strep‐REC114‐His‐MEI41–127 (middle panel) and His‐MBP‐IHO11–281 mixed with Strep‐REC114 and His‐MEI41–127 (lower panel). L indicates input sample loaded onto the column. The red frame highlights the complex of IHO1 bound to REC114 and MEI4 (lower panel) and the lack of this complex in the presence of ANKRD31 (upper panel). Orange square shows equivalent elution of ANKRD31, REC114, and MEI4 in the presence or absence of IHO1.Superose 6 gel filtration elution profiles of His‐MBP‐IHO11–281 mixed with His‐MBP‐ANKRD311808–1857, Strep‐REC114, and His‐MEI41–127 (orange); His‐MBP‐ANKRD311808–1857, Strep‐REC114 and His‐MEI41–127 (blue) and His‐MBP‐IHO11–281 mixed with Strep‐REC114‐His‐MEI41–127 (green). Corresponding SDS–PAGE gel analysis is shown in (G).Superose 6 gel filtration elution profiles of His‐MBP‐IHO11–281 mixed with His‐MBP‐ANKRD311808–1857, Strep‐REC114, and His‐MEI41–127 (orange); His‐MBP‐ANKRD311808–1857, Strep‐REC114 and His‐MEI41–127 (blue) and His‐MBP‐IHO11–281 (green). Corresponding SDS–PAGE gel analysis is shown in Appendix Fig S8. Source data are available online for this figure.CC BY-NC-ND · PubMed Central
Figure EV4 IHO1‐REC114‐MEI4 complex formation A Overlay of Superose 6 gel filtration elution profiles of His‐MBP‐IHO11–281, the Strep‐REC114‐His‐MEI41–127 complex and their mixture.B–D SDS–PAGE analysis of fraction 1–13 of the Superose 6 gel filtration elution profile shown in (A). Only fractions 1–5 are shown for the His‐MBP‐IHO11–281 profile. L indicates input sample loaded onto the column. The gel shown in (B) is the same as in Fig 5B.
Figure EV4 IHO1‐REC114‐MEI4 complex formation A Overlay of Superose 6 gel filtration elution profiles of His‐MBP‐IHO11–281, the Strep‐REC114‐His‐MEI41–127 complex and their mixture.B–D SDS–PAGE analysis of fraction 1–13 of the Superose 6 gel filtration elution profile shown in (A). Only fractions 1–5 are shown for the His‐MBP‐IHO11–281 profile. L indicates input sample loaded onto the column. The gel shown in (B) is the same as in Fig 5B.CC BY-NC-ND · PubMed Central
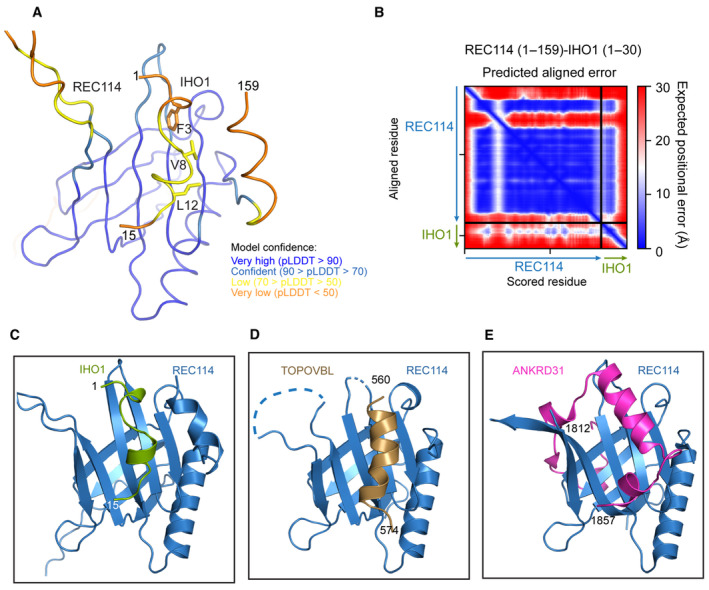
Figure EV5 IHO1‐REC114 interface A AlphaFold2 model of the complex between REC1141–159 and IHO11–30 colored according to the AlphaFold2 per‐residue estimate of confidence (pLDDT). Only IHO1 residues 1–15 are shown.B Predicted aligned error plot for the model shown in (A).C–E Comparison of the AlphaFold2 model of the complex between the PH domain of REC114 and IHO11–15 with crystal structure of the REC114 PH domain bound to a peptide of TOPOVIBL (PDB code: 7QWV) and ANKRD31 (PDB code: 6NXF).
Figure EV5 IHO1‐REC114 interface A AlphaFold2 model of the complex between REC1141–159 and IHO11–30 colored according to the AlphaFold2 per‐residue estimate of confidence (pLDDT). Only IHO1 residues 1–15 are shown.B Predicted aligned error plot for the model shown in (A).C–E Comparison of the AlphaFold2 model of the complex between the PH domain of REC114 and IHO11–15 with crystal structure of the REC114 PH domain bound to a peptide of TOPOVIBL (PDB code: 7QWV) and ANKRD31 (PDB code: 6NXF).CC BY-NC-ND · PubMed Central
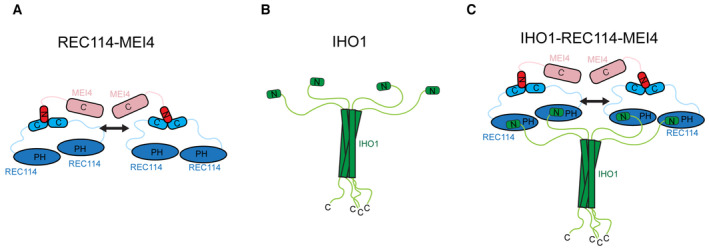
Figure 7 Model of the IHO1‐REC114‐MEI4 complex Model summarizing the current knowledge on the REC114‐MEI4 complex architecture. REC114‐MEI4 form 2:1 and 4:2 complexes through the C termini of REC114 and N terminus of MEI4. The arrow indicates potential dimerization of the REC114‐MEI4 heterotrimers.Model summarizing the current knowledge on IHO1 domain architecture. IHO1 forms tetramers and interacts with REC114 with its conserved N terminus.Proposed model of the 4:4:2 IHO1‐REC114‐MEI4 complex. The tetramer of IHO1 interacts with four molecules of REC114 binding two molecules of MEI4. The arrow indicates potential dimerization of the REC114‐MEI4 heterotrimers.
Figure 7 Model of the IHO1‐REC114‐MEI4 complex Model summarizing the current knowledge on the REC114‐MEI4 complex architecture. REC114‐MEI4 form 2:1 and 4:2 complexes through the C termini of REC114 and N terminus of MEI4. The arrow indicates potential dimerization of the REC114‐MEI4 heterotrimers.Model summarizing the current knowledge on IHO1 domain architecture. IHO1 forms tetramers and interacts with REC114 with its conserved N terminus.Proposed model of the 4:4:2 IHO1‐REC114‐MEI4 complex. The tetramer of IHO1 interacts with four molecules of REC114 binding two molecules of MEI4. The arrow indicates potential dimerization of the REC114‐MEI4 heterotrimers.CC BY-NC-ND · PubMed Central

Verification

Claims the paper makes

The claims and statistics of this paper haven’t been checked yet.

Run the check — free, no account needed. It reads the open-access text and checks the sources it cites.

A few free checks a day · papers already verified open instantly · results are public

Self-check

Percentages, sums and reported differences re-computed from the paper’s own numbers.

The self-check needs the paper’s full text.

Citations

Cites

Research works printed but not linked: 50

  1. Acquaviva L, Székvölgyi L, Dichtl B, Dichtl BS, Saint André CDLR, Nicolas A, Géli V (2013) The COMPASS subunit Spp1 links histone methylation to initiation of meiotic recombination. Science 339: 215–218 · DOI
  2. Acquaviva L, Boekhout M, Karasu ME, Brick K, Pratto F, Li T, van Overbeek M, Kauppi L, Camerini‐Otero RD, Jasin M et al (2020) Ensuring meiotic DNA break formation in the mouse pseudoautosomal region. Nature 582: 426–431 · DOI
  3. Arora C, Kee K, Maleki S, Keeney S (2004) Antiviral protein Ski8 is a direct partner of Spo11 in meiotic DNA break formation, independent of its cytoplasmic role in RNA metabolism. Mol Cell 13: 549–559 · DOI · Paper page
  4. Ayoub N, Roth P, Ucurum Z, Fotiadis D, Hirschi S (2023) Structural and biochemical insights into his‐tag‐induced higher‐order oligomerization of membrane proteins by cryo‐EM and size exclusion chromatography. J Struct Biol 215: 107924 · DOI
  5. Baudat F, Manova K, Yuen JP, Jasin M, Keeney S (2000) Chromosome synapsis defects and sexually dimorphic meiotic progression in mice lacking Spo11. Mol Cell 6: 989–998 · DOI
  6. Baudat F, Imai Y, De Massy B (2013) Meiotic recombination in mammals: localization and regulation. Nat Rev Genet 14: 794–806 · DOI
  7. Boekhout M, Karasu ME, Wang J, Acquaviva L, Pratto F, Brick K, Eng DY, Xu J, Camerini‐Otero RD, Patel DJ et al (2019) REC114 partner ANKRD31 controls number, timing, and location of meiotic DNA breaks. Mol Cell 74: 1053–1068 · DOI
  8. Boeri Erba E, Signor L, Oliva MF, Hans F, Petosa C (2018) Characterizing intact macromolecular complexes using native mass spectrometry. Methods Mol Biol 1764: 133–151 · DOI
  9. Boeri Erba E, Signor L, Petosa C (2020) Exploring the structure and dynamics of macromolecular complexes by native mass spectrometry. J Proteomics 222: 103799 · DOI
  10. Brautigam CA (2015) Calculations and publication‐quality illustrations for analytical ultracentrifugation data. Methods Enzymol 562: 109–133 · DOI
  11. Brinkmeier J, Coelho S, de Massy B, Bourbon H‐M (2022) Evolution and diversity of the TopoVI and TopoVI‐like subunits with extensive divergence of the TOPOVIBL subunit. Mol Biol Evol 39: msac227 · DOI
  12. Claeys Bouuaert C, Pu S, Wang J, Oger C, Daccache D, Xie W, Patel DJ, Keeney S (2021a) DNA‐driven condensation assembles the meiotic DNA break machinery. Nature 592: 144–149 · DOI
  13. Claeys Bouuaert C, Tischfield SE, Pu S, Mimitou EP, Arias‐Palomo E, Berger JM, Keeney S (2021b) Structural and functional characterization of the Spo11 core complex. Nat Struct Mol Biol 28: 92–102 · DOI · Paper page
  14. Cole F, Kauppi L, Lange J, Roig I, Wang R, Keeney S, Jasin M (2012) Homeostatic control of recombination is implemented progressively in mouse meiosis. Nat Cell Biol 14: 424–430 · DOI
  15. Corbett KD, Benedetti P, Berger JM (2007) Holoenzyme assembly and ATP‐mediated conformational dynamics of topoisomerase VI. Nat Struct Mol Biol 14: 611–619 · DOI
  16. Dereli I, Stanzione M, Olmeda F, Papanikos F, Baumann M, Demir S, Carofiglio F, Lange J, De Massy B, Baarends WM et al (2021) Four‐pronged negative feedback of DSB machinery in meiotic DNA‐break control in mice. Nucleic Acids Res 49: 2609–2628 · DOI
  17. Emsley P, Lohkamp B, Scott WG, Cowtan K (2010) Features and development of coot. Acta Crystallogr D Biol Crystallogr 66: 486–501 · DOI · Paper page
  18. Graille M, Cladière L, Durand D, Lecointe F, Gadelle D, Quevillon‐Cheruel S, Vachette P, Forterre P, van Tilbeurgh H (2008) Crystal structure of an intact type II DNA topoisomerase: insights into DNA transfer mechanisms. Structure 16: 360–370 · DOI
  19. Grey C, Baudat F, de Massy B (2018) Prdm9, a driver of the genetic map. PLoS Genet 14: e1007479 · DOI
  20. Henderson KA, Kee K, Maleki S, Santini PA, Keeney S (2006) Cyclin‐dependent kinase directly regulates initiation of meiotic recombination. Cell 125: 1321–1332 · DOI
  21. van den Heuvel RH, van Duijn E, Mazon H, Synowsky SA, Lorenzen K, Versluis C, Brouns SJ, Langridge D, van der Oost J, Hoyes J et al. (2006) Improving the performance of a quadrupole time-of-flight instrument for macromolecular mass spectrometry. Anal Chem 78: 7473–7483 · DOI
  22. Hunter N (2015) Meiotic recombination: the essence of heredity. Cold Spring Harb Perspect Biol 7: a016618
  23. Jiao K, Salem L, Malone R (2003) Support for a meiotic recombination initiation complex: interactions among Rec102p, Rec104p, and Spo11p. Mol Cell Biol 23: 5928–5938 · DOI
  24. Kieffer J, Brennich M, Florial J‐B, Oscarsson M, Antolinos ADM, Tully M, Pernot P (2022) New data analysis for BioSAXS at the ESRF. J Synchrotron Rad 29: 1318–1328 · DOI
  25. Kumar R, Bourbon HM, De Massy B (2010) Functional conservation of Mei4 for meiotic DNA double‐strand break formation from yeasts to mice. Genes Dev 24: 1266–1280 · DOI
  26. Kumar R, Ghyselinck N, Ishiguro K, Watanabe Y, Kouznetsova A, Höög C, Strong E, Schimenti J, Daniel K, Toth A et al (2015) MEI4 ‐ a central player in the regulation of meiotic DNA double‐strand break formation in the mouse. J Cell Sci 128: 1800–1811
  27. Kumar R, Oliver C, Brun C, Juarez‐Martinez AB, Tarabay Y, Kadlec J, De Massy B (2018) Mouse REC114 is essential for meiotic DNA double‐strand break formation and forms a complex with MEI4. Life Sci Alliance 1: e201800259 · DOI
  28. Lam I, Keeney S (2015) Mechanism and regulation of meiotic recombination initiation. Cold Spring Harb Perspect Biol 7: a016634
  29. Maleki S, Neale MJ, Arora C, Henderson KA, Keeney S (2007) Interactions between Mei4, Rec114, and other proteins required for meiotic DNA double‐strand break formation in Saccharomyces cerevisiae. Chromosoma 116: 471–486 · DOI
  30. Manalastas‐Cantos K, Konarev PV, Hajizadeh NR, Kikhney AG, Petoukhov MV, Molodenskiy DS, Panjkovich A, Mertens HDT, Gruzinov A, Borges C et al (2021) ATSAS 3.0: expanded functionality and new tools for small‐angle scattering data analysis. J Appl Cryst 54: 343–355 · DOI
  31. de Massy B (2013) Initiation of meiotic recombination: how and where? Conservation and specificities among eukaryotes. Annu Rev Genet 47: 563–599 · DOI
  32. Morgner N, Robinson CV (2012) Massign: an assignment strategy for maximizing information from the mass spectra of heterogeneous protein assemblies. Anal Chem 84: 2939–2948 · DOI
  33. Nichols MD, DeAngelis K, Keck JL, Berger JM (1999) Structure and function of an archaeal topoisomerase VI subunit with homology to the meiotic recombination factor Spo11. EMBO J 18: 6177–6188 · DOI
  34. Nore A, Juarez‐Martinez AB, Clément J, Brun C, Diagouraga B, Laroussi H, Grey C, Bourbon HM, Kadlec J, Robert T et al (2022) TOPOVIBL‐REC114 interaction regulates meiotic DNA double‐strand breaks. Nat Commun 13: 7048 · DOI · Paper page
  35. Panizza S, Mendoza MA, Berlinger M, Huang L, Nicolas A, Shirahige K, Klein F (2011) Spo11‐accessory proteins link double‐strand break sites to the chromosome axis in early meiotic recombination. Cell 146: 372–383 · DOI
  36. Papanikos F, Clément JAJ, Testa E, Ravindranathan R, Grey C, Dereli I, Bondarieva A, Valerio‐Cabrera S, Stanzione M, Schleiffer A et al (2019) Mouse ANKRD31 regulates spatiotemporal patterning of meiotic recombination initiation and ensures recombination between X and Y sex chromosomes. Mol Cell 74: 1069–1085 · DOI
  37. Puglisi R, Boeri Erba E, Pastore A (2020) A guide to native mass spectrometry to determine complex interactomes of molecular machines. FEBS J 287: 2428–2439 · DOI
  38. Reinholdt LG, Schimenti JC (2005) Mei1 is epistatic to Dmc1 during mouse meiosis. Chromosoma 114: 127–134 · DOI
  39. Romanienko PJ, Camerini‐Otero RD (2000) The mouse Spo11 gene is required for meiotic chromosome synapsis. Mol Cell 6: 975–987 · DOI
  40. Rousova D, Nivsarkar V, Altmannova V, Raina VB, Funk SK, Liedtke D, Janning P, Müller F, Reichle H, Vader G et al (2021) Novel mechanistic insights into the role of Mer2 as the keystone of meiotic DNA break formation. Elife 10: e72330 · DOI
  41. Saredi G, Huang H, Hammond CM, Alabert C, Bekker‐Jensen S, Forne I, Reverón‐Gómez N, Foster BM, Mlejnkova L, Bartke T et al (2016) H4K20me0 marks post‐replicative chromatin and recruits the TONSL‐MMS22L DNA repair complex. Nature 534: 714–718 · DOI
  42. Sasanuma H, Hirota K, Fukuda T, Kakusho N, Kugou K, Kawasaki Y, Shibata T, Masai H, Ohta K (2008) Cdc7‐dependent phosphorylation of Mer2 facilitates initiation of yeast meiotic recombination. Genes Dev 22: 398–410 · DOI
  43. Schuck P (2000) Size‐distribution analysis of macromolecules by sedimentation velocity ultracentrifugation and Lamm equation modeling. Biophys J 78: 1606–1619 · DOI
  44. Sobott F, Hernandez H, McCammon MG, Tito MA, Robinson CV (2002) A tandem mass spectrometer for improved transmission and analysis of large macromolecular assemblies. Anal Chem 74: 1402–1407 · DOI · Paper page
  45. Sommermeyer V, Béneut C, Chaplais E, Serrentino ME, Borde V (2013) Spp1, a member of the Set1 complex, promotes meiotic DSB formation in promoters by tethering histone H3K4 methylation sites to chromosome axes. Mol Cell 49: 43–54 · DOI
  46. Stanzione M, Baumann M, Papanikos F, Dereli I, Lange J, Ramlal A, Tränkner D, Shibuya H, de Massy B, Watanabe Y et al (2016) Meiotic DNA break formation requires the unsynapsed chromosome axis‐binding protein IHO1 (CCDC36) in mice. Nat Cell Biol 18: 1208–1220 · DOI
  47. Tessé S, Bourbon HM, Debuchy R, Budin K, Dubois E, Liangran Z, Antoine R, Piolot T, Kleckner N, Zickler D (2017) Asy2/Mer2: an evolutionarily conserved mediator of meiotic recombination, pairing, and global chromosome compaction. Genes Dev 31: 1880–1893 · DOI
  48. Tock AJ, Henderson IR (2018) Hotspots for initiation of meiotic recombination. Front Genet 9: 521 · DOI
  49. Tully MD, Kieffer J, Brennich ME, Cohen Aberdam R, Florial JB, Hutin S, Oscarsson M, Beteva A, Popov A, Moussaoui D et al (2023) BioSAXS at European Synchrotron Radiation Facility ‐ extremely brilliant source: BM29 with an upgraded source, detector, robot, sample environment, data collection and analysis software. J Synchrotron Radiat 30: 258–266 · DOI
  50. Yadav VK, Claeys Bouuaert C (2021) Mechanism and control of meiotic DNA double‐Strand break formation in S. cerevisiae. Front Cell Dev Biol 9: 642737

Metadata

Authors
Laroussi, H., Juarez‐Martinez, A. B., Le Roy, A., Boeri Erba, E., Gabel, F., de Massy, B., & Kadlec, J.
Affiliations
Centre National de la Recherche Scientifique (FR)
Corresponding author
Kadlec, Jan
Venue
The EMBO Journal
Published
2023-07-11
Volume
42
Issue
16
Pages
e113866-e113866
ISSN
  • 0261-4189 (ISSN-L)
  • 1460-2075
OpenAlex
W4383873224
Cited by
22
References
4
Citations by year
2026: 6 · 2025: 6 · 2024: 6 · 2023: 4
FWCI
1.96
Type
journal article
Language
en
Open access
Locations
  • The EMBO Journal (publishedVersion, cc-by-nc-nd)
  • bioRxiv (Cold Spring Harbor Laboratory) (acceptedVersion, cc-by-nc-nd)
  • PubMed Central (publishedVersion, cc-by-nc-nd)
  • PubMed (publishedVersion)
  • HAL (submittedVersion, other-oa)
Funders
  • Agence Nationale de la Recherche (18‐CE11‐0024‐01, ANR‐10‐LABX‐49‐01, ANR‐10‐INBS‐0005‐02, ANR‐17‐EURE‐0003)
  • Centre National de la Recherche Scientifique (IR‐RMN‐THC Fr3050)
  • EC|European Research Council (883605)
  • European Union (PCOFUND‐GA‐2013‐609102)
Topics
  • Life Sciences › Biochemistry, Genetics and Molecular Biology › Molecular Biology › DNA Repair Mechanisms
  • Life Sciences › Biochemistry, Genetics and Molecular Biology › Molecular Biology › Genomics and Chromatin Dynamics
  • Life Sciences › Biochemistry, Genetics and Molecular Biology › Cell Biology › Microtubule and mitosis dynamics
Keywords
REC114, MEI4, meiotic recombination, Spo11, protein complex formation, protein dimerization, pleckstrin homology domain, protein-protein interaction
MeSH terms
Animals, DNA, Meiosis, Cell Cycle Proteins, Saccharomyces cerevisiae Proteins, Ubiquitin-Protein Ligases, Mice, Homologous Recombination

About these checks

Registry, retraction, Cites and statistics results are computed, not judged, with one exception: a printed reference that no index lists is read once by a model before it counts as a citation error. Claims are extracted by a model and kept only when their quote appears verbatim in the text; each cited source is then checked, with a model’s help, for whether it says what the claim relies on. Those verdicts can be wrong — read the claim’s quote and the cited source before relying on one.

Statistics and arithmetic are recomputed, not judged.

Confidence bands are shown only for fields calibrated on our annotated test set. None is calibrated yet, so no band is shown.

What counts as a claim ›How we measure confidence ›How we check this ›

Are you an author, or do you see a problem with this page? Request a review