

The DOI matches its Crossref record; 33 of the 33 references it cites were found in a registry or an index.
TREM2 shedding by cleavage at the H157‐S158 bond is accelerated for the Alzheimer's disease‐associated H157Y variant
Open accessAbstract
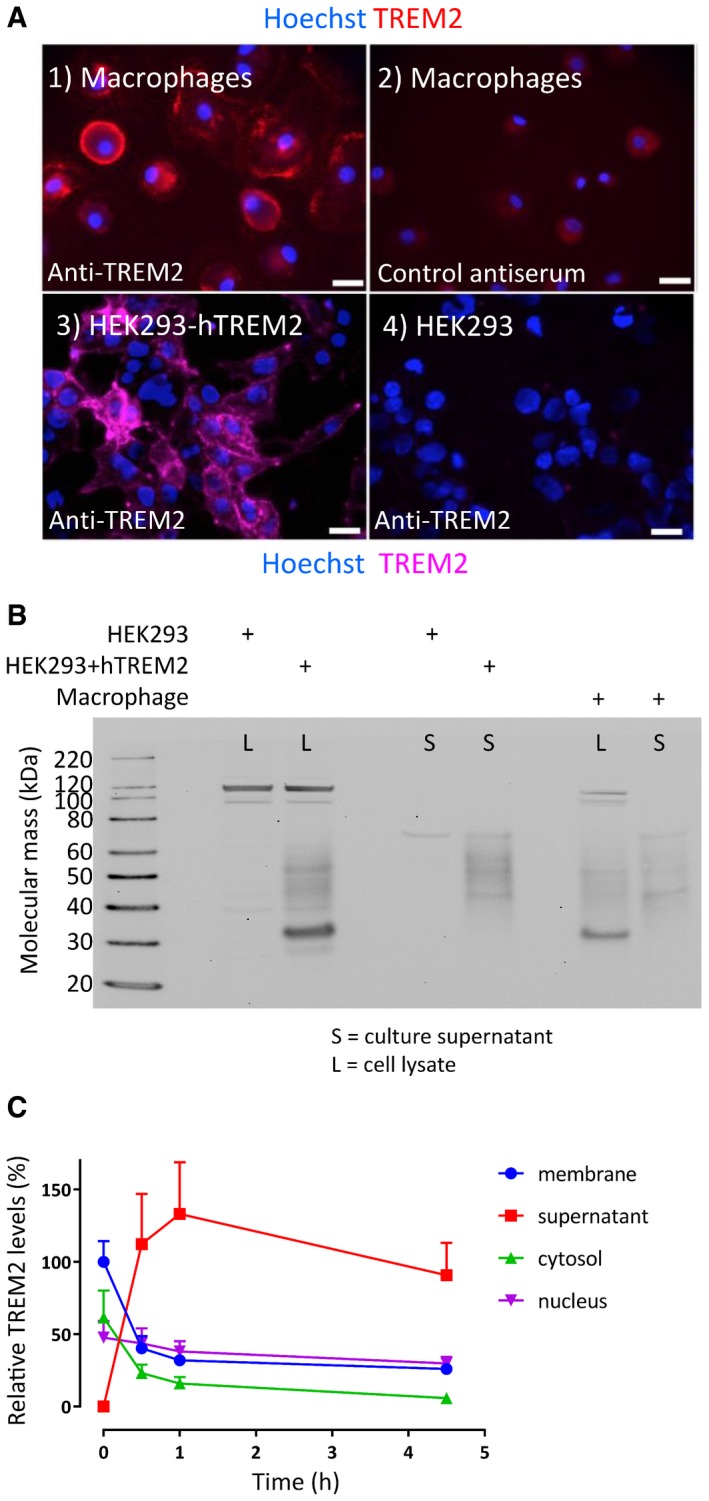
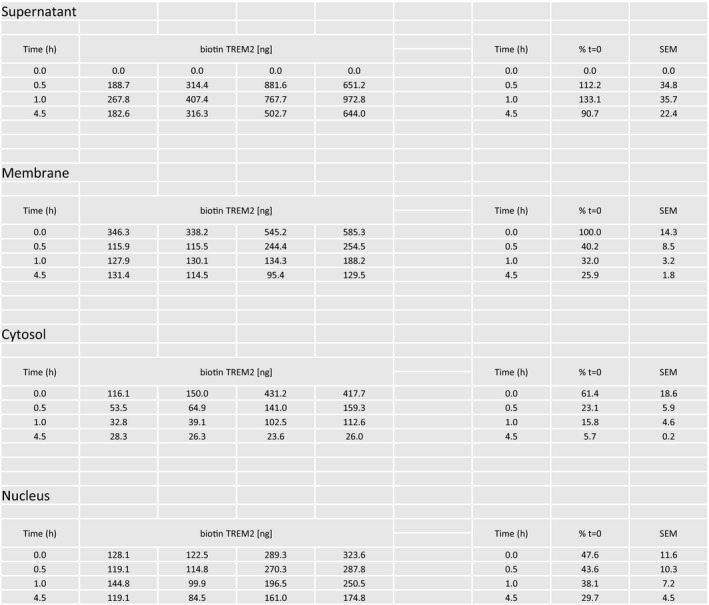
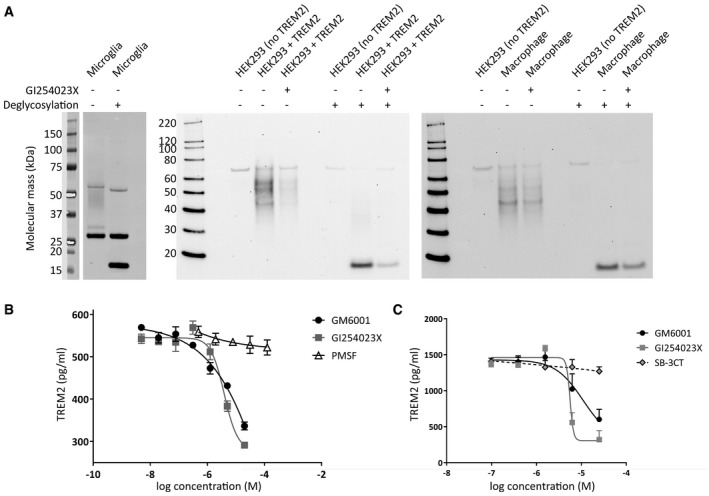
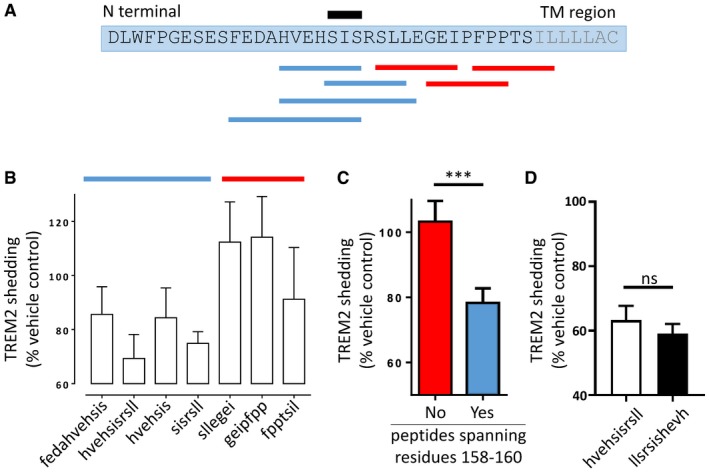
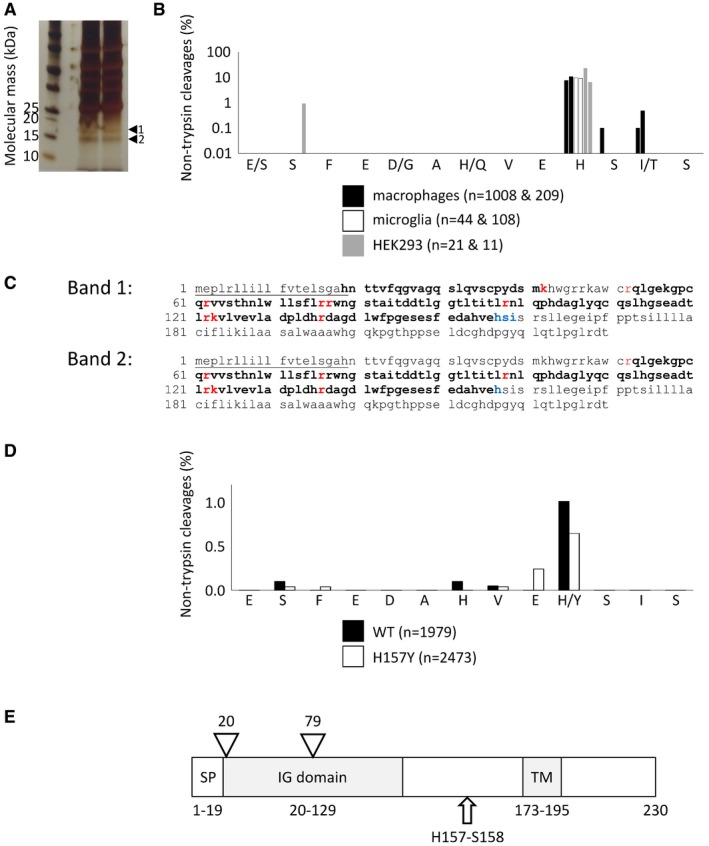
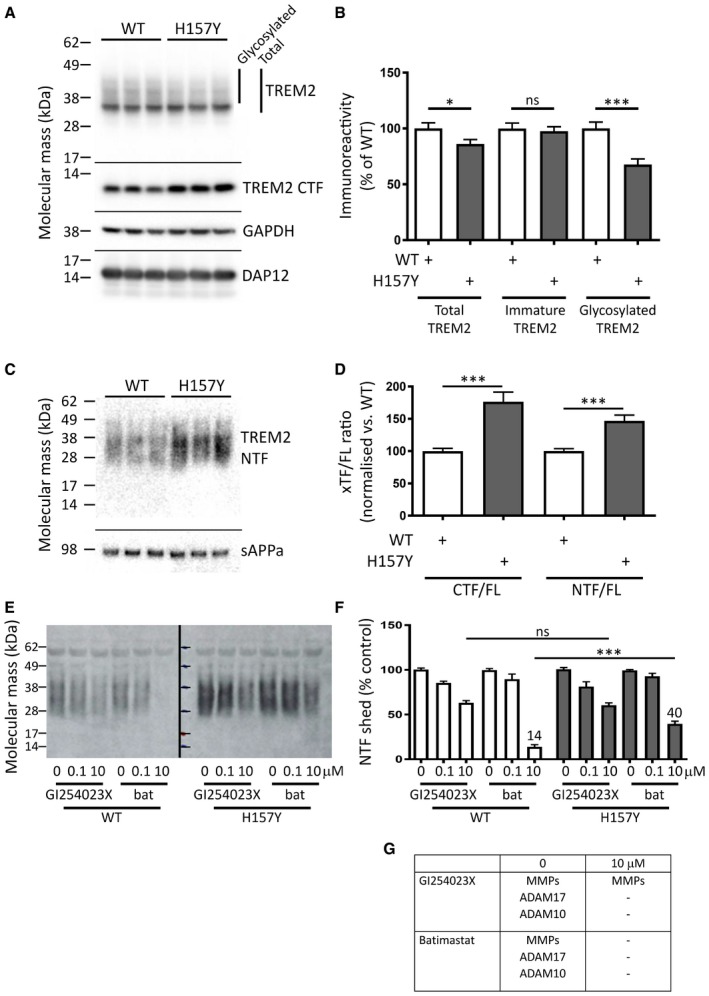
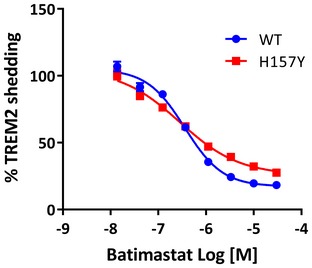
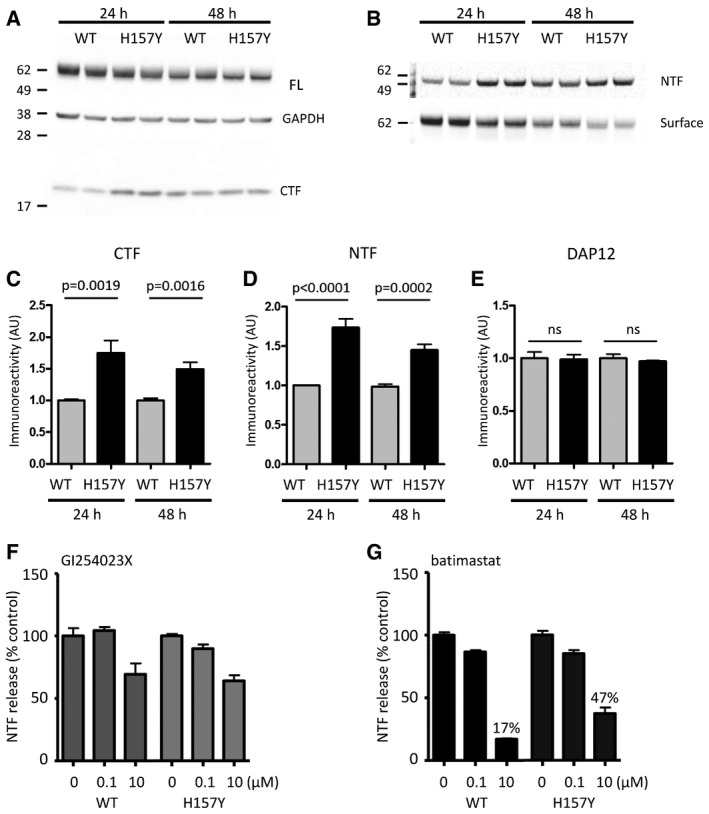
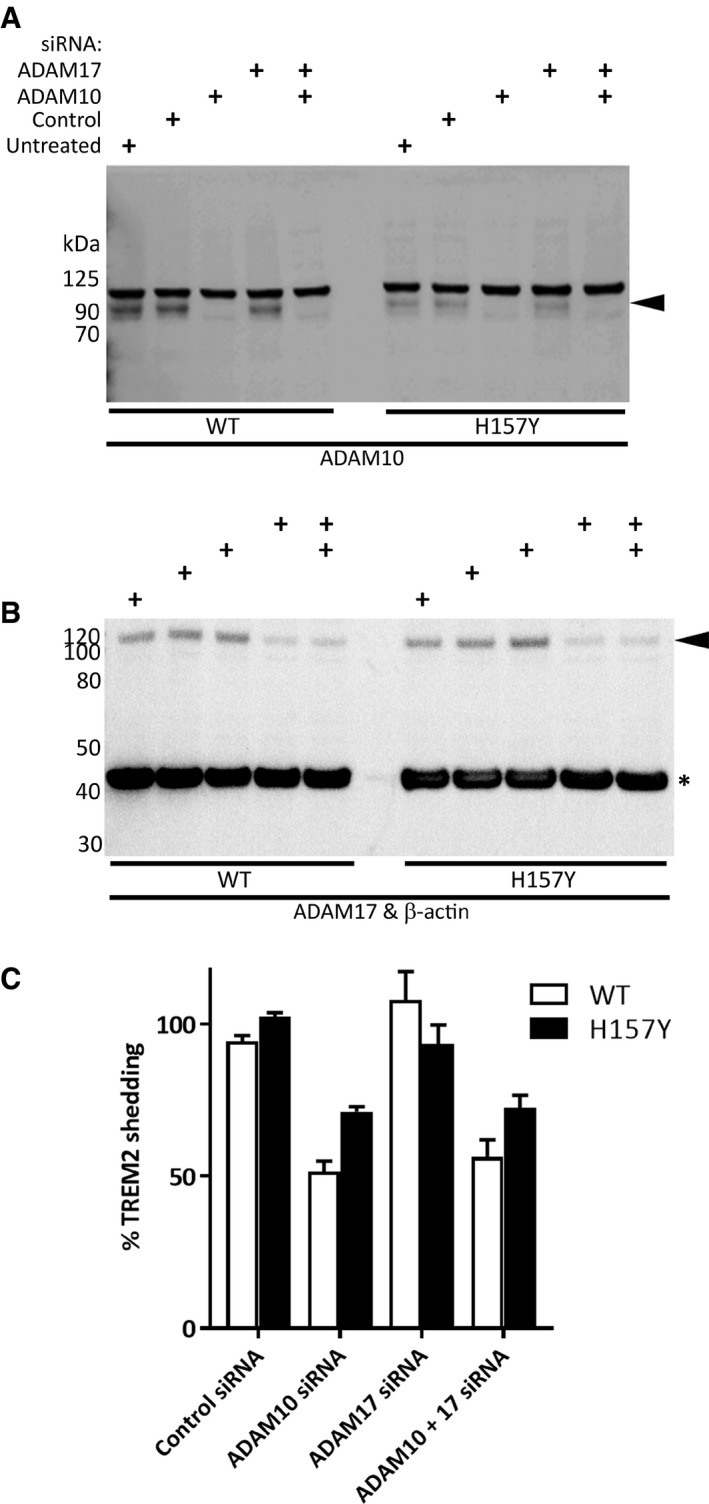
We have characterised the proteolytic cleavage events responsible for the shedding of triggering receptor expressed on myeloid cells 2 (TREM2) from primary cultures of human macrophages, murine microglia and TREM2‐expressing human embryonic kidney (HEK293) cells. In all cell types, a soluble 17 kDa N‐terminal cleavage fragment was shed into the conditioned media in a constitutive process that is inhibited by G1254023X and metalloprotease inhibitors and siRNA targeting ADAM10. Inhibitors of serine proteases and matrix metalloproteinases 2/9, and ADAM17 siRNA did not block TREM2 shedding. Peptidomimetic protease inhibitors highlighted a possible cleavage site, and mass spectrometry confirmed that shedding occurred predominantly at the H157‐S158 peptide bond for both wild‐type and H157Y human TREM2 and for the wild‐type murine orthologue. Crucially, we also show that the Alzheimer's disease‐associated H157Y TREM2 variant was shed more rapidly than wild type from HEK293 cells, possibly by a novel, batimastat‐ and ADAM10‐siRNA‐independent, sheddase activity. These insights offer new therapeutic targets for modulating the innate immune response in Alzheimer's and other neurological diseases.
Overview
The claims and statistics of this paper haven’t been checked yet.
Run the check — free, no account needed. It reads the open-access text and checks the sources it cites.
Integrity signals
Registry
Cites
Statistics
Figures
Verification
Claims the paper makes
The claims and statistics of this paper haven’t been checked yet.
Run the check — free, no account needed. It reads the open-access text and checks the sources it cites.
Claims other papers make about this one
Each is checked against this paper’s own text: does it say what the citing paper says it does?
The source backs part of the claim, not all of it — or backs it for a different population, condition or comparison.
In the citing paper
“Increased shedding from microglia [45], leading to phagocytosis deficits [46]”
From TREM2/PLCγ2 signalling in immune cells: function, structural insight, and potential therapeutic modulation (2021) · cites this paper as [45]
Experimental — accuracy not yet measuredThe cited source says what the claim attributes to it.
In the citing paper
“and increased shedding (p.H157Y [45], Table 1)”
From TREM2/PLCγ2 signalling in immune cells: function, structural insight, and potential therapeutic modulation (2021) · cites this paper as [45]
Self-check
Percentages, sums and reported differences re-computed from the paper’s own numbers.
The self-check needs the paper’s full text.
Citations
Cites
A Unique Microglia Type Associated with Restricting Development of Alzheimer’s Disease
Keren-Shaul, H., Spinrad, A., Weiner, A., Matcovitch-Natan, O., Dvir-Szternfeld, R., Ulland, T. K., David, E., Baruch, K., Lara-Astaiso, D., Toth, B., et al. (2017) · Cell · doi:10.1016/j.cell.2017.05.018 · Cited by 5,493
TREM2 Variants in Alzheimer's Disease
Guerreiro, R., Wojtas, A., Bras, J., Carrasquillo, M., Rogaeva, E., Majounie, E., Cruchaga, C., Sassi, C., Kauwe, J. S. K., Younkin, S., et al. (2013) · New England Journal of Medicine · doi:10.1056/nejmoa1211851 · Cited by 3,020
Variant of TREM2 Associated with the Risk of Alzheimer's Disease
Jonsson, T., Stefansson, H., Steinberg, S., Jonsdottir, I., Jonsson, P. V., Snaedal, J., Bjornsson, S., Huttenlocher, J., Levey, A. I., Lah, J. J., et al. (2013) · New England Journal of Medicine · doi:10.1056/nejmoa1211103 · Cited by 2,558
TREM2 Lipid Sensing Sustains the Microglial Response in an Alzheimer’s Disease Model
Wang, Y., Cella, M., Mallinson, K., Ulrich, J. D., Young, K. L., Robinette, M. L., Gilfillan, S., Krishnan, G. M., Sudhakar, S., Zinselmeyer, B. H., et al. (2015) · Cell · doi:10.1016/j.cell.2015.01.049 · Cited by 1,736
Takahashi, K., Rochford, C. D. P., & Neumann, H. (2005) · The Journal of Experimental Medicine · doi:10.1084/jem.20041611 · Cited by 1,124
Yuan, P., Condello, C., Keene, C. D., Wang, Y., Bird, T. D., Paul, S. M., Luo, W., Colonna, M., Baddeley, D., & Grutzendler, J. (2016) · Neuron · doi:10.1016/j.neuron.2016.05.003 · Cited by 817
TREM2 mutations implicated in neurodegeneration impair cell surface transport and phagocytosis
Kleinberger, G., Yamanishi, Y., Suárez-Calvet, M., Czirr, E., Lohmann, E., Cuyvers, E., Struyfs, H., Pettkus, N., Wenninger-Weinzierl, A., Mazaheri, F., et al. (2014) · Science Translational Medicine · doi:10.1126/scitranslmed.3009093 · Cited by 798
TREMs in the immune system and beyond
Colonna, M. (2003) · Nature Reviews Immunology · doi:10.1038/nri1106 · Cited by 701
Jay, T. R., Miller, C. M., Cheng, P. J., Graham, L. C., Bemiller, S., Broihier, M. L., Xu, G., Margevicius, D., Karlo, J. C., Sousa, G. L., et al. (2015) · Journal of Experimental Medicine · doi:10.1084/jem.20142322 · Cited by 682 · cited 2×
“While there is experimental support for TREM2 playing such a protective role during amyloid plaque deposition (Wang et al, 2015; Yuan et al, 2016), there are also conflicting accounts (Jay et al, 2015).”
BackgroundSuárez‐Calvet, M., Kleinberger, G., Araque Caballero, M. Á., Brendel, M., Rominger, A., Alcolea, D., Fortea, J., Lleó, A., Blesa, R., Gispert, J. D., et al. (2016) · EMBO Molecular Medicine · doi:10.15252/emmm.201506123 · Cited by 522
Research works printed but not linked: 1
- Jonsson T, Stefansson K (2013) TREM2 and neurodegenerative disease. N Engl J Med 369: 1568–1569
Cited by
Sorted by citations
Microglia in neurodegenerative diseases: mechanism and potential therapeutic targets
Gao, C., Jiang, J., Tan, Y., & Chen, S. (2023) · Signal Transduction and Targeted Therapy · doi:10.1038/s41392-023-01588-0 · Cited by 1,616
TREM2 — a key player in microglial biology and Alzheimer disease
Ulland, T. K., & Colonna, M. (2018) · Nature Reviews Neurology · doi:10.1038/s41582-018-0072-1 · Cited by 735
The Physiology, Pathology, and Potential Therapeutic Applications of the TREM2 Signaling Pathway
Deczkowska, A., Weiner, A., & Amit, I. (2020) · Cell · doi:10.1016/j.cell.2020.05.003 · Cited by 648
Alzheimer’s disease: insights into pathology, molecular mechanisms, and therapy
Zheng, Q., & Wang, X. (2024) · Protein & Cell · doi:10.1093/procel/pwae026 · Cited by 483
Colonna, M. (2023) · Nature Reviews Immunology · doi:10.1038/s41577-023-00837-1 · Cited by 394
Zhong, L., Xu, Y., Zhuo, R., Wang, T., Wang, K., Huang, R., Wang, D., Gao, Y., Zhu, Y., Sheng, X., et al. (2019) · Nature Communications · doi:10.1038/s41467-019-09118-9 · Cited by 371
Initiative, F. T. A. D. N., Suárez-Calvet, M., Morenas-Rodríguez, E., Kleinberger, G., Schlepckow, K., Araque Caballero, M. Á., Franzmeier, N., Capell, A., Fellerer, K., Nuscher, B., et al. (2019) · Molecular Neurodegeneration · doi:10.1186/s13024-018-0301-5 · Cited by 347
Immune Signaling in Neurodegeneration
Hammond, T. R., Marsh, S. E., & Stevens, B. (2019) · Immunity · doi:10.1016/j.immuni.2019.03.016 · Cited by 336
Enhancing protective microglial activities with a dual function TREM2 antibody to the stalk region
Schlepckow, K., Monroe, K. M., Kleinberger, G., Cantuti‐Castelvetri, L., Parhizkar, S., Xia, D., Willem, M., Werner, G., Pettkus, N., Brunner, B., et al. (2020) · EMBO Molecular Medicine · doi:10.15252/emmm.201911227 · Cited by 324
Humanized TREM2 mice reveal microglia-intrinsic and -extrinsic effects of R47H polymorphism
Song, W. M., Joshita, S., Zhou, Y., Ulland, T. K., Gilfillan, S., & Colonna, M. (2018) · Journal of Experimental Medicine · doi:10.1084/jem.20171529 · Cited by 305
Self-citationThe MS4A gene cluster is a key modulator of soluble TREM2 and Alzheimer’s disease risk
Deming, Y., Filipello, F., Cignarella, F., Cantoni, C., Hsu, S., Mikesell, R., Li, Z., Del-Aguila, J. L., Dube, U., Farias, F. G., et al. (2019) · Science Translational Medicine · doi:10.1126/scitranslmed.aau2291 · Cited by 271
“Recently, a cleavage site was identified in TREM2, which can be targeted by proteases such as ADAM10, ADAM17, and -secretase to generate sTREM2 (21, 22).”
Wang, X., He, Q., Zhou, C., Xu, Y., Liu, D., Fujiwara, N., Kubota, N., Click, A., Henderson, P., Vancil, J., et al. (2023) · Immunity · doi:10.1016/j.immuni.2022.11.013 · Cited by 262
The role of TREM2 in Alzheimer's disease and other neurodegenerative disorders
Carmona, S., Zahs, K., Wu, E., Dakin, K., Bras, J., & Guerreiro, R. (2018) · The Lancet Neurology · doi:10.1016/s1474-4422(18)30232-1 · Cited by 244
van Lengerich, B., Zhan, L., Xia, D., Chan, D., Joy, D., Park, J. I., Tatarakis, D., Calvert, M., Hummel, S., Lianoglou, S., et al. (2023) · Nature Neuroscience · doi:10.1038/s41593-022-01240-0 · Cited by 233
The emerging role of ADAM metalloproteinases in immunity
Lambrecht, B. N., Vanderkerken, M. A., & Hammad, H. (2018) · Nature reviews. Immunology · doi:10.1038/s41577-018-0068-5 · Cited by 242
Emerging Microglia Biology Defines Novel Therapeutic Approaches for Alzheimer’s Disease
Lewcock, J. W., Schlepckow, K., Di Paolo, G., Tahirovic, S., Monroe, K. M., & Haass, C. (2020) · Neuron · doi:10.1016/j.neuron.2020.09.029 · Cited by 221
The substrate repertoire of γ-secretase/presenilin
Güner, G., & Lichtenthaler, S. F. (2020) · Seminars in Cell and Developmental Biology · doi:10.1016/j.semcdb.2020.05.019 · Cited by 202
TREM2 dependent and independent functions of microglia in Alzheimer’s disease
Hou, J., Chen, Y., Grajales-Reyes, G., & Colonna, M. (2022) · Molecular Neurodegeneration · doi:10.1186/s13024-022-00588-y · Cited by 191
Zhong, L., Sheng, X., Wang, W., Li, Y., Zhuo, R., Wang, K., Zhang, L., Hu, D.-D., Hong, Y., Chen, L., et al. (2023) · Immunity · doi:10.1016/j.immuni.2023.06.016 · Cited by 168
High‐affinity interactions and signal transduction between Aβ oligomers and TREM2
Lessard, C. B., Malnik, S. L., Zhou, Y., Ladd, T. B., Cruz, P. E., Ran, Y., Chakrabaty, P., Mahan, T. E., Holtzman, D. M., Ulrich, J. D., et al. (2018) · EMBO Molecular Medicine · doi:10.15252/emmm.201809027 · Cited by 156
Self-citationSudom, A., Talreja, S., Danao, J., Bragg, E., Kegel, R., Min, X., Richardson, J., Zhang, Z., Sharkov, N., Marcora, E., et al. (2018) · Journal of Biological Chemistry · doi:10.1074/jbc.ra118.002352 · Cited by 149
Microglial inflammation and phagocytosis in Alzheimer's disease: Potential therapeutic targets
Nizami, S., Hall‐Roberts, H., Warrier, S., Cowley, S. A., & Di Daniel, E. (2019) · British Journal of Pharmacology · doi:10.1111/bph.14618 · Cited by 147
Ellwanger, D. C., Wang, S., Brioschi, S., Shao, Z., Green, L. B., Case, R. B., Yoo, D., Weishuhn, D., Rathanaswami, P., Bradley, J., et al. (2021) · Proceedings of the National Academy of Sciences · doi:10.1073/pnas.2017742118 · Cited by 144
Soluble TREM2: Innocent bystander or active player in neurological diseases?
Filipello, F., Goldsbury, C., You, S. F., Locca, A., Karch, C. M., & Piccio, L. (2022) · Neurobiology of Disease · doi:10.1016/j.nbd.2022.105630 · Cited by 134
Functions of ‘A disintegrin and metalloproteases (ADAMs)’ in the mammalian nervous system
Hsia, H., Tüshaus, J., Brummer, T., Zheng, Y., Scilabra, S. D., & Lichtenthaler, S. F. (2019) · Cellular and Molecular Life Sciences · doi:10.1007/s00018-019-03173-7 · Cited by 148
Schlepckow, K., Morenas‐Rodríguez, E., Hong, S. Y., & Haass, C. (2023) · The Lancet Neurology · doi:10.1016/s1474-4422(23)00247-8 · Cited by 122
TREM2 ectodomain and its soluble form in Alzheimer’s disease
Yang, J., Fu, Z., Zhang, X., Xiong, M., Meng, L., & Zhang, Z. (2020) · Journal of Neuroinflammation · doi:10.1186/s12974-020-01878-2 · Cited by 113
Rivera, S., García-González, L., Khrestchatisky, M., & Baranger, K. (2019) · Cellular and Molecular Life Sciences · doi:10.1007/s00018-019-03178-2 · Cited by 111
Distinct Signaling Pathways Regulate TREM2 Phagocytic and NFκB Antagonistic Activities
Yao, H., Coppola, K., Schweig, J. E., Crawford, F., Mullan, M., & Paris, D. (2019) · Frontiers in Cellular Neuroscience · doi:10.3389/fncel.2019.00457 · Cited by 110
TREM2 brain transcript-specific studies in AD and TREM2 mutation carriers
Del‐Aguila, J. L., Benítez, B. A., Li, Z., Dube, U., Mihindukulasuriya, K. A., Budde, J., Farias, F., Fernández, M. V., Ibáñez, L., Jiang, S., et al. (2019) · Molecular Neurodegeneration · doi:10.1186/s13024-019-0319-3 · Cited by 106
Insights Into the Role of CSF1R in the Central Nervous System and Neurological Disorders
Hu, B., Duan, S., Wang, Z., Li, X., Zhou, Y., Zhang, X., Zhang, Y., Xu, H., & Zheng, H. (2021) · Frontiers in Aging Neuroscience · doi:10.3389/fnagi.2021.789834 · Cited by 112
Self-citationTREM2 triggers microglial density and age-related neuronal loss
Linnartz‐Gerlach, B., Bodea, L., Klaus, C., Ginolhac, A., Halder, R., Sinkkonen, L., Walter, J., Colonna, M., & Neumann, H. (2019) · Glia · doi:10.1002/glia.23563 · Cited by 104
Soluble TREM2 and biomarkers of central and peripheral inflammation in neurodegenerative disease
Bekris, L. M., Khrestian, M., Dyne, E. D., Shao, Y. Y., Pillai, J. A., Rao, S. M., Bemiller, S. M., Lamb, B. T., Fernandez, H. H., & Leverenz, J. B. (2018) · Journal of Neuroimmunology · doi:10.1016/j.jneuroim.2018.03.003 · Cited by 101
Kalaria, R. N., Maestre, G. E., Mahinrad, S., Acosta, D. M., Akinyemi, R., Alladi, S., Allegri, R., Arshad, F., Babalola, D. O., Baiyewu, O., et al. (2024) · Alzheimer s & Dementia · doi:10.1002/alz.13836 · Cited by 110
New fluid biomarkers tracking non-amyloid-β and non-tau pathology in Alzheimer’s disease
Park, S. A., Han, S. M., & Kim, C. E. (2020) · Experimental & Molecular Medicine · doi:10.1038/s12276-020-0418-9 · Cited by 96
Reifschneider, A., Robinson, S., van Lengerich, B., Gnörich, J., Logan, T., Heindl, S., Vogt, M. A., Weidinger, E., Riedl, L., Wind, K., et al. (2022) · The EMBO Journal · doi:10.15252/embj.2021109108 · Cited by 89
Vilalta, A., Zhou, Y., Sevalle, J., Griffin, J. K., Satoh, K., Allendorf, D. H., De, S., Puigdellívol, M., Bruzas, A., Burguillos, M. A., et al. (2021) · Journal of Biological Chemistry · doi:10.1016/j.jbc.2021.100631 · Cited by 77
Self-citationShifting paradigms: The central role of microglia in Alzheimer’s disease
Schwabe, T., Srinivasan, K., & Rhinn, H. (2020) · Neurobiology of Disease · doi:10.1016/j.nbd.2020.104962 · Cited by 84
Functional insights from biophysical study of TREM2 interactions with apoE and Aβ 1‐42
Kober, D. L., Stuchell‐Brereton, M. D., Kluender, C. E., Dean, H. B., Strickland, M. R., Steinberg, D. F., Nelson, S. S., Baban, B. A., Holtzman, D. M., Frieden, C., et al. (2020) · Alzheimer s & Dementia · doi:10.1002/alz.12194 · Cited by 86
Peripheral and central neuroimmune mechanisms in Alzheimer’s disease pathogenesis
Zhang, S., Gao, Y., Zhao, Y., Huang, T. Y., Zheng, Q., & Wang, X. (2025) · Molecular Neurodegeneration · doi:10.1186/s13024-025-00812-5 · Cited by 78
TREM2 expression in the human brain: a marker of monocyte recruitment?
Fahrenhold, M., Rakić, S., Classey, J. D., Brayne, C., Ince, P. G., Nicoll, J. A. R., Boche, D., & MRC‐CFAS (2017) · Brain Pathology · doi:10.1111/bpa.12564 · Cited by 74
Current views on meningeal lymphatics and immunity in aging and Alzheimer’s disease
Rego, S., Sánchez, G., & Mesquita, S. D. (2023) · Molecular Neurodegeneration · doi:10.1186/s13024-023-00645-0 · Cited by 79
The VCAM1–ApoE pathway directs microglial chemotaxis and alleviates Alzheimer’s disease pathology
Lau, S.-F., Wu, W., Wong, H. Y., Ouyang, L., Qiao, Y., Xu, J., Lau, J. H.-Y., Wong, C., Jiang, Y., Holtzman, D. M., et al. (2023) · Nature Aging · doi:10.1038/s43587-023-00491-1 · Cited by 70
TREM2 and sTREM2 in Alzheimer’s disease: from mechanisms to therapies
Zhang, L., Xiang, X., Li, Y., Bu, G., & Chen, X. (2025) · Molecular Neurodegeneration · doi:10.1186/s13024-025-00834-z · Cited by 87
Soluble TREM2 levels associate with conversion from mild cognitive impairment to Alzheimer’s disease
Zhao, A., Jiao, Y., Ye, G., Kang, W., Tan, L., Li, Y., Deng, Y., & Liu, J. (2022) · Journal of Clinical Investigation · doi:10.1172/jci158708 · Cited by 70
Magno, L., Bunney, T. D., Mead, E., Svensson, F., & Bictash, M. N. (2021) · Molecular Neurodegeneration · doi:10.1186/s13024-021-00436-5 · Cited by 64
Secretases in Alzheimer's disease: Novel insights into proteolysis of APP and TREM2
Lichtenthaler, S. F., Tschirner, S. K., & Steiner, H. (2022) · Current Opinion in Neurobiology · doi:10.1016/j.conb.2021.09.003 · Cited by 60
Dhandapani, R., Neri, M., Bernhard, M., Brzak, I., Schweizer, T., Rudin, S., Joller, S., Berth, R., Kernen, J., Neuhaus, A., et al. (2022) · Cell Reports · doi:10.1016/j.celrep.2022.110883 · Cited by 60
CSF sTREM2 in delirium—relation to Alzheimer’s disease CSF biomarkers Aβ42, t-tau and p-tau
Henjum, K., Quist‐Paulsen, E., Zetterberg, H., Blennow, K., Nilsson, L. N. G., & Watne, L. O. (2018) · Journal of Neuroinflammation · doi:10.1186/s12974-018-1331-1 · Cited by 56
Pocock, J., Vasilopoulou, F., Svensson, E., & Cosker, K. (2024) · Neuropharmacology · doi:10.1016/j.neuropharm.2024.110020 · Cited by 54
Deming, Y. K., Li, Z., Benítez, B. A., & Cruchaga, C. (2018) · Expert Opinion on Therapeutic Targets · doi:10.1080/14728222.2018.1486823 · Cited by 51
Penney, J., Ralvenius, W. T., Loon, A., Cerit, O., Dileep, V., Milo, B., Pao, P., Woolf, H., & Tsai, L. (2024) · Glia · doi:10.1002/glia.24485 · Cited by 52
TREM2 expression and amyloid‐beta phagocytosis in Alzheimer's disease
La Rosa, F., Agostini, S., Piancone, F., Marventano, I., Hernis, A., Fenoglio, C., Galimberti, D., Scarpini, E., Saresella, M., & Clerici, M. (2023) · International Journal of Molecular Sciences · doi:10.3390/ijms24108626 · Cited by 50
Soluble TREM2 triggers microglial dysfunction in neuromyelitis optica spectrum disorders
Qin, C., Chen, M., Dong, M., Yang, S., Zhang, H., You, Y., Zhou, L., Chu, Y., Tang, Y., Pang, X., et al. (2023) · Brain · doi:10.1093/brain/awad321 · Cited by 54
Plasma levels of soluble TREM2 and neurofilament light chain in TREM2 rare variant carriers
Ashton, N. J., Suárez‐Calvet, M., Heslegrave, A., Hye, A., Razquín, C., Pástor, P., Sánchez‐Valle, R., Molinuevo, J. L., Visser, P. J., Blennow, K., et al. (2019) · Alzheimer s Research & Therapy · doi:10.1186/s13195-019-0545-5 · Cited by 45
Novel Targets for Alzheimer's Disease: A View Beyond Amyloid
Ray, W. J., & Buggia-Prévot, V. (2020) · Annual Review of Medicine · doi:10.1146/annurev-med-052919-120219 · Cited by 47
Does soluble TREM2 protect against Alzheimer's disease?
Brown, G. C., & St George-Hyslop, P. (2022) · Frontiers in Aging Neuroscience · doi:10.3389/fnagi.2021.834697 · Cited by 39
TREM2 splice isoforms generate soluble TREM2 species that disrupt long-term potentiation
Moutinho, M., Coronel, I., Tsai, A. P., Di Prisco, G. V., Pennington, T., Atwood, B. K., Puntambekar, S. S., Smith, D. C., Martinez, P., Han, S., et al. (2023) · Genome Medicine · doi:10.1186/s13073-023-01160-z · Cited by 42
“It is noteworthy that a high-molecular-weight smear is detected for all three sTREM2 species, suggesting robust glycosylation of sTREM2, which has been previously described [12, 47].”
BackgroundResultDean, H. B., Roberson, E. D., & Song, Y. (2019) · Frontiers in Neurology · doi:10.3389/fneur.2019.01252 · Cited by 43
Nicol, L. S. C., Thornton, P., Hatcher, J. P., Glover, C. P. J., Webster, C. I., Burrell, M. R., Hammett, K. M., Jones, C. A., Sleeman, M. A., Billinton, A., et al. (2017) · Pain · doi:10.1097/j.pain.0000000000001130 · Cited by 41
Self-citationHou, X., Bi, Y., Tan, M., Xu, W., Li, J., Shen, X., Dou, K., Tan, C., Tan, L., & Yu, J. (2019) · Neurobiology of Aging · doi:10.1016/j.neurobiolaging.2019.05.008 · Cited by 40
The Emerging Roles and Therapeutic Potential of Soluble TREM2 in Alzheimer’s Disease
Zhong, L., & Chen, X. (2019) · Frontiers in Aging Neuroscience · doi:10.3389/fnagi.2019.00328 · Cited by 40
Profiling TREM2 expression in amyotrophic lateral sclerosis
Jericó, I., Vicuña‐Urriza, J., Blanco‐Luquin, I., Macías, M., Martínez‐Merino, L., Roldán, M., Rojas‐García, R., Pagola, I., Carbayo, Á., de Luna, N., et al. (2023) · Brain Behavior and Immunity · doi:10.1016/j.bbi.2023.01.013 · Cited by 43
Therapeutic potential of ADAM10 modulation in Alzheimer’s disease: a review of the current evidence
Khezri, M. R., Mohebalizadeh, M., & Ghasemnejad‐Berenji, M. (2023) · Cell Communication and Signaling · doi:10.1186/s12964-023-01072-w · Cited by 42
Feiten, A. F., Dahm, K., Schlepckow, K., van Lengerich, B., Suh, J. H., Reifschneider, A., Wefers, B., Bartos, L. M., Wind-Mark, K., de Weerd, L., et al. (2026) · Nature Communications · doi:10.1038/s41467-026-68706-8 · Cited by 39
Sekiya, M., Wang, M., Fujisaki, N., Sakakibara, Y., Quan, X., Ehrlich, M. E., De Jager, P. L., Bennett, D. A., Schadt, E. E., Gandy, S., et al. (2018) · Genome Medicine · doi:10.1186/s13073-018-0530-9 · Cited by 38
Microglial Drug Targets in AD: Opportunities and Challenges in Drug Discovery and Development
Biber, K., Bhattacharya, A., Campbell, B. M., Piro, J. R., Rohe, M., Staal, R. G. W., Talanian, R. V., & Möller, T. (2019) · Frontiers in Pharmacology · doi:10.3389/fphar.2019.00840 · Cited by 39
Meprin β cleaves TREM2 and controls its phagocytic activity on macrophages
Berner, D. K., Wessolowski, L., Armbrust, F., Schneppenheim, J., Schlepckow, K., Koudelka, T., Scharfenberg, F., Lucius, R., Tholey, A., Kleinberger, G., et al. (2020) · The FASEB Journal · doi:10.1096/fj.201902183r · Cited by 39
PET imaging of microglia in Alzheimer's disease using copper-64 labeled TREM2 antibodies
Shojaei, M., Schaefer, R., Schlepckow, K., Kunze, L. H., Struebing, F. L., Brunner, B., Willem, M., Bartos, L. M., Feiten, A., Palumbo, G., et al. (2024) · Theranostics · doi:10.7150/thno.97149 · Cited by 35
Genetic and polygenic risk score analysis for Alzheimer's disease in the Chinese population
Zhou, X., Chen, Y., Ip, F. C. F., Lai, N. C. H., Li, Y. Y. T., Jiang, Y., Zhong, H., Chen, Y., Zhang, Y., Ma, S., et al. (2020) · Alzheimer s & Dementia Diagnosis Assessment & Disease Monitoring · doi:10.1002/dad2.12074 · Cited by 33
Steiner, A., Schlepckow, K., Brunner, B., Steiner, H., Haass, C., & Hagn, F. (2020) · The EMBO Journal · doi:10.15252/embj.2019104247 · Cited by 30
Variant TREM2 Signaling in Alzheimer's Disease
Olufunmilayo, E. O., & Holsinger, R. M. D. (2022) · Journal of Molecular Biology · doi:10.1016/j.jmb.2022.167470 · Cited by 33
Roles of TREM2 in Alzheimer’s disease
Qi, X., Zhu, K., Ke, W., Wang, J., Mao, S., & Chen, G. (2025) · Translational Neurodegeneration · doi:10.1186/s40035-025-00515-3 · Cited by 38
Tobeh, N. S., & Bruce, K. D. (2023) · Frontiers in Aging Neuroscience · doi:10.3389/fnagi.2023.1259012 · Cited by 35
Regulation of Leukocytes by TspanC8 Tetraspanins and the “Molecular Scissor” ADAM10
Matthews, A. L., Koo, C. Z., Szyroka, J., Harrison, N. J., Kanhere, A., & Tomlinson, M. G. (2018) · Frontiers in Immunology · doi:10.3389/fimmu.2018.01451 · Cited by 30
Sheng, X., Yao, Y., Huang, R., Xu, Y., Zhu, Y., Chen, L., Zhang, L., Wang, W., Zhuo, R., Can, D., et al. (2021) · Journal of Neuroinflammation · doi:10.1186/s12974-021-02340-7 · Cited by 27
Kiianitsa, K., Kurtz, I., Beeman, N. E., Matsushita, M. M., Chien, W., Raskind, W. H., & Korvatska, O. (2021) · Journal of Leukocyte Biology · doi:10.1002/jlb.2hi0720-463rr · Cited by 25
Trem2 H157Y increases soluble TREM2 production and reduces amyloid pathology
Qiao, W., Chen, Y., Zhong, J., Madden, B. J., Charlesworth, C. M., Martens, Y. A., Liu, C., Knight, J. A., Ikezu, T. C., Kurti, A., et al. (2023) · Molecular Neurodegeneration · doi:10.1186/s13024-023-00599-3 · Cited by 28
TREM2+ macrophages: a key role in disease development
Wang, X., Wang, Y., Yang, L. X., Zhang, Y., & Yang, L. (2025) · Frontiers in Immunology · doi:10.3389/fimmu.2025.1550893 · Cited by 29
Hassan, H., Rawlinson, C., Lan, Y., Jenkins, S. I., & Chen, R. (2025) · Biomolecules · doi:10.3390/biom15111629 · Cited by 30
Lin, C., Kong, Y., Chen, Q., Zeng, J., Pan, X., & Miao, J. (2024) · Frontiers in Aging Neuroscience · doi:10.3389/fnagi.2024.1420731 · Cited by 24
The double-edged role and therapeutic potential of TREM2 in atherosclerosis
Zhu, B., Liu, Y., & Peng, D. (2024) · Biomarker Research · doi:10.1186/s40364-024-00675-w · Cited by 28
TREM2 in Neurodegenerative Disorders: Mutation Spectrum, Pathophysiology, and Therapeutic Targeting
Yang, H.-W., Kim, D., Yang, Y., Bagyinszky, E., & An, S. S. A. (2025) · International Journal of Molecular Sciences · doi:10.3390/ijms26157057 · Cited by 26
Ibach, M., Mathews, M., Linnartz‐Gerlach, B., Theil, S., Kumar, S., Feederle, R., Brüstle, O., Neumann, H., & Walter, J. (2020) · Glia · doi:10.1002/glia.23953 · Cited by 25
Serum soluble TREM2 is an independent biomarker associated with coronary heart disease
Liu, W., Weng, S., Liu, H., Cao, C., Wang, S., Wu, S., He, J., Yang, Y., Hu, D., Luo, Y., et al. (2023) · Clinica Chimica Acta · doi:10.1016/j.cca.2023.117499 · Cited by 22
Khan, M. I., Khan, M. Z., Shin, J. H., Shin, T. S., Lee, Y. B., Kim, M. Y., & Kim, J. D. (2022) · Molecules · doi:10.3390/molecules27072079 · Cited by 24
TREM2-expressing macrophages in liver diseases
Wang, X., Qiu, Z., Zhong, Z., & Liang, S. (2025) · Trends in Endocrinology and Metabolism · doi:10.1016/j.tem.2025.04.009 · Cited by 24
Beckmann, N., Neuhaus, A., Zurbruegg, S., Volkmer, P., Patiño, C., Joller, S., Feuerbach, D., Doelemeyer, A., Schweizer, T., Rudin, S., et al. (2023) · Journal of Neuroinflammation · doi:10.1186/s12974-022-02671-z · Cited by 24
APOEε4 and risk of Alzheimer’s disease – time to move forward
Lefterov, I. M., Fitz, N. F., Lü, Y., & Koldamova, R. P. (2023) · Frontiers in Neuroscience · doi:10.3389/fnins.2023.1195724 · Cited by 25
Current understanding on TREM-2 molecular biology and physiopathological functions
Bharadwaj, S., Groza, Y., Mierzwicka, J. M., & Malý, P. (2024) · International Immunopharmacology · doi:10.1016/j.intimp.2024.112042 · Cited by 23
Differential interaction with TREM2 modulates microglial uptake of modified Aβ species
Joshi, P., Riffel, F., Satoh, K., Enomoto, M., Qamar, S., Scheiblich, H., Villacampa, N., Kumar, S., Theil, S., Parhizkar, S., et al. (2021) · Glia · doi:10.1002/glia.24077 · Cited by 21
Self-citationPeripheral sTREM2-Related Inflammatory Activity Alterations in Early-Stage Alzheimer’s Disease
Weber, G. E., Khrestian, M., Tuason, E. D., Shao, Y. Y., Pillai, J. A., Rao, S. M., Feng, H., Zhou, Y., Cheng, F., DeSilva, T. M., et al. (2022) · The Journal of Immunology · doi:10.4049/jimmunol.2100771 · Cited by 22
Self-citationThe Hidden Role of Non-Canonical Amyloid β Isoforms in Alzheimer’s Disease
Busch, L., Eggert, S., Endres, K., & Bufe, B. (2022) · Cells · doi:10.3390/cells11213421 · Cited by 20
Lau, S., Fu, A. K. Y., & Ip, N. Y. (2023) · Journal of Neurochemistry · doi:10.1111/jnc.15933 · Cited by 21
Basha, S. C., Ramaiah, M. J., & Rao, K. S. J. (2023) · Journal of Alzheimer s Disease · doi:10.3233/jad-221070 · Cited by 23
Selection and structural characterization of anti-TREM2 scFvs that reduce levels of shed ectodomain
Szykowska, A., Chen, Y., Smith, T. B., Preger, C., Yang, J., Qian, D., Mukhopadhyay, S. M. M., Wigren, E., Neame, S. J., Gräslund, S., et al. (2021) · Structure · doi:10.1016/j.str.2021.06.010 · Cited by 20
Function and mechanism of TREM2 in bacterial infection
Wu, Z., Yang, S., Fang, X., Shu, Q., & Chen, Q. (2024) · PLoS Pathogens · doi:10.1371/journal.ppat.1011895 · Cited by 19
TREM2 in cardiovascular diseases: Mechanisms and therapeutic perspectives
Zhu, W., Yue, Z., Wang, Y., Guo, L., & Liu, C. (2025) · Ageing Research Reviews · doi:10.1016/j.arr.2025.102774 · Cited by 18
Rosner, D., Sun, J., Cacace, R., Yee, A., Wagh, C., Rychkova, A., Dunlap, M., Gulbranson, D. R., Ibrahim, A., Wang, X., et al. (2025) · Neuron · doi:10.1016/j.neuron.2025.11.022 · Cited by 20
Dynamic insights into the effects of nonsynonymous polymorphisms (nsSNPs) on loss of TREM2 function
Dash, R., Munni, Y. A., Mitra, S., Choi, H. J., Jahan, S. I., Chowdhury, A., Jang, T. J., & Moon, I. S. (2022) · Scientific Reports · doi:10.1038/s41598-022-13120-5 · Cited by 19
Metadata
- Authors
- Thornton, P., Sevalle, J., Deery, M. J., Fraser, G., Zhou, Y., Ståhl, S., Franssen, E. H., Dodd, R. B., Qamar, S., Gomez Perez‐Nievas, B., Nicol, L. S., Eketjäll, S., Revell, J., Jones, C., Billinton, A., St George‐Hyslop, P. H., Chessell, I., & Crowther, D. C.
- Affiliations
- AstraZeneca (United Kingdom) (GB)
- University of Cambridge (GB)
- University of Toronto (CA)
- Karolinska Institutet (SE)
- Integrated Cardio Metabolic Centre (SE)
- Corresponding author
- Crowther, Damian C
- ORCID
- Venue
- EMBO Molecular Medicine
- Published
- 2017-08-30
- Volume
- 9
- Issue
- 10
- Pages
- 1366-1378
- ISSN
- 1757-4676 (ISSN-L)
- 1757-4684
- PMC
- PMC5623839
- OpenAlex
- W2753509052
- Cited by
- 200
- References
- 33
- Citations by year
- 2026: 29 · 2025: 34 · 2024: 18 · 2023: 37 · 2022: 17 · 2021: 18 · 2020: 16 · 2019: 14 · 2018: 15 · 2017: 2
- FWCI
- 6.40
- Type
- journal article
- Language
- en
- Open access
- gold
- doi.org
- Locations
- EMBO Molecular Medicine (publishedVersion, cc-by)
- Europe PMC (PubMed Central) (publishedVersion, cc-by)
- PubMed Central (publishedVersion, cc-by)
- PubMed (publishedVersion)
- DOAJ (DOAJ: Directory of Open Access Journals) (submittedVersion)
- Research Portal (King's College London) (submittedVersion, cc-by)
- Apollo (University of Cambridge) (submittedVersion, cc-by)
- Apollo (cc-by)
- Funders
- Wellcome
- Canadian Institute of Health Research
- Topics
- Life Sciences › Neuroscience › Neurology › Neuroinflammation and Neurodegeneration Mechanisms
- Life Sciences › Neuroscience › Cellular and Molecular Neuroscience › Alzheimer's disease research and treatments
- Life Sciences › Biochemistry, Genetics and Molecular Biology › Cancer Research › Protease and Inhibitor Mechanisms
- Keywords
- TREM2, Alzheimer's disease, protein shedding, proteolytic cleavage, ADAM10, metalloproteinase inhibitors, microglia, macrophages, innate immune response, therapeutic target
- MeSH terms
- ADAM10 Protein, ADAM17 Protein, Alzheimer Disease, Animals, Animals, Newborn, Humans, Ketocholesterols, Macrophages, Membrane Glycoproteins, Membrane Proteins, Mice, Inbred C57BL, Receptors, Immunologic, Culture Media, Conditioned, Microglia, RNA, Small Interfering, Mice, Amyloid Precursor Protein Secretases, HEK293 Cells, Proteolysis, Primary Cell Culture, Matrix Metalloproteinase Inhibitors
About these checks
Registry, retraction, Cites and statistics results are computed, not judged, with one exception: a printed reference that no index lists is read once by a model before it counts as a citation error. Claims are extracted by a model and kept only when their quote appears verbatim in the text; each cited source is then checked, with a model’s help, for whether it says what the claim relies on. Those verdicts can be wrong — read the claim’s quote and the cited source before relying on one.
Statistics and arithmetic are recomputed, not judged.
Confidence bands are shown only for fields calibrated on our annotated test set. None is calibrated yet, so no band is shown.
What counts as a claim ›How we measure confidence ›How we check this ›
Are you an author, or do you see a problem with this page? Request a review
