

The DOI matches its Crossref record; 36 of the 36 references it cites were found in a registry or an index.
Opposite microglial activation stages upon loss of PGRN or TREM2 result in reduced cerebral glucose metabolism
Abstract
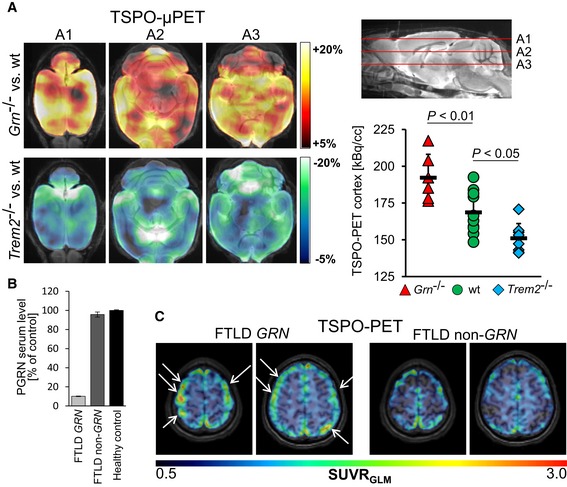
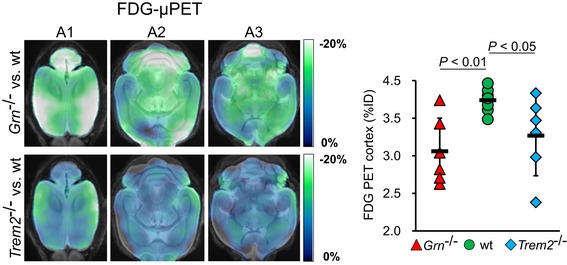
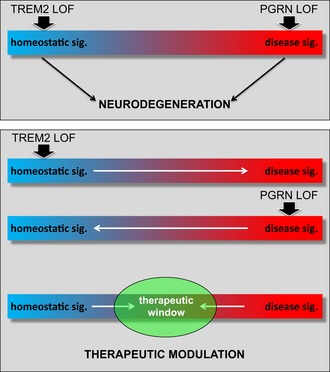
Microglia adopt numerous fates with homeostatic microglia (HM) and a microglial neurodegenerative phenotype (MGnD) representing two opposite ends. A number of variants in genes selectively expressed in microglia are associated with an increased risk for neurodegenerative diseases such as Alzheimer's disease (AD) and frontotemporal lobar degeneration (FTLD). Among these genes are progranulin ( GRN ) and the triggering receptor expressed on myeloid cells 2 ( TREM2 ). Both cause neurodegeneration by mechanisms involving loss of function. We have now isolated microglia from Grn −/− mice and compared their transcriptomes to those of Trem2 −/− mice . Surprisingly, while loss of Trem2 enhances the expression of genes associated with a homeostatic state, microglia derived from Grn −/− mice showed a reciprocal activation of the MGnD molecular signature and suppression of gene characteristic for HM. The opposite mRNA expression profiles are associated with divergent functional phenotypes. Although loss of TREM2 and progranulin resulted in opposite activation states and functional phenotypes of microglia, FDG (fluoro‐2‐deoxy‐ d ‐glucose)‐μPET of brain revealed reduced glucose metabolism in both conditions, suggesting that opposite microglial phenotypes result in similar wide spread brain dysfunction.
Overview
The claims and statistics of this paper haven’t been checked yet.
Run the check — free, no account needed. It reads the open-access text and checks the sources it cites.
Integrity signals
Registry
Cites
Statistics
Figures
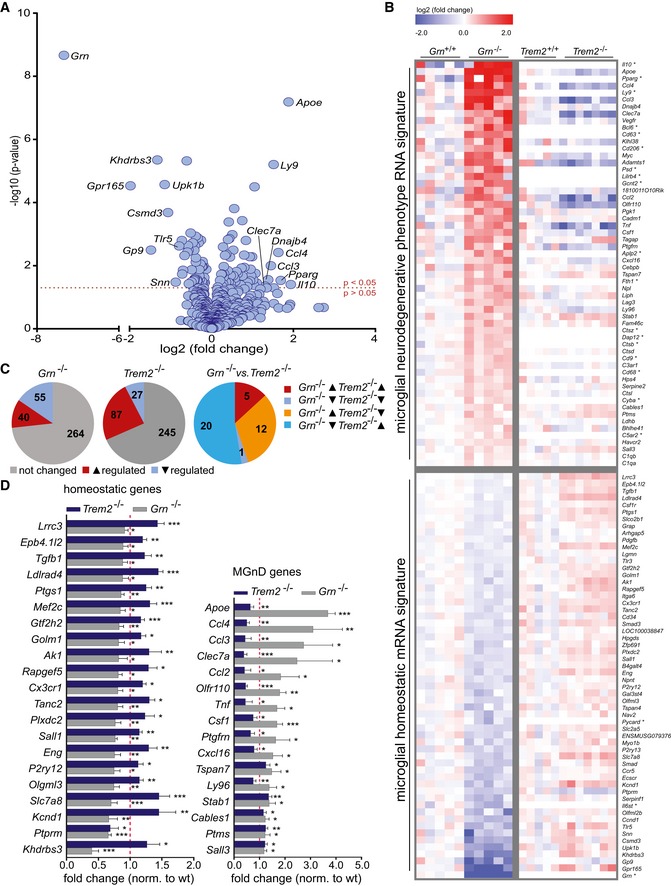
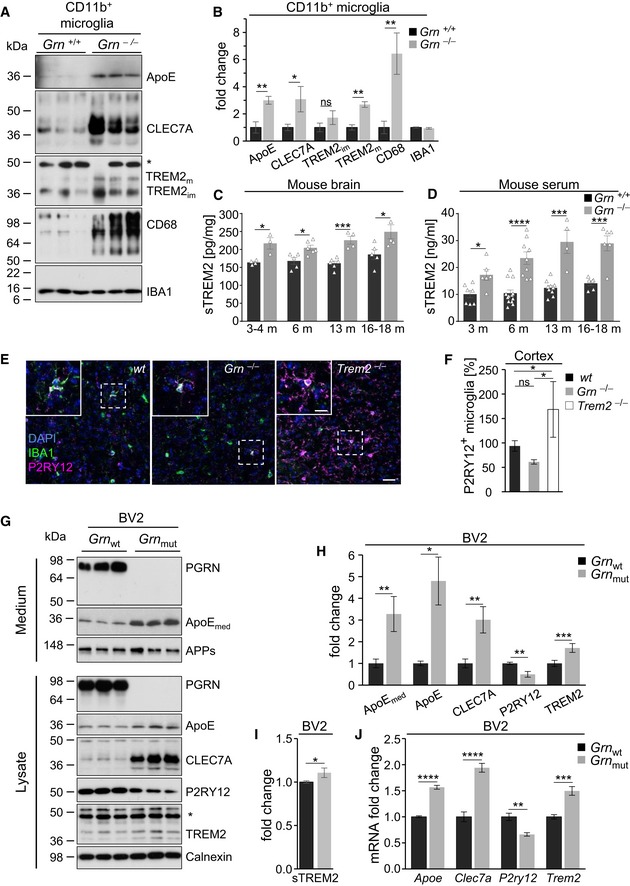
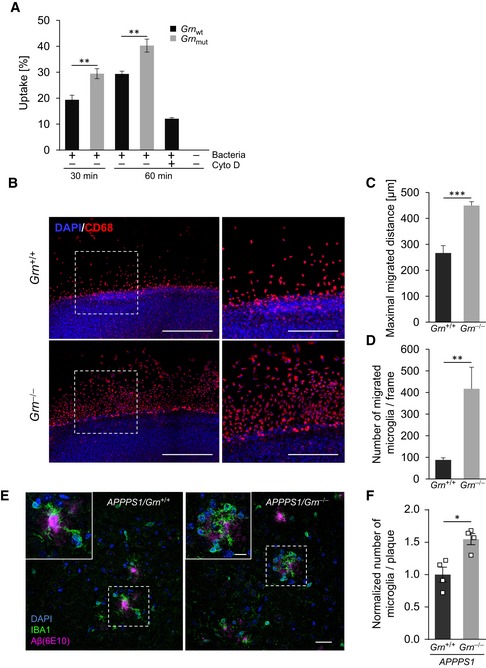
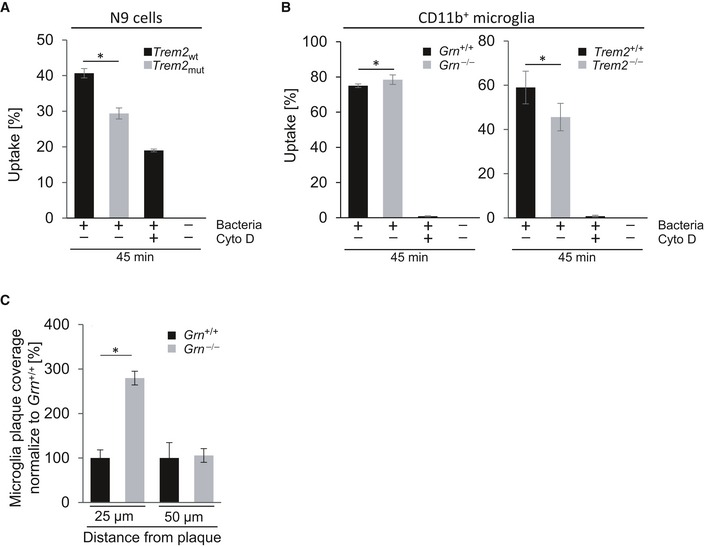
Verification
Claims the paper makes
The claims and statistics of this paper haven’t been checked yet.
Run the check — free, no account needed. It reads the open-access text and checks the sources it cites.
Claims other papers make about this one
Each is checked against this paper’s own text: does it say what the citing paper says it does?
The cited source says what the claim attributes to it.
In the citing paper
“Apoe is one of the most striking TREM2-dependent damage-associated microglia genes”
From TREM2 regulates microglial cholesterol metabolism upon chronic phagocytic challenge (2020) · cites this paper as Götzl et al., 2019
Self-check
Percentages, sums and reported differences re-computed from the paper’s own numbers.
The self-check needs the paper’s full text.
Citations
Cites
Genome engineering using the CRISPR-Cas9 system
Ran, F. A., Hsu, P. D., Wright, J., Agarwala, V., Scott, D. A., & Zhang, F. (2013) · Nature Protocols · doi:10.1038/nprot.2013.143 · Cited by 11,133
A Unique Microglia Type Associated with Restricting Development of Alzheimer’s Disease
Keren-Shaul, H., Spinrad, A., Weiner, A., Matcovitch-Natan, O., Dvir-Szternfeld, R., Ulland, T. K., David, E., Baruch, K., Lara-Astaiso, D., Toth, B., et al. (2017) · Cell · doi:10.1016/j.cell.2017.05.018 · Cited by 5,493
Krasemann, S., Madore, C., Cialic, R., Baufeld, C., Calcagno, N., El Fatimy, R., Beckers, L., O’Loughlin, E., Xu, Y., Fanek, Z., et al. (2017) · Immunity · doi:10.1016/j.immuni.2017.08.008 · Cited by 2,979
Self-citationVariant of TREM2 Associated with the Risk of Alzheimer's Disease
Jonsson, T., Stefansson, H., Steinberg, S., Jonsdottir, I., Jonsson, P. V., Snaedal, J., Bjornsson, S., Huttenlocher, J., Levey, A. I., Lah, J. J., et al. (2013) · New England Journal of Medicine · doi:10.1056/nejmoa1211103 · Cited by 2,558
Identification of a unique TGF-β–dependent molecular and functional signature in microglia
Butovsky, O., Jedrychowski, M. P., Moore, C. S., Cialic, R., Lanser, A. J., Gabriely, G., Koeglsperger, T., Dake, B., Wu, P. M., Doykan, C. E., et al. (2014) · Nature Neuroscience · doi:10.1038/nn.3599 · Cited by 2,543
Self-citationMutations in progranulin cause tau-negative frontotemporal dementia linked to chromosome 17
Baker, M., Mackenzie, I. R., Pickering-Brown, S. M., Gass, J., Rademakers, R., Lindholm, C., Snowden, J., Adamson, J., Sadovnick, A. D., Rollinson, S., et al. (2006) · Nature · doi:10.1038/nature05016 · Cited by 2,058
How neuroinflammation contributes to neurodegeneration
Ransohoff, R. M. (2016) · Science · doi:10.1126/science.aag2590 · Cited by 1,967 · cited 2×
“While for a long time researchers distinguished only two distinct stages of microglia, the M1 and the M2 phenotype, recent evidence strongly indicates that a multitude of functionally diverse microglial populations exists in a dynamic equilibrium (Ransohoff, 2016; Keren-Shaul et al, 2017; Krasemann et al, 2017).”
BackgroundTREM2 Maintains Microglial Metabolic Fitness in Alzheimer’s Disease
Ulland, T. K., Song, W. M., Huang, S. C.-C., Ulrich, J. D., Sergushichev, A., Beatty, W. L., Loboda, A. A., Zhou, Y., Cairns, N. J., Kambal, A., et al. (2017) · Cell · doi:10.1016/j.cell.2017.07.023 · Cited by 1,263 · cited 4×
“Reduced energy metabolism in Trem2 / mice is in line with previous observations (Kleinberger et al, 2017; Ulland et al, 2017).”
BackgroundResultInfluentialAn environment-dependent transcriptional network specifies human microglia identity
Gosselin, D., Skola, D., Coufal, N. G., Holtman, I. R., Schlachetzki, J. C. M., Sajti, E., Jaeger, B. N., O’Connor, C., Fitzpatrick, C., Pasillas, M. P., et al. (2017) · Science · doi:10.1126/science.aal3222 · Cited by 1,220
Aβ42‐driven cerebral amyloidosis in transgenic mice reveals early and robust pathology
Radde, R., Bolmont, T., Kaeser, S. A., Coomaraswamy, J., Lindau, D., Stoltze, L., Calhoun, M. E., Jäggi, F., Wolburg, H., Gengler, S., et al. (2006) · The EMBO Reports · doi:10.1038/sj.embor.7400784 · Cited by 986
Self-citation
Research works printed but not linked: 39
- Ahmed Z, Sheng H, Xu YF, Lin WL, Innes AE, Gass J, Yu X, Wuertzer CA, Hou H, Chiba S et al (2010) Accelerated lipofuscinosis and ubiquitination in granulin knockout mice suggest a role for progranulin in successful aging. Am J Pathol 177: 311–324 · DOI
- Albert NL, Unterrainer M, Fleischmann DF, Lindner S, Vettermann F, Brunegraf A, Vomacka L, Brendel M, Wenter V, Wetzel C et al (2017) TSPO PET for glioma imaging using the novel ligand (18)F‐GE‐180: first results in patients with glioblastoma. Eur J Nucl Med Mol Imaging 44: 2230–2238 · DOI
- Bateman A, Belcourt D, Bennett H, Lazure C, Solomon S (1990) Granulins, a novel class of peptide from leukocytes. Biochem Biophys Res Commun 173: 1161–1168 · DOI
- Beel S, Moisse M, Damme M, De Muynck L, Robberecht W, Van Den Bosch L, Saftig P, Van Damme P (2017) Progranulin functions as a cathepsin D chaperone to stimulate axonal outgrowth in vivo. Hum Mol Genet 26: 2850–2863 · DOI · Paper page
- Belcourt DR, Lazure C, Bennett HP (1993) Isolation and primary structure of the three major forms of granulin‐like peptides from hematopoietic tissues of a teleost fish (Cyprinus carpio). J Biol Chem 268: 9230–9237 · DOI
- Bocchini V, Mazzolla R, Barluzzi R, Blasi E, Sick P, Kettenmann H (1992) An immortalized cell line expresses properties of activated microglial cells. J Neurosci Res 31: 616–621 · DOI
- Borroni B, Ferrari F, Galimberti D, Nacmias B, Barone C, Bagnoli S, Fenoglio C, Piaceri I, Archetti S, Bonvicini C et al (2014) Heterozygous TREM2 mutations in frontotemporal dementia. Neurobiol Aging 35: 934 e937–910 · DOI · Paper page
- Brendel M, Probst F, Jaworska A, Overhoff F, Korzhova V, Albert NL, Beck R, Lindner S, Gildehaus FJ, Baumann K et al (2016) Glial activation and glucose metabolism in a transgenic amyloid mouse model: a triple‐tracer PET study. J Nucl Med 57: 954–960 · DOI
- Capell A, Liebscher S, Fellerer K, Brouwers N, Willem M, Lammich S, Gijselinck I, Bittner T, Carlson AM, Sasse F et al (2011) Rescue of progranulin deficiency associated with frontotemporal lobar degeneration by alkalizing reagents and inhibition of vacuolar ATPase. J Neurosci 31: 1885–1894 · DOI
- Cenik B, Sephton CF, Kutluk Cenik B, Herz J, Yu G (2012) Progranulin: a proteolytically processed protein at the crossroads of inflammation and neurodegeneration. J Biol Chem 287: 32298–32306 · DOI
- Chang MC, Srinivasan K, Friedman BA, Suto E, Modrusan Z, Lee WP, Kaminker JS, Hansen DV, Sheng M (2017) Progranulin deficiency causes impairment of autophagy and TDP‐43 accumulation. J Exp Med 214: 2611–2628 · DOI · Paper page
- Cruts M, Gijselinck I, van der Zee J, Engelborghs S, Wils H, Pirici D, Rademakers R, Vandenberghe R, Dermaut B, Martin JJ et al (2006) Null mutations in progranulin cause ubiquitin‐positive frontotemporal dementia linked to chromosome 17q21. Nature 442: 920–924 · DOI · Paper page
- Cruts M, Van Broeckhoven C (2008) Loss of progranulin function in frontotemporal lobar degeneration. Trends Genet 24: 186–194 · DOI
- Cuyvers E, Bettens K, Philtjens S, Van Langenhove T, Gijselinck I, van der Zee J, Engelborghs S, Vandenbulcke M, Van Dongen J, Geerts N et al (2014) Investigating the role of rare heterozygous TREM2 variants in Alzheimer's disease and frontotemporal dementia. Neurobiol Aging 35: 726 e711–729 · DOI
- Deussing M, Blume T, Vomacka L, Mahler C, Focke C, Todica A, Unterrainer M, Albert NL, Lindner S, von Ungern‐Sternberg B et al (2017) Coupling between physiological TSPO expression in brain and myocardium allows stabilization of late‐phase cerebral [(18)F]GE180 PET quantification. NeuroImage 165: 83–91 · DOI
- Gotzl JK, Mori K, Damme M, Fellerer K, Tahirovic S, Kleinberger G, Janssens J, van der Zee J, Lang CM, Kremmer E et al (2014) Common pathobiochemical hallmarks of progranulin‐associated frontotemporal lobar degeneration and neuronal ceroid lipofuscinosis. Acta Neuropathol 127: 845–860
- Gotzl JK, Lang CM, Haass C, Capell A (2016) Impaired protein degradation in FTLD and related disorders. Ageing Res Rev 32: 122–139 · DOI
- Gotzl JK, Colombo AV, Fellerer K, Reifschneider A, Werner G, Tahirovic S, Haass C, Capell A (2018) Early lysosomal maturation deficits in microglia triggers enhanced lysosomal activity in other brain cells of progranulin knockout mice. Mol Neurodegener 13: 48 · DOI
- Hu F, Padukkavidana T, Vaegter CB, Brady OA, Zheng Y, Mackenzie IR, Feldman HH, Nykjaer A, Strittmatter SM (2010) Sortilin‐mediated endocytosis determines levels of the frontotemporal dementia protein, progranulin. Neuron 68: 654–667 · DOI · Paper page
- Jonsson T, Stefansson K (2013) TREM2 and neurodegenerative disease. N Engl J Med 369: 1568–1569
- Kayasuga Y, Chiba S, Suzuki M, Kikusui T, Matsuwaki T, Yamanouchi K, Kotaki H, Horai R, Iwakura Y, Nishihara M (2007) Alteration of behavioural phenotype in mice by targeted disruption of the progranulin gene. Behav Brain Res 185: 110–118 · DOI
- Kleinberger G, Brendel M, Mracsko E, Wefers B, Groeneweg L, Xiang X, Focke C, Deussing M, Suarez‐Calvet M, Mazaheri F et al (2017) The FTD‐like syndrome causing TREM2 T66M mutation impairs microglia function, brain perfusion, and glucose metabolism. EMBO J 36: 1837–1853 · DOI
- Martens LH, Zhang J, Barmada SJ, Zhou P, Kamiya S, Sun B, Min SW, Gan L, Finkbeiner S, Huang EJ et al (2012) Progranulin deficiency promotes neuroinflammation and neuron loss following toxin‐induced injury. J Clin Invest 122: 3955–3959 · DOI
- Mizrahi R, Rusjan PM, Kennedy J, Pollock B, Mulsant B, Suridjan I, De Luca V, Wilson AA, Houle S (2012) Translocator protein (18 kDa) polymorphism (rs6971) explains in‐vivo brain binding affinity of the PET radioligand [(18)F]‐FEPPA. J Cereb Blood Flow Metab 32: 968–972 · DOI · Paper page
- Overhoff F, Brendel M, Jaworska A, Korzhova V, Delker A, Probst F, Focke C, Gildehaus FJ, Carlsen J, Baumann K et al (2016) Automated spatial brain normalization and hindbrain white matter reference tissue give improved [(18)F]‐florbetaben pet quantitation in Alzheimer's model mice. Front Neurosci 10: 45 · DOI
- Owen DR, Yeo AJ, Gunn RN, Song K, Wadsworth G, Lewis A, Rhodes C, Pulford DJ, Bennacef I, Parker CA et al (2012) An 18‐kDa translocator protein (TSPO) polymorphism explains differences in binding affinity of the PET radioligand PBR28. J Cereb Blood Flow Metab 32: 1–5 · DOI · Paper page
- Rominger A, Brendel M, Burgold S, Keppler K, Baumann K, Xiong G, Mille E, Gildehaus FJ, Carlsen J, Schlichtiger J et al (2013) Longitudinal assessment of cerebral beta‐amyloid deposition in mice overexpressing Swedish mutant beta‐amyloid precursor protein using 18F‐florbetaben PET. J Nucl Med 54: 1127–1134 · DOI
- Schlepckow K, Kleinberger G, Fukumori A, Feederle R, Lichtenthaler SF, Steiner H, Haass C (2017) An Alzheimer‐associated TREM2 variant occurs at the ADAM cleavage site and affects shedding and phagocytic function. EMBO Mol Med 9: 1356–1365 · DOI
- Shoyab M, McDonald VL, Byles C, Todaro GJ, Plowman GD (1990) Epithelins 1 and 2: isolation and characterization of two cysteine‐rich growth‐modulating proteins. Proc Natl Acad Sci USA 87: 7912–7916 · DOI
- Takahashi H, Klein ZA, Bhagat SM, Kaufman AC, Kostylev MA, Ikezu T, Strittmatter SM, Alzheimer's Disease Neuroimaging I (2017) Opposing effects of progranulin deficiency on amyloid and tau pathologies via microglial TYROBP network. Acta Neuropathol 133: 785–807 · DOI
- Tanaka Y, Matsuwaki T, Yamanouchi K, Nishihara M (2013a) Exacerbated inflammatory responses related to activated microglia after traumatic brain injury in progranulin‐deficient mice. Neuroscience 231: 49–60 · DOI
- Tanaka Y, Matsuwaki T, Yamanouchi K, Nishihara M (2013b) Increased lysosomal biogenesis in activated microglia and exacerbated neuronal damage after traumatic brain injury in progranulin‐deficient mice. Neuroscience 250: 8–19 · DOI
- Turnbull IR, Gilfillan S, Cella M, Aoshi T, Miller M, Piccio L, Hernandez M, Colonna M (2006) Cutting edge: TREM‐2 attenuates macrophage activation. J Immunol 177: 3520–3524 · DOI · Paper page
- Van Damme P, Van Hoecke A, Lambrechts D, Vanacker P, Bogaert E, van Swieten J, Carmeliet P, Van Den Bosch L, Robberecht W (2008) Progranulin functions as a neurotrophic factor to regulate neurite outgrowth and enhance neuronal survival. J Cell Biol 181: 37–41 · DOI
- Wang Y, Cella M, Mallinson K, Ulrich JD, Young KL, Robinette ML, Gilfillan S, Krishnan GM, Sudhakar S, Zinselmeyer BH et al (2015) TREM2 lipid sensing sustains the microglial response in an Alzheimer's disease model. Cell 160: 1061–1071 · DOI · Paper page
- Wils H, Kleinberger G, Pereson S, Janssens J, Capell A, Van Dam D, Cuijt I, Joris G, De Deyn PP, Haass C et al (2012) Cellular ageing, increased mortality and FTLD‐TDP‐associated neuropathology in progranulin knockout mice. J Pathol 228: 67–76 · DOI
- Zhang N, Yang N, Chen Q, Qiu F, Li X (2014) Upregulated expression level of the growth factor, progranulin, is associated with the development of primary Sjogren's syndrome. Exp Ther Med 8: 1643–1647 · DOI
- Zhou X, Sun L, Bastos de Oliveira F, Qi X, Brown WJ, Smolka MB, Sun Y, Hu F (2015) Prosaposin facilitates sortilin‐independent lysosomal trafficking of progranulin. J Cell Biol 210: 991–1002 · DOI
- Zhou X, Sun L, Bracko O, Choi JW, Jia Y, Nana AL, Brady OA, Hernandez JCC, Nishimura N, Seeley WW et al (2017) Impaired prosaposin lysosomal trafficking in frontotemporal lobar degeneration due to progranulin mutations. Nat Commun 8: 15277 · DOI
Cited by
Sorted by citations
Johnson, E. C. B., Dammer, E. B., Duong, D. M., Ping, L., Zhou, M., Yin, L., Higginbotham, L. A., Guajardo, A., White, B., Troncoso, J. C., et al. (2020) · Nature Medicine · doi:10.1038/s41591-020-0815-6 · Cited by 1,001
TREM2 regulates microglial cholesterol metabolism upon chronic phagocytic challenge
Nugent, A. A., Lin, K., van Lengerich, B., Lianoglou, S., Przybyla, L., Davis, S. S., Llapashtica, C., Wang, J., Kim, D. J., Xia, D., et al. (2020) · Neuron · doi:10.1016/j.neuron.2019.12.007 · Cited by 745
Microglia: Agents of the CNS Pro-Inflammatory Response
Rodríguez-Gómez, J. A., Kavanagh, E., Engskog-Vlachos, P., Engskog, M. K. R., Herrera, A. J., Espinosa-Oliva, A. M., Joseph, B., Hajji, N., Venero, J. L., & Burguillos, M. A. (2020) · Cells · doi:10.3390/cells9071717 · Cited by 365
Enhancing protective microglial activities with a dual function TREM2 antibody to the stalk region
Schlepckow, K., Monroe, K. M., Kleinberger, G., Cantuti‐Castelvetri, L., Parhizkar, S., Xia, D., Willem, M., Werner, G., Pettkus, N., Brunner, B., et al. (2020) · EMBO Molecular Medicine · doi:10.15252/emmm.201911227 · Cited by 324
Self-citationLogan, T., Simon, M. J., Rana, A., Cherf, G. M., Srivastava, A., Davis, S. S., Low, R. L. Y., Chiu, C.-L., Fang, M., Huang, F., et al. (2021) · Cell · doi:10.1016/j.cell.2021.08.002 · Cited by 233
TREM2 dependent and independent functions of microglia in Alzheimer’s disease
Hou, J., Chen, Y., Grajales-Reyes, G., & Colonna, M. (2022) · Molecular Neurodegeneration · doi:10.1186/s13024-022-00588-y · Cited by 191
A multi-pronged human microglia response to Alzheimer’s disease Aβ pathology
Mancuso, R., Fattorelli, N., Martinez-Muriana, A., Davis, E., Wolfs, L., Van Den Daele, J., Geric, I., Preman, P., Serneels, L., Poovathingal, S., et al. (2022) · doi:10.1101/2022.07.07.499139 · Cited by 169
Ewers, M., Biechele, G., Suárez‐Calvet, M., Sacher, C., Blume, T., Morenas‐Rodriguez, E., Deming, Y., Piccio, L., Cruchaga, C., Kleinberger, G., et al. (2020) · EMBO Molecular Medicine · doi:10.15252/emmm.202012308 · Cited by 133
Self-citationReifschneider, A., Robinson, S., van Lengerich, B., Gnörich, J., Logan, T., Heindl, S., Vogt, M. A., Weidinger, E., Riedl, L., Wind, K., et al. (2022) · The EMBO Journal · doi:10.15252/embj.2021109108 · Cited by 89
Self-citationThe Alzheimer’s disease-associated protective Plcγ2-P522R variant promotes immune functions
Takalo, M., Wittrahm, R., Wefers, B., Parhizkar, S., Jokivarsi, K., Kuulasmaa, T., Mäkinen, P., Martiskainen, H., Wurst, W., Xiang, X., et al. (2020) · Molecular Neurodegeneration · doi:10.1186/s13024-020-00402-7 · Cited by 83
Self-citationMicroglia gone awry: linking immunometabolism to neurodegeneration
Afridi, R., Lee, W.-H., & Suk, K. (2020) · Frontiers in Cellular Neuroscience · doi:10.3389/fncel.2020.00246 · Cited by 64
INPP5D modulates TREM2 loss-of-function phenotypes in a β-amyloidosis mouse model
Iguchi, A., Takatori, S., Kimura, S., Muneto, H., Wang, K., Etani, H., Ito, G., Sato, H., Hori, Y., Sasaki, J., et al. (2023) · iScience · doi:10.1016/j.isci.2023.106375 · Cited by 37
Pankiewicz, J. E., Lizińczyk, A. M., Franco, L. A., Diaz, J. R., Martá-Ariza, M., & Sadowski, M. J. (2021) · Acta Neuropathologica Communications · doi:10.1186/s40478-021-01261-z · Cited by 15
Metadata
- Authors
- Götzl, J. K., Brendel, M., Werner, G., Parhizkar, S., Sebastian Monasor, L., Kleinberger, G., Colombo, A., Deussing, M., Wagner, M., Winkelmann, J., Diehl‐Schmid, J., Levin, J., Fellerer, K., Reifschneider, A., Bultmann, S., Bartenstein, P., Rominger, A., Tahirovic, S., Smith, S. T., Madore, C., Butovsky, O., Capell, A., & Haass, C.
- Venue
- EMBO Molecular Medicine
- Published
- 2019-05-23
- Volume
- 11
- Issue
- 6
- ISSN
- 1757-4676
- 1757-4684
- PMC
- PMC6554672
- Cited by
- 118
- References
- 36
- Language
- en
- Funders
- HHS|NIH|National Institute of Neurological Disorders and Stroke (R01 NS088137, R21NS104609, R21NS101673)
- Nancy Davis Foundation for Multiple Sclerosis Faculty Award
- Cure Alzheimer's Fund
- Amyotrophic Lateral Sclerosis Association
- Hans and Ilse Breuer Foundation
- Bundesministerium für Bildung und Forschung (FTLDc 01GI1007A)
- HHS|National Institutes of Health (NEY (R01 EY027921))
- HHS|NIH|National Institute on Aging (R01 AG051812, R01 AG054672)
- Deutsche Forschungsgemeinschaft (EXC 1010 SyNergy, HA1737/16‐1, BR4580/1‐1, RO5194/1‐1)
- NOMIS Foundation
- National Multiple Sclerosis Society (5092A1)
- Sanofi
About these checks
Registry, retraction, Cites and statistics results are computed, not judged, with one exception: a printed reference that no index lists is read once by a model before it counts as a citation error. Claims are extracted by a model and kept only when their quote appears verbatim in the text; each cited source is then checked, with a model’s help, for whether it says what the claim relies on. Those verdicts can be wrong — read the claim’s quote and the cited source before relying on one.
Statistics and arithmetic are recomputed, not judged.
Confidence bands are shown only for fields calibrated on our annotated test set. None is calibrated yet, so no band is shown.
What counts as a claim ›How we measure confidence ›How we check this ›
Are you an author, or do you see a problem with this page? Request a review
