Cited by 291Alzheimer's disease research and treatmentsNeuroinflammation and Neurodegeneration MechanismsDementia and Cognitive Impairment Research

The DOI matches its Crossref record; 74 of the 74 references it cites were found in a registry or an index.

Novel Alzheimer risk genes determine the microglia response to amyloid-β but not to TAU pathology

Open access

Published version of a preprint

Abstract

Polygenic risk scores have identified that genetic variants without genome‐wide significance still add to the genetic risk of developing Alzheimer's disease (AD). Whether and how subthreshold risk loci translate into relevant disease pathways is unknown. We investigate here the involvement of AD risk variants in the transcriptional responses of two mouse models: APPswe/PS1 L166P and Thy‐TAU22. A unique gene expression module, highly enriched for AD risk genes, is specifically responsive to Aβ but not TAU pathology. We identify in this module 7 established AD risk genes ( APOE , CLU , INPP5D , CD33, PLCG2 , SPI1, and FCER1G ) and 11 AD GWAS genes below the genome‐wide significance threshold ( GPC2, TREML2, SYK, GRN, SLC2A5, SAMSN1, PYDC1, HEXB, RRBP1, LYN, and BLNK), that become significantly upregulated when exposed to Aβ. Single microglia sequencing confirms that Aβ, not TAU, pathology induces marked transcriptional changes in microglia, including increased proportions of activated microglia. We conclude that genetic risk of AD functionally translates into different microglia pathway responses to Aβ pathology, placing AD genetic risk downstream of the amyloid pathway but upstream of TAU pathology.

Overview

The claims and statistics of this paper haven’t been checked yet.

Run the check — free, no account needed. It reads the open-access text and checks the sources it cites.

A few free checks a day · papers already verified open instantly · results are public

Integrity signals

Registry

Crossref · 10.15252/emmm.201910606

Cites

74 of 74 references verified0 citation errors · 0 not checkable

Statistics

Figures

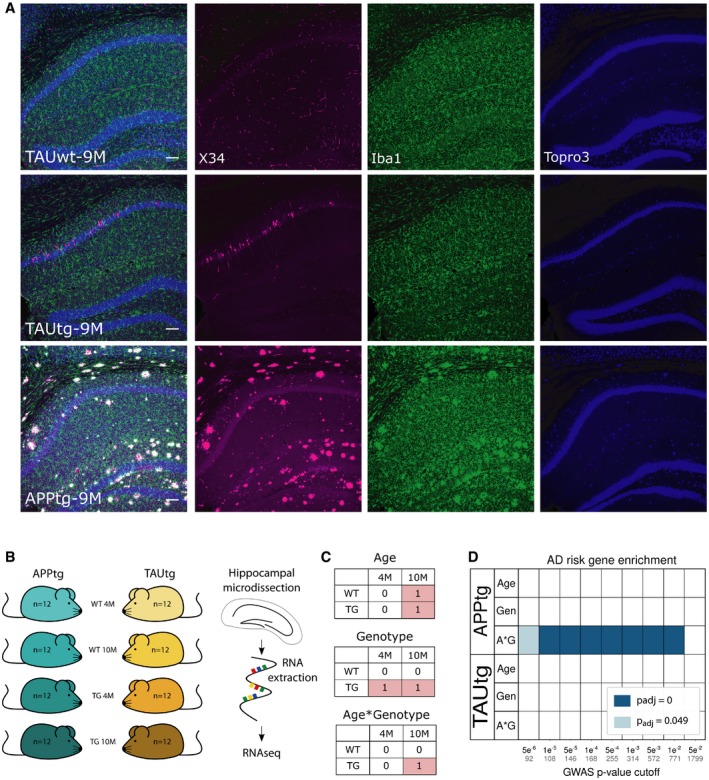
Figure 1 Enrichment of AD risk genes in APPtg and not in TAUtg mice AVisualization of the pathology load in TAUwt, TAUtg, and APPtg mice at 9M of age. Immunofluorescent staining for X34 (a fluorescent derivative of Congo Red; in magenta), Iba1 (microglia; in green), and TO‐PRO‐3 (nuclei; in blue) has been pseudocolored. Scale bar = 100 μm.BExperimental design for mRNA sequencing using n = 12 per experimental group.CExplanation of the 2 × 2 linear model, where those cells labeled with 1 are compared to the cells labeled with 0. In the age comparison, mRNA expression in all 10‐month‐old (10M) mice is compared to all 4‐month‐old (4M) mice. In the genotype comparison, mRNA expression in all transgenic (TG) mice is compared to all wild‐type (WT) mice. In the age*genotype comparison, we assess which transcripts are differentially expressed in the 10M TG mice compared to all other groups.DBased on Marioni et al (2018), various sets of AD GWAS risk genes were created using different cut‐off P‐values indicated on the x‐axis (number of genes within each set is written in gray). Enrichment for AD risk genes was assessed among the different statistical comparisons for APPtg and TAUtg mice (A*G: age*genotype, Gen: genotype), using gene set enrichment analysis (GSEA, Subramanian et al, 2005). Colors represent the Benjamini–Yekutieli‐adjusted P‐value for the enrichment; blank means no significant enrichment.
Figure 1 Enrichment of AD risk genes in APPtg and not in TAUtg mice AVisualization of the pathology load in TAUwt, TAUtg, and APPtg mice at 9M of age. Immunofluorescent staining for X34 (a fluorescent derivative of Congo Red; in magenta), Iba1 (microglia; in green), and TO‐PRO‐3 (nuclei; in blue) has been pseudocolored. Scale bar = 100 μm.BExperimental design for mRNA sequencing using n = 12 per experimental group.CExplanation of the 2 × 2 linear model, where those cells labeled with 1 are compared to the cells labeled with 0. In the age comparison, mRNA expression in all 10‐month‐old (10M) mice is compared to all 4‐month‐old (4M) mice. In the genotype comparison, mRNA expression in all transgenic (TG) mice is compared to all wild‐type (WT) mice. In the age*genotype comparison, we assess which transcripts are differentially expressed in the 10M TG mice compared to all other groups.DBased on Marioni et al (2018), various sets of AD GWAS risk genes were created using different cut‐off P‐values indicated on the x‐axis (number of genes within each set is written in gray). Enrichment for AD risk genes was assessed among the different statistical comparisons for APPtg and TAUtg mice (A*G: age*genotype, Gen: genotype), using gene set enrichment analysis (GSEA, Subramanian et al, 2005). Colors represent the Benjamini–Yekutieli‐adjusted P‐value for the enrichment; blank means no significant enrichment.CC BY · PubMed Central
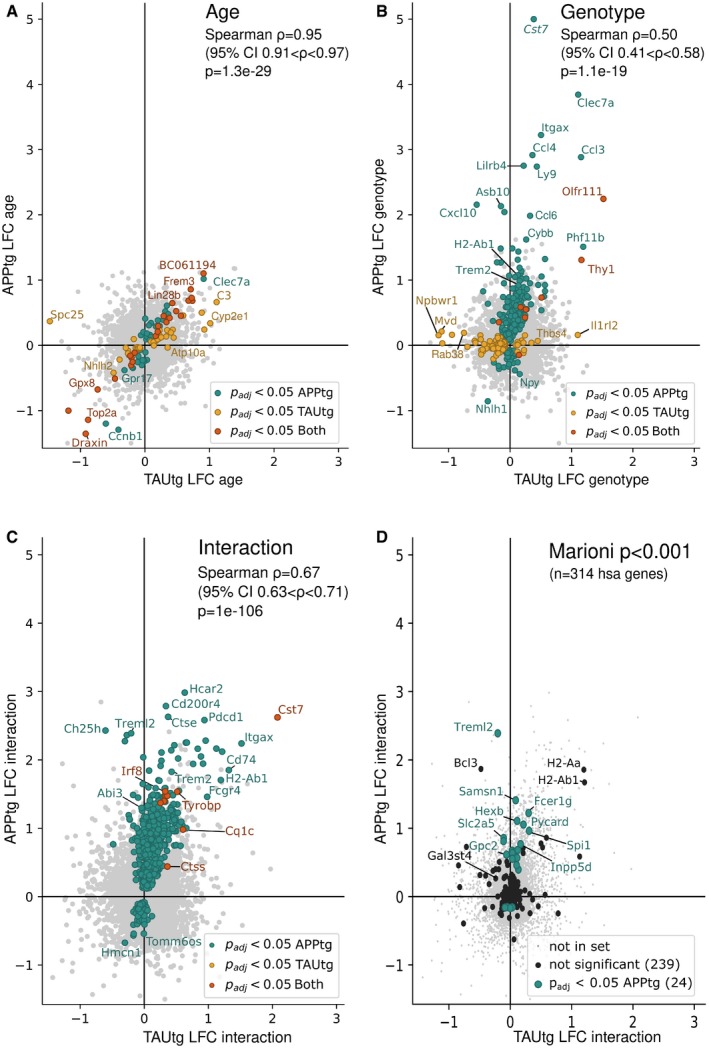
Figure 2 Changes in gene expression exacerbate with aging in APPtg but not in TAUtg mice Log2 fold change (LFC) in TAUtg (x‐axis) and APPtg mice (y‐axis) after differential expression analysis. Upregulated genes are on the right part (TAUtg mice) or upper part (APPtg mice) of the graph; downregulated genes are on the left part (TAUtg) or lower part (APPtg) of the graph. Colored dots represent significantly differentially expressed genes (Benjamini–Yekutieli‐adjusted P‐values (P adj) < 0.05) for APPtg (green dots), TAUtg (yellow dots), or for both (red dots). Spearman correlation assesses the correlation between APPtg and TAUtg mice when ranking genes that are significantly differentially expressed in either APPtg or TAUtg mice from most up‐ to most downregulated on a combined score of LFC and P adj (i.e., signed log10(P‐value), where the sign is determined by the LFC). AGenes differentially expressed as a function of age, i.e., 4M versus 10M, independently of genotype. Thus, genes with a positive LFC are more highly expressed in 10M mice over 4M mice.BGenes differentially expressed due to genotype, i.e., WT versus TG, independently of age. Thus, genes with a positive LFC are more highly expressed in TG mice than in WT mice.CGenes differentially expressed in the age*genotype interaction comparison, i.e., comparing the TG‐10M mice to all other experimental groups (see Fig 1C). Thus, genes with a positive LFC are more highly expressed in the TG‐10M mice compared to all other experimental groups.DDepicts the 314 Marioni‐based GWAS genes at P < 0.001 onto the LFC/LFC plot of the age*genotype comparison (panel C). Green dots are significantly changed.
Figure 2 Changes in gene expression exacerbate with aging in APPtg but not in TAUtg mice Log2 fold change (LFC) in TAUtg (x‐axis) and APPtg mice (y‐axis) after differential expression analysis. Upregulated genes are on the right part (TAUtg mice) or upper part (APPtg mice) of the graph; downregulated genes are on the left part (TAUtg) or lower part (APPtg) of the graph. Colored dots represent significantly differentially expressed genes (Benjamini–Yekutieli‐adjusted P‐values (P adj) < 0.05) for APPtg (green dots), TAUtg (yellow dots), or for both (red dots). Spearman correlation assesses the correlation between APPtg and TAUtg mice when ranking genes that are significantly differentially expressed in either APPtg or TAUtg mice from most up‐ to most downregulated on a combined score of LFC and P adj (i.e., signed log10(P‐value), where the sign is determined by the LFC). AGenes differentially expressed as a function of age, i.e., 4M versus 10M, independently of genotype. Thus, genes with a positive LFC are more highly expressed in 10M mice over 4M mice.BGenes differentially expressed due to genotype, i.e., WT versus TG, independently of age. Thus, genes with a positive LFC are more highly expressed in TG mice than in WT mice.CGenes differentially expressed in the age*genotype interaction comparison, i.e., comparing the TG‐10M mice to all other experimental groups (see Fig 1C). Thus, genes with a positive LFC are more highly expressed in the TG‐10M mice compared to all other experimental groups.DDepicts the 314 Marioni‐based GWAS genes at P < 0.001 onto the LFC/LFC plot of the age*genotype comparison (panel C). Green dots are significantly changed.CC BY · PubMed Central
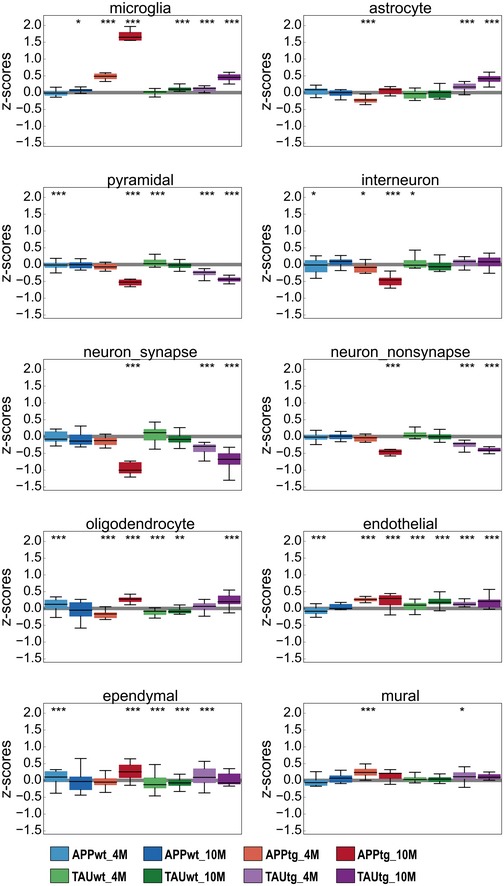
Figure EV1 APPtg and TAUtg mice demonstrate divergent neuronal and glial responses to increasing pathology load Z‐score distribution per experimental group for all genes in cell type‐specific gene sets as defined by Zeisel et al (2015) and SynaptomeDB (Pirooznia et al, 2012). Boxplots: center line, median; box limits, 25th–75th quartiles; and whiskers, 1.5× interquartile range. Empirical P‐values are Bonferroni‐adjusted (P bonf) and indicate significant shift in z‐score distribution (see Materials and Methods). ***P bonf < 0.001, **P bonf < 0.01, *P bonf < 0.05.
Figure EV1 APPtg and TAUtg mice demonstrate divergent neuronal and glial responses to increasing pathology load Z‐score distribution per experimental group for all genes in cell type‐specific gene sets as defined by Zeisel et al (2015) and SynaptomeDB (Pirooznia et al, 2012). Boxplots: center line, median; box limits, 25th–75th quartiles; and whiskers, 1.5× interquartile range. Empirical P‐values are Bonferroni‐adjusted (P bonf) and indicate significant shift in z‐score distribution (see Materials and Methods). ***P bonf < 0.001, **P bonf < 0.01, *P bonf < 0.05.CC BY · PubMed Central
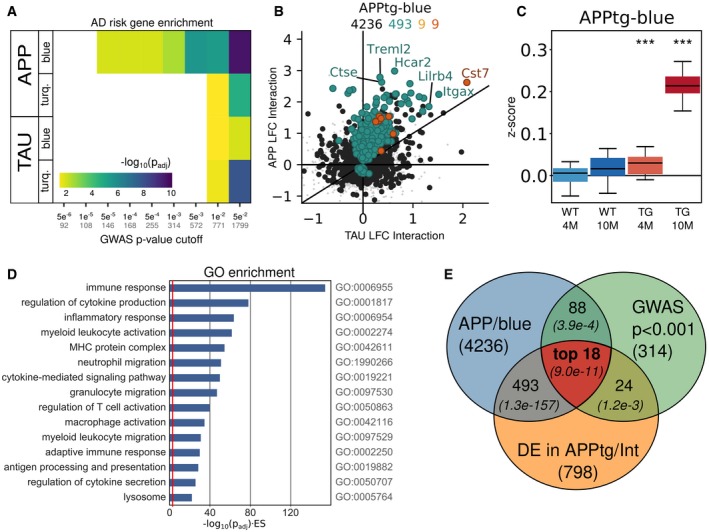
Figure 3 The APPtg‐Blue module represents a coordinated transcriptional response only present in APPtg mice AGene set enrichment analysis using Fisher's exact test of GWAS genes from Marioni et al (2018) at different P‐value cut‐offs among the WGCNA‐derived modules in APPtg or TAUtg mice (see also Appendix Figs S2 and S3). Colors represent −log10 (Benjamini–Yekutieli‐adjusted P‐value) for the enrichment. Numbers on the x‐axis: black = P‐value cut‐off; gray = size of GWAS gene set.BLog2 fold change (LFC) in TAUtg (x‐axis) and APPtg mice (y‐axis) after differential expression analysis, assessing the effects of age*genotype interaction. Color code for dots/numbers: gray = genes in hippocampus (n = 15,824); black = genes in APPtg‐Blue (n = 4,236); green = genes significantly differentially expressed in APPtg mice (n = 493); yellow = significantly differentially expressed genes in TAUtg mice (n = 9); and red = significantly differentially expressed genes in both (n = 9).C Z‐score distribution per experimental group for all genes within the APPtg‐Blue module. Boxplots: center line, median; box limits, 25th–75th quartiles; and whiskers, 1.5× interquartile range. Empirical P‐values are Bonferroni‐adjusted (***P bonf < 0.001) and indicate significant shift in z‐score distribution (see Materials and Methods).DGene Ontology (GO) enrichment for genes within the APPtg‐Blue module. The x‐axis depicts −log10(FDR‐adjusted P‐value) multiplied by the enrichment score (ES), where the red line represents an −log10(0.049)*(ES = 1).EThe “top 18” GWAS genes are prioritized by finding the intersection of genes within the APPtg‐Blue module (n = 4,236), AD GWAS genes with P < 0.001 in Marioni et al (2018) (n = 314), and significantly differentially expressed genes in the age*genotype comparison of APPtg mice (n = 798), using the SuperExactTest (Wang et al, 2015). Numbers in italics are the Benjamini–Yekutieli‐adjusted P‐values for finding overlap between the different gene sets (see Appendix Table S3).
Figure 3 The APPtg‐Blue module represents a coordinated transcriptional response only present in APPtg mice AGene set enrichment analysis using Fisher's exact test of GWAS genes from Marioni et al (2018) at different P‐value cut‐offs among the WGCNA‐derived modules in APPtg or TAUtg mice (see also Appendix Figs S2 and S3). Colors represent −log10 (Benjamini–Yekutieli‐adjusted P‐value) for the enrichment. Numbers on the x‐axis: black = P‐value cut‐off; gray = size of GWAS gene set.BLog2 fold change (LFC) in TAUtg (x‐axis) and APPtg mice (y‐axis) after differential expression analysis, assessing the effects of age*genotype interaction. Color code for dots/numbers: gray = genes in hippocampus (n = 15,824); black = genes in APPtg‐Blue (n = 4,236); green = genes significantly differentially expressed in APPtg mice (n = 493); yellow = significantly differentially expressed genes in TAUtg mice (n = 9); and red = significantly differentially expressed genes in both (n = 9).C Z‐score distribution per experimental group for all genes within the APPtg‐Blue module. Boxplots: center line, median; box limits, 25th–75th quartiles; and whiskers, 1.5× interquartile range. Empirical P‐values are Bonferroni‐adjusted (***P bonf < 0.001) and indicate significant shift in z‐score distribution (see Materials and Methods).DGene Ontology (GO) enrichment for genes within the APPtg‐Blue module. The x‐axis depicts −log10(FDR‐adjusted P‐value) multiplied by the enrichment score (ES), where the red line represents an −log10(0.049)*(ES = 1).EThe “top 18” GWAS genes are prioritized by finding the intersection of genes within the APPtg‐Blue module (n = 4,236), AD GWAS genes with P < 0.001 in Marioni et al (2018) (n = 314), and significantly differentially expressed genes in the age*genotype comparison of APPtg mice (n = 798), using the SuperExactTest (Wang et al, 2015). Numbers in italics are the Benjamini–Yekutieli‐adjusted P‐values for finding overlap between the different gene sets (see Appendix Table S3).CC BY · PubMed Central
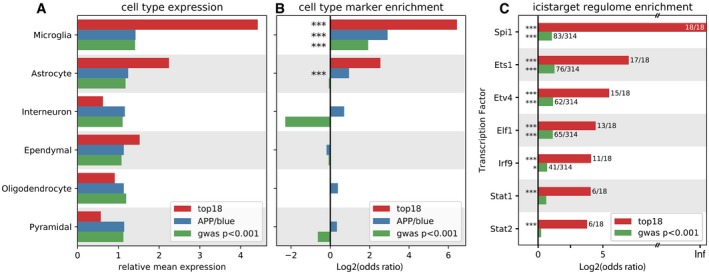
Figure 4 “Top 18” genes are expressed in microglia and regulated by Spi1 AFor each gene set (top 18, APPtg‐Blue, and GWAS P < 0.001, Marioni et al (2018)), their expression was assessed in the different cell types listed on the left, based on the expression matrix as published by Zeisel et al (2015). As can be viewed, the top 18 genes are highly expressed in microglia.BBased on the marker genes for each cell type as determined by Zeisel et al (2015), enrichment of these marker genes was assessed among the three gene sets (top 18, APPtg‐Blue, and GWAS P < 0.001, Marioni et al, 2018). Significant enrichment of microglial marker genes can be observed for all three gene sets, while the APPtg‐Blue module is also enriched for astrocyte marker genes.CEnrichment of transcription factor targets among the “top 18” genes (red bars) and the GWAS genes with P < 0.001 (green bars), using i‐CisTarget (Imrichová et al, 2015).Data information: Significant enrichment: ***P < 0.001; *P < 0.05. P‐values are Benjamini–Yekutieli‐adjusted.
Figure 4 “Top 18” genes are expressed in microglia and regulated by Spi1 AFor each gene set (top 18, APPtg‐Blue, and GWAS P < 0.001, Marioni et al (2018)), their expression was assessed in the different cell types listed on the left, based on the expression matrix as published by Zeisel et al (2015). As can be viewed, the top 18 genes are highly expressed in microglia.BBased on the marker genes for each cell type as determined by Zeisel et al (2015), enrichment of these marker genes was assessed among the three gene sets (top 18, APPtg‐Blue, and GWAS P < 0.001, Marioni et al, 2018). Significant enrichment of microglial marker genes can be observed for all three gene sets, while the APPtg‐Blue module is also enriched for astrocyte marker genes.CEnrichment of transcription factor targets among the “top 18” genes (red bars) and the GWAS genes with P < 0.001 (green bars), using i‐CisTarget (Imrichová et al, 2015).Data information: Significant enrichment: ***P < 0.001; *P < 0.05. P‐values are Benjamini–Yekutieli‐adjusted.CC BY · PubMed Central
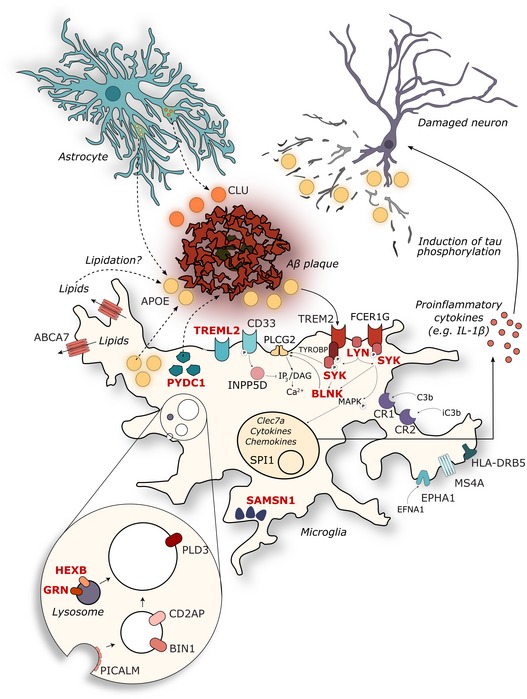
Figure 5 The 11 novel prioritized AD risk genes are within a lysosomal gene networks or involving innate immunity Genes are depicted in their known cellular components, with previously described established GWAS (Efthymiou & Goate, 2017; Verheijen & Sleegers, 2018) in black and the prioritized novel genes (this paper) in red. See discussion section for further functional annotation and references.
Figure 5 The 11 novel prioritized AD risk genes are within a lysosomal gene networks or involving innate immunity Genes are depicted in their known cellular components, with previously described established GWAS (Efthymiou & Goate, 2017; Verheijen & Sleegers, 2018) in black and the prioritized novel genes (this paper) in red. See discussion section for further functional annotation and references.CC BY · PubMed Central
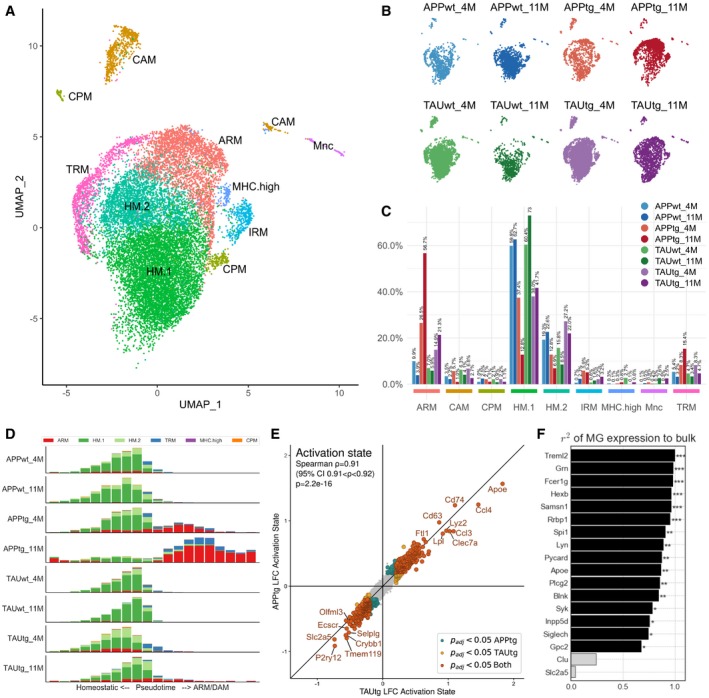
Figure 6 Single microglia sequencing demonstrates a strong ARM response in APPtg in comparison with TAUtg mice AUMAP clustering of sorted Cd11b+/Cd45+ myeloid cells from mouse hippocampus. ARM: activated response microglia; CAM: CNS‐associated macrophages; CPM: cycling and proliferating microglia; HM.1: homeostatic microglia cluster 1; HM.2: homeostatic microglia cluster 2; IRM: interferon‐response microglia; MHC.high: high MHC‐expressing microglia; Mnc: monocytes; TRM: transitioning microglia.BDistribution of cells across the different clusters per experimental group (n = 2 mice pooled for all experimental groups, except for TAUtg‐11M and TAUwt‐11M with n = 3 mice pooled).CDistribution of cells per experimental group over the different clusters, expressed in percentages as stated on top of each bar. E.g., of all cells within APPtg‐11M, 56.7% of cells are ARM, while 12.5% are HM.1 cells.DScorpius‐based ranking of all cells on a pseudotime from homeostatic to activated microglia. Whereas all cells within the WT groups are clustered within the homeostatic part of the pseudotime trajectory, APPtg‐4M and APPtg‐11M mice demonstrate a shift toward more activated microglia.EDifferential expression of ARM versus HM.1 microglia for APPtg and TAUtg mice separately. Genes with a positive log(fold change; LFC) are more highly expressed in ARMs compared to HM.1 microglia; genes with a negative LFC are more highly expressed in HM.1 compared to ARM cells. As can be seen genes that are significantly differentially expressed between ARM and HM.1 cells are highly similar among APPtg and TAUtg mice (Spearman correlation r = 0.91, P = 2.2e‐16). LFC > |0.2| with P adj < 0.05 is considered significant.FPredicted contribution of microglial expression of each of the top 18 genes to the observed bulk RNA‐seq expression data, based on linear regression (see Materials and Methods). For 16/18 genes, the microglial expression contributes significantly and 67% or more to the observed expression from the bulk RNA‐seq. ***Benjamini–Yekutieli‐adjusted P‐value (P adj) < 0.001; **P adj < 0.01; *P adj < 0.05.
Figure 6 Single microglia sequencing demonstrates a strong ARM response in APPtg in comparison with TAUtg mice AUMAP clustering of sorted Cd11b+/Cd45+ myeloid cells from mouse hippocampus. ARM: activated response microglia; CAM: CNS‐associated macrophages; CPM: cycling and proliferating microglia; HM.1: homeostatic microglia cluster 1; HM.2: homeostatic microglia cluster 2; IRM: interferon‐response microglia; MHC.high: high MHC‐expressing microglia; Mnc: monocytes; TRM: transitioning microglia.BDistribution of cells across the different clusters per experimental group (n = 2 mice pooled for all experimental groups, except for TAUtg‐11M and TAUwt‐11M with n = 3 mice pooled).CDistribution of cells per experimental group over the different clusters, expressed in percentages as stated on top of each bar. E.g., of all cells within APPtg‐11M, 56.7% of cells are ARM, while 12.5% are HM.1 cells.DScorpius‐based ranking of all cells on a pseudotime from homeostatic to activated microglia. Whereas all cells within the WT groups are clustered within the homeostatic part of the pseudotime trajectory, APPtg‐4M and APPtg‐11M mice demonstrate a shift toward more activated microglia.EDifferential expression of ARM versus HM.1 microglia for APPtg and TAUtg mice separately. Genes with a positive log(fold change; LFC) are more highly expressed in ARMs compared to HM.1 microglia; genes with a negative LFC are more highly expressed in HM.1 compared to ARM cells. As can be seen genes that are significantly differentially expressed between ARM and HM.1 cells are highly similar among APPtg and TAUtg mice (Spearman correlation r = 0.91, P = 2.2e‐16). LFC > |0.2| with P adj < 0.05 is considered significant.FPredicted contribution of microglial expression of each of the top 18 genes to the observed bulk RNA‐seq expression data, based on linear regression (see Materials and Methods). For 16/18 genes, the microglial expression contributes significantly and 67% or more to the observed expression from the bulk RNA‐seq. ***Benjamini–Yekutieli‐adjusted P‐value (P adj) < 0.001; **P adj < 0.01; *P adj < 0.05.CC BY · PubMed Central
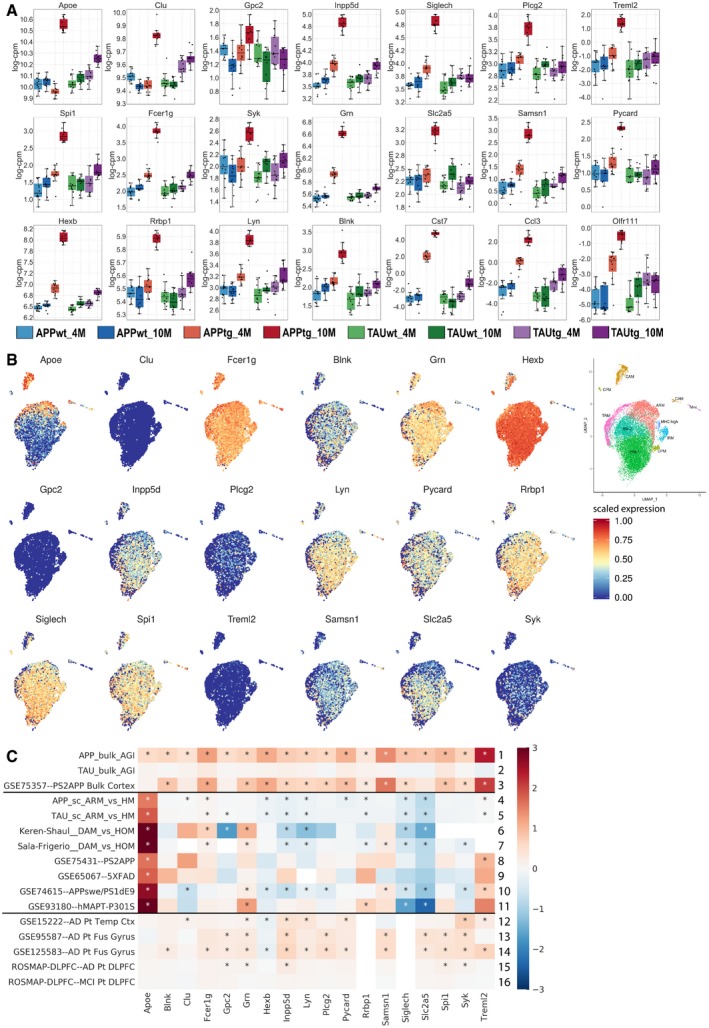
Figure EV2 Expression of the top 18 genes in single microglia RNA‐seq and publicly available data AExpression of the top 18 genes in the bulk RNA‐seq dataset across the 8 experimental groups. Boxplots: center line, median; box limits, 25th–75th quartiles; and whiskers, 1.5× interquartile range.BScaled expression of our top 18 genes in the single microglia RNA‐seq dataset, highlighting that Clu, Gpc2, and Treml2 are very sparsely expressed by microglia. Expression values are scaled from 0 to 1. The insert on the far right is a duplicate of Fig 6A to help locate the expression of specific genes to particular clusters.CCompilation of publicly available data and the bulk and single microglia sequencing from the current study. Whereas bulk RNA‐seq of mouse models (rows 1–3) and AD patients (row 12–16) demonstrates increased expression in the top 18 transcripts, RNA‐seq of isolated microglia (rows 8–11) or single cell RNA‐seq (rows 4–7) demonstrates no alterations or slightly decreased expression of the top 18 genes.
Figure EV2 Expression of the top 18 genes in single microglia RNA‐seq and publicly available data AExpression of the top 18 genes in the bulk RNA‐seq dataset across the 8 experimental groups. Boxplots: center line, median; box limits, 25th–75th quartiles; and whiskers, 1.5× interquartile range.BScaled expression of our top 18 genes in the single microglia RNA‐seq dataset, highlighting that Clu, Gpc2, and Treml2 are very sparsely expressed by microglia. Expression values are scaled from 0 to 1. The insert on the far right is a duplicate of Fig 6A to help locate the expression of specific genes to particular clusters.CCompilation of publicly available data and the bulk and single microglia sequencing from the current study. Whereas bulk RNA‐seq of mouse models (rows 1–3) and AD patients (row 12–16) demonstrates increased expression in the top 18 transcripts, RNA‐seq of isolated microglia (rows 8–11) or single cell RNA‐seq (rows 4–7) demonstrates no alterations or slightly decreased expression of the top 18 genes.CC BY · PubMed Central
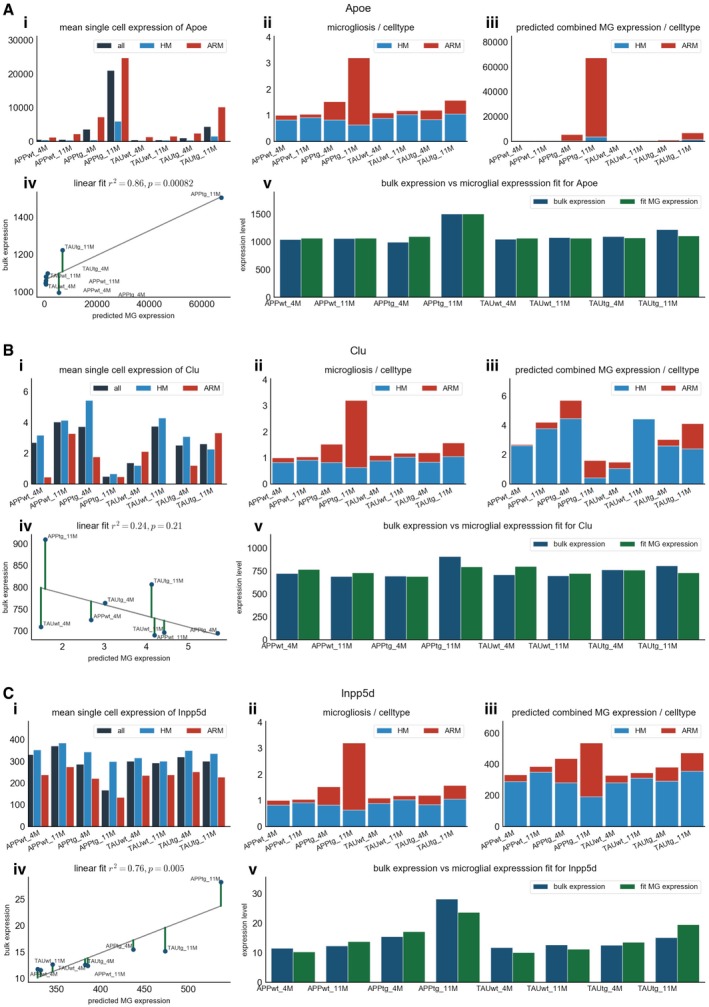
Figure EV3 Examples of the predicted contribution of microglial expression of Apoe (A), Clu (B), and Inpp5d (C) to their observed expression in bulk A–CFor each gene, the different panels display i) the average expression of the specified gene in the single cell microglia RNA‐seq for all microglia, homeostatic microglia (HM), and non‐homeostatic microglia (ARM); ii) the predicted level of microgliosis in each experimental group, based on the average expression of the microglial gene set of Zeisel et al (2015), divided in the contribution of ARM and HM cells to the predicted microgliosis. As this prediction is not gene‐dependent, graph ii is the same in panels A, B, and C; iii) the predicted microglial expression per microglial subtype multiplied with the degree of microgliosis; iv) linear regression on the predicted microglial expression as calculated in iii) and the observed bulk RNA‐seq expression; and v) the observed bulk RNA‐seq expression (in blue) per experimental group plotted side‐by‐side with the predicted microglial expression (in green) of that specific gene.
Figure EV3 Examples of the predicted contribution of microglial expression of Apoe (A), Clu (B), and Inpp5d (C) to their observed expression in bulk A–CFor each gene, the different panels display i) the average expression of the specified gene in the single cell microglia RNA‐seq for all microglia, homeostatic microglia (HM), and non‐homeostatic microglia (ARM); ii) the predicted level of microgliosis in each experimental group, based on the average expression of the microglial gene set of Zeisel et al (2015), divided in the contribution of ARM and HM cells to the predicted microgliosis. As this prediction is not gene‐dependent, graph ii is the same in panels A, B, and C; iii) the predicted microglial expression per microglial subtype multiplied with the degree of microgliosis; iv) linear regression on the predicted microglial expression as calculated in iii) and the observed bulk RNA‐seq expression; and v) the observed bulk RNA‐seq expression (in blue) per experimental group plotted side‐by‐side with the predicted microglial expression (in green) of that specific gene.CC BY · PubMed Central

Verification

Claims the paper makes

The claims and statistics of this paper haven’t been checked yet.

Run the check — free, no account needed. It reads the open-access text and checks the sources it cites.

A few free checks a day · papers already verified open instantly · results are public

Claims other papers make about this one

Each is checked against this paper’s own text: does it say what the citing paper says it does?

Self-check

Percentages, sums and reported differences re-computed from the paper’s own numbers.

The self-check needs the paper’s full text.

Citations

Cites

Show all 74 references

Cited by

Sorted by citations

Items 101–103 of 103

Metadata

Authors
Sierksma, A., Lu, A., Mancuso, R., Fattorelli, N., Thrupp, N., Salta, E., Zoco, J., Blum, D., Buée, L., De Strooper, B., & Fiers, M.
Affiliations
  • VIB-KU Leuven Center for Brain & Disease Research (BE)
  • Inserm (FR)
Corresponding author
Fiers, Mark
Venue
EMBO Molecular Medicine
Published
2020-01-17
Volume
12
Issue
3
Pages
e10606-e10606
ISSN
  • 1757-4676 (ISSN-L)
  • 1757-4684
OpenAlex
W3000035810
Cited by
291
References
74
Citations by year
2026: 21 · 2025: 43 · 2024: 37 · 2023: 48 · 2022: 58 · 2021: 54 · 2020: 28
FWCI
28.26
Type
journal article
Language
en
Open access
Locations
  • EMBO Molecular Medicine (publishedVersion, other-oa)
  • bioRxiv (Cold Spring Harbor Laboratory) (acceptedVersion)
  • PubMed Central (publishedVersion, cc-by)
  • PubMed (publishedVersion)
  • Lirias (KU Leuven) (acceptedVersion)
  • Lirias (submittedVersion, other-oa)
  • Lirias (KU Leuven) (submittedVersion, other-oa)
  • HAL (submittedVersion, other-oa)
  • DOAJ (DOAJ: Directory of Open Access Journals) (submittedVersion, cc-by-sa)
  • UCL Discovery (University College London) (submittedVersion)
Funders
  • Leuven Universitair Fonds
  • Alzheimer Research Foundation (P16017)
  • Fonds voor Wetenschappelijk Onderzoek (1139520N, 12A5316N, G0C9219N)
  • Alzheimer's Association (AARF‐16‐442853)
  • KU Leuven
  • Vlaams Instituut voor Biotechnologie
  • Vlaamse Overheid
  • Vlaams Initiatief voor Netwerken voor Dementie Onderzoek
  • Geneeskundige Stichting Koningin Elisabeth
  • Bax‐Vanluffelen Chair for Alzheimer's Disease
  • Agence National Recherche (ANR‐16‐COEN‐0007)
  • UK Research and Innovation|MRC|Medical Research Foundation
  • Alzheimer Society
  • Alzheimer Research UK
Topics
  • Life Sciences › Neuroscience › Cellular and Molecular Neuroscience › Alzheimer's disease research and treatments
  • Life Sciences › Neuroscience › Neurology › Neuroinflammation and Neurodegeneration Mechanisms
  • Health Sciences › Medicine › Psychiatry and Mental health › Dementia and Cognitive Impairment Research
Keywords
Alzheimer's disease, Alzheimer's disease risk genes, microglia, amyloid-beta, tau pathology, polygenic risk score, single-cell RNA sequencing, microglial activation, apolipoprotein E, clusterin, CD33, PLCγ2, PU.1, FCER1G, Syk, GPC2
MeSH terms
Alzheimer Disease, Animals, Disease Models, Animal, Hippocampus, Male, Mice, Transgenic, Amyloid beta-Peptides, tau Proteins, Microglia, Mice, Gene Regulatory Networks

About these checks

Registry, retraction, Cites and statistics results are computed, not judged, with one exception: a printed reference that no index lists is read once by a model before it counts as a citation error. Claims are extracted by a model and kept only when their quote appears verbatim in the text; each cited source is then checked, with a model’s help, for whether it says what the claim relies on. Those verdicts can be wrong — read the claim’s quote and the cited source before relying on one.

Statistics and arithmetic are recomputed, not judged.

Confidence bands are shown only for fields calibrated on our annotated test set. None is calibrated yet, so no band is shown.

What counts as a claim ›How we measure confidence ›How we check this ›

Are you an author, or do you see a problem with this page? Request a review