

Large-scale image-based profiling of single-cell phenotypes in arrayed CRISPR-Cas9 gene perturbation screens
Open accessThe DOI matches its Crossref record; 35 of the 35 references it cites were found in a registry or an index.
Abstract
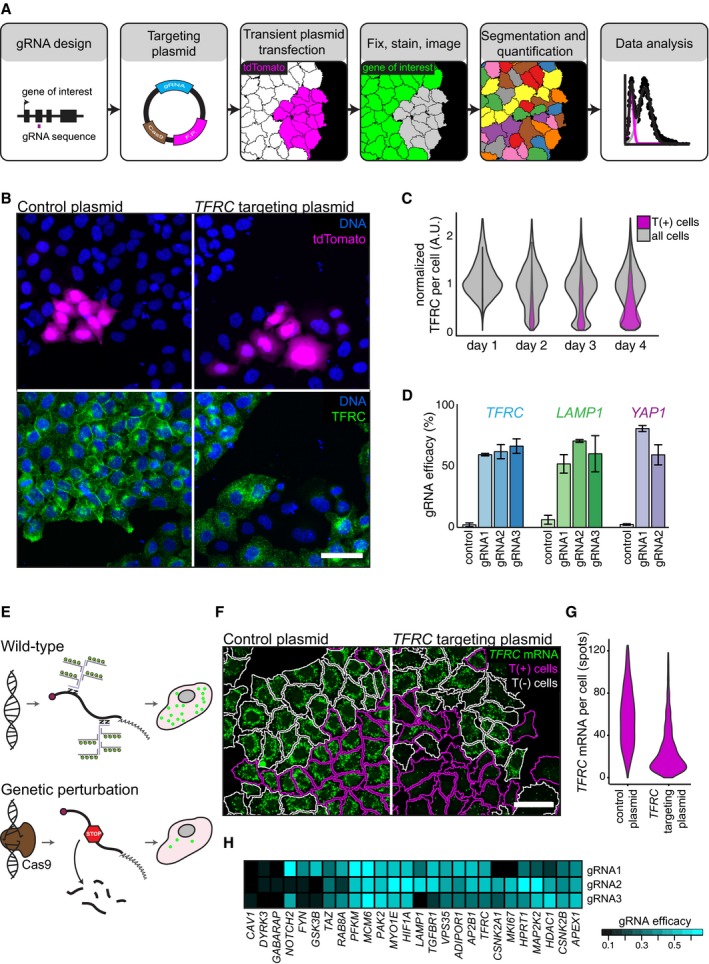
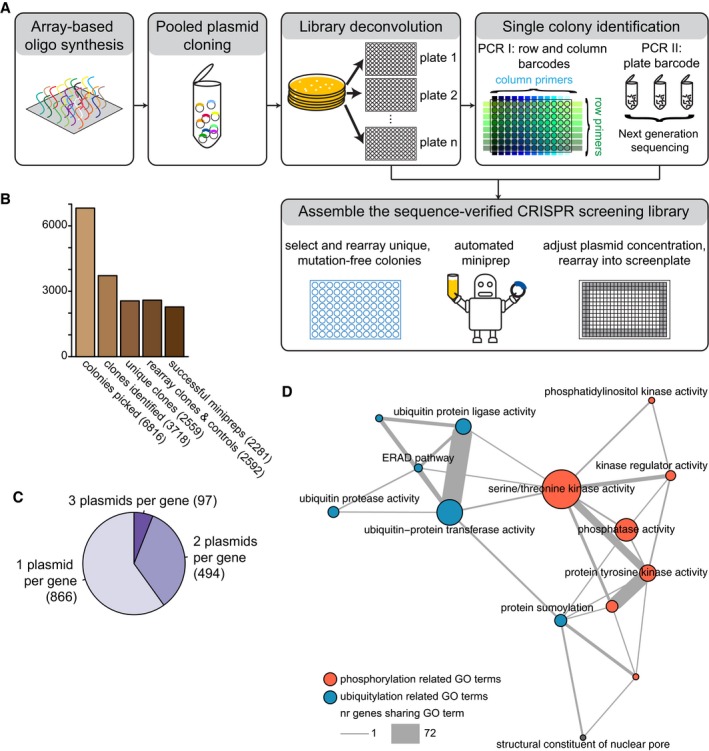
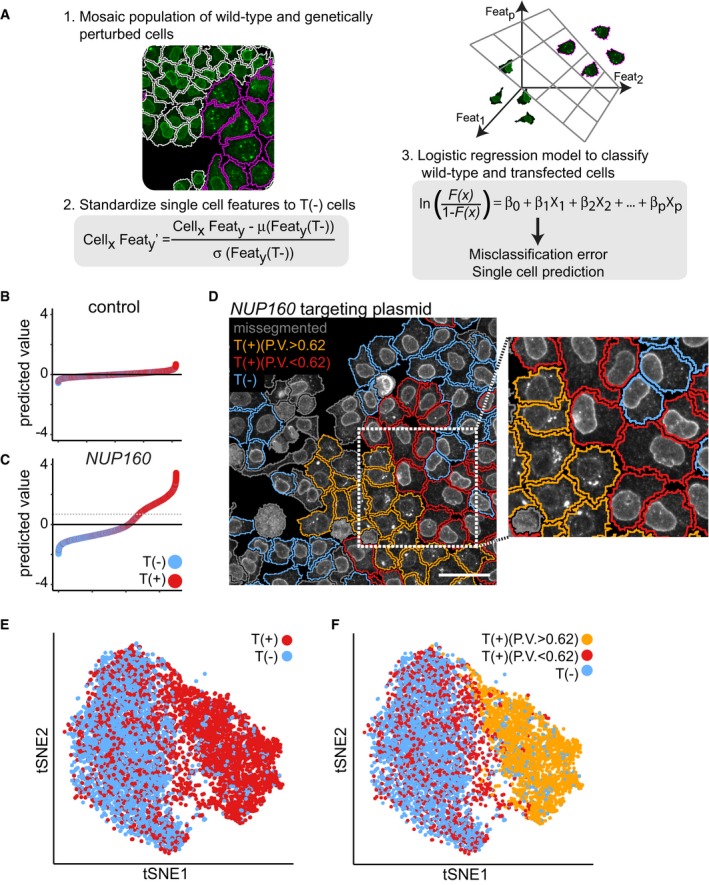
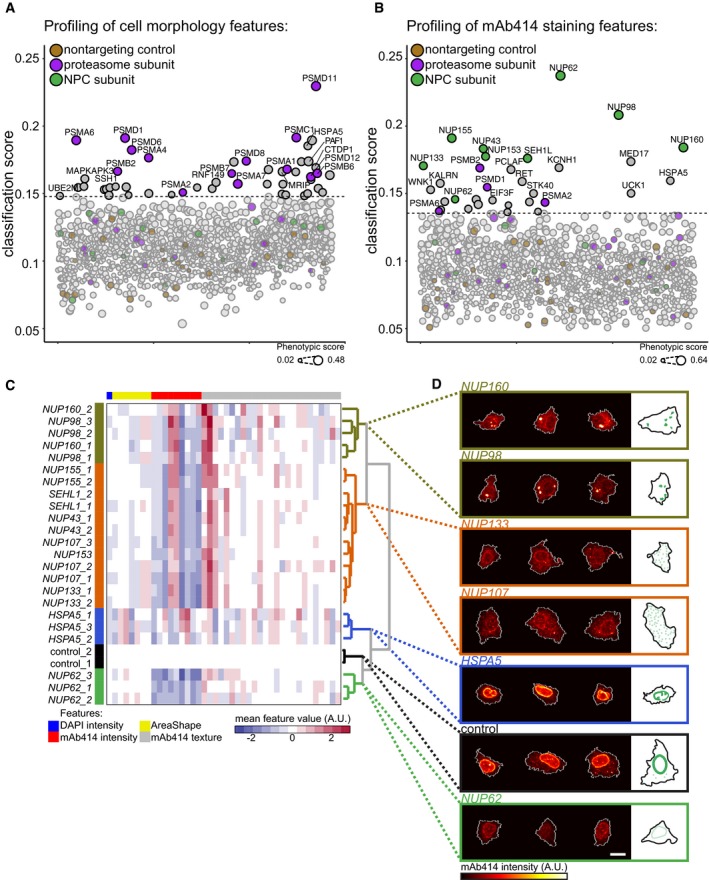
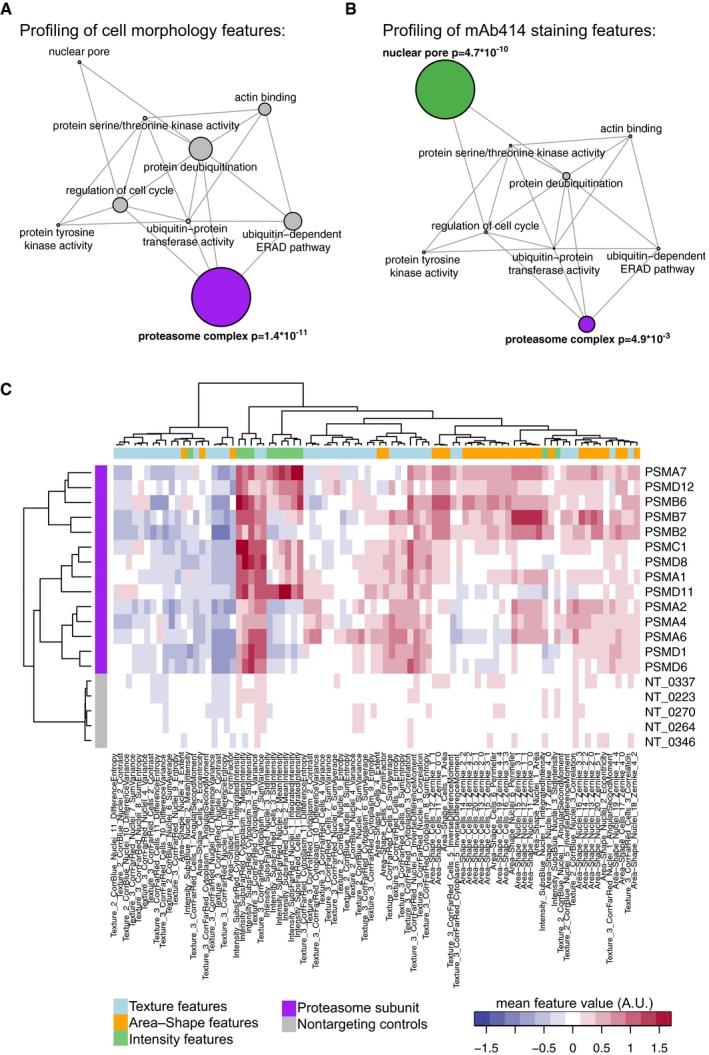
High‐content imaging using automated microscopy and computer vision allows multivariate profiling of single‐cell phenotypes. Here, we present methods for the application of the CISPR‐Cas9 system in large‐scale, image‐based, gene perturbation experiments. We show that CRISPR‐Cas9‐mediated gene perturbation can be achieved in human tissue culture cells in a timeframe that is compatible with image‐based phenotyping. We developed a pipeline to construct a large‐scale arrayed library of 2,281 sequence‐verified CRISPR‐Cas9 targeting plasmids and profiled this library for genes affecting cellular morphology and the subcellular localization of components of the nuclear pore complex (NPC). We conceived a machine‐learning method that harnesses genetic heterogeneity to score gene perturbations and identify phenotypically perturbed cells for in‐depth characterization of gene perturbation effects. This approach enables genome‐scale image‐based multivariate gene perturbation profiling using CRISPR‐Cas9.
Overview
The claims and statistics of this paper haven’t been checked yet.
Free: it reads the open-access text and checks the first 5 claims that cite a source we can check. Create a free account to check every claim.
Integrity signals
Registry
Cites
Statistics
Figures

Verification
Claims the paper makes
The claims and statistics of this paper haven’t been checked yet.
Free: it reads the open-access text and checks the first 5 claims that cite a source we can check. Create a free account to check every claim.
Claims other papers make about this one
Each is checked against this paper’s own text: does it say what the citing paper says it does?
The source backs part of the claim, not all of it — or backs it for a different population, condition or comparison.
In the citing paper
“In recent years, there has been wide use of pooled genome-scale CRISPR screens based on enriching cells via fitness or reporter fluorescence in various model systems, but only one large-scale (2,281 sgRNA) CRISPR imaging screen (Groot et al., 2018).”
From Optical Pooled Screens in Human Cells (2019) · cites this paper as Groot et al., 2018
Experimental — accuracy not yet measured
Self-check
Percentages, sums and reported differences re-computed from the paper’s own numbers.
The self-check needs the paper’s full text.
Citations
Cites
(2008) · Journal of Machine Learning Research · Cited by 33,051
Regularization and Variable Selection Via the Elastic Net
Zou, H., & Hastie, T. (2005) · Journal of the Royal Statistical Society Series B: Statistical Methodology · doi:10.1111/j.1467-9868.2005.00503.x · Cited by 20,957
Regularization Paths for Generalized Linear Models via Coordinate Descent
Friedman, J., Hastie, T., & Tibshirani, R. (2010) · Journal of Statistical Software · doi:10.18637/jss.v033.i01 · Cited by 19,927 · cited 2×
“We randomly selected 500 T(+) and T( ) cells (with replacement) form every targeted cell population and trained a 10- fold cross-validated logistic regression model on the single-cell data using the R software package glmnet (Friedman et al, 2010).”
MethodGenome engineering using the CRISPR-Cas9 system
Ran, F. A., Hsu, P. D., Wright, J., Agarwala, V., Scott, D. A., & Zhang, F. (2013) · Nature Protocols · doi:10.1038/nprot.2013.143 · Cited by 11,133
Genome-scale CRISPR-Cas9 knockout screening in human cells
Shalem, O., Sanjana, N. E., Hartenian, E., Shi, X., Scott, D. A., Mikkelsen, T. S., Heckl, D., Ebert, B. L., Root, D. E., Doench, J. G., et al. (2014) · Science · doi:10.1126/science.1247005 · Cited by 5,234 · cited 1×
“Most screens performed to date employ a pooled screening strategy, which can identify genes that cause differential growth in screening conditions (Koike-Yusa et al, 2013; Shalem et al, 2014; Wang et al, 2014).”
BackgroundGenetic screens in human cells using the CRISPR-Cas9 system
Wang, T., Wei, J. J., Sabatini, D. M., & Lander, E. S. (2014) · Science · doi:10.1126/science.1246981 · Cited by 2,856 · cited 1×
“Most screens performed to date employ a pooled screening strategy, which can identify genes that cause differential growth in screening conditions (Koike-Yusa et al, 2013; Shalem et al, 2014; Wang et al, 2014).”
BackgroundDixit, A., Parnas, O., Li, B., Chen, J., Fulco, C. P., Jerby-Arnon, L., Marjanovic, N. D., Dionne, D., Burks, T., Raychowdhury, R., et al. (2016) · Cell · doi:10.1016/j.cell.2016.11.038 · Cited by 1,863
Rational design of highly active sgRNAs for CRISPR-Cas9-mediated gene inactivation
Doench, J. G., Hartenian, E., Graham, D. B., Tothova, Z., Hegde, M., Smith, I., Sullender, M., Ebert, B. L., Xavier, R. J., & Root, D. E. (2014) · Nature Biotechnology · doi:10.1038/nbt.3026 · Cited by 1,617 · cited 2×
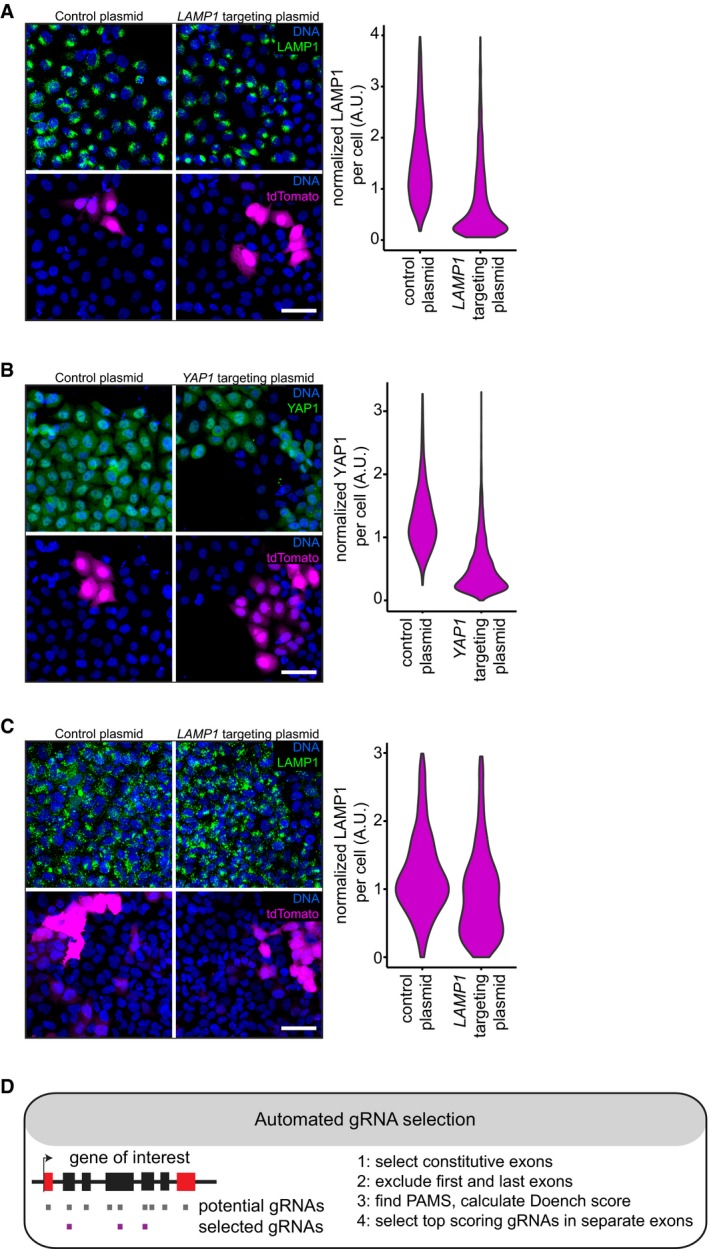
“To systematically test our approach across multiple genes, we automated the selection of gRNA sequences with high predicted ontarget efficacy (Doench et al, 2014).”
MethodGarcía-Alonso, C. R., Pérez-Naranjo, L. M., & Fernández-Caballero, J. C. (2014) · Annals of Operations Research · doi:10.1007/s10479-011-0841-3 · Cited by 1,353
High-throughput functional genomics using CRISPR-Cas9
Shalem, O., Sanjana, N. E., & Zhang, F. (2015) · Nature Reviews Genetics · doi:10.1038/nrg3899 · Cited by 1,233 · cited 2×
“Importantly, CRISPR-Cas9 is not 100% effective in all targeted cells, which can be the result of in-frame repair of the CRISPR-Cas9induced DNA lesions, a failure to target all functional alleles or limited efficacy of the CRISPR-Cas9 system (Shalem et al, 2015).”
BackgroundMethodAdamson, B., Norman, T. M., Jost, M., Cho, M. Y., Nuñez, J. K., Chen, Y., Villalta, J. E., Gilbert, L. A., Horlbeck, M. A., Hein, M. Y., et al. (2016) · Cell · doi:10.1016/j.cell.2016.11.048 · Cited by 1,193 · cited 1×
“…with single-cell RNA-seq, but this does not easily scale to the profiling of thousands of single cells from thousands of perturbations, and is limited to features that can be read from RNA transcript profiles (Adamson et al, 2016; Dixit et al, 2016; Jaitin et al, 2016; Datlinger et al, 2017).”
BackgroundPooled CRISPR screening with single-cell transcriptome readout.
Datlinger, P., Rendeiro, A. F., Schmidl, C., Krausgruber, T., Traxler, P., Klughammer, J., Schuster, L. C., Kuchler, A., Alpar, D., & Bock, C. (2017) · Nature Methods · doi:10.1038/nmeth.4177 · Cited by 1,096 · cited 1×
“…with single-cell RNA-seq, but this does not easily scale to the profiling of thousands of single cells from thousands of perturbations, and is limited to features that can be read from RNA transcript profiles (Adamson et al, 2016; Dixit et al, 2016; Jaitin et al, 2016; Datlinger et al, 2017).”
BackgroundKoike-Yusa, H., Li, Y., Tan, E.-P., Velasco-Herrera, M. D. C., & Yusa, K. (2014) · Nature Biotechnology · doi:10.1038/nbt.2800 · Cited by 1,064 · cited 1×
“Most screens performed to date employ a pooled screening strategy, which can identify genes that cause differential growth in screening conditions (Koike-Yusa et al, 2013; Shalem et al, 2014; Wang et al, 2014).”
BackgroundDissecting Immune Circuits by Linking CRISPR-Pooled Screens with Single-Cell RNA-Seq
Jaitin, D. A., Weiner, A., Yofe, I., Lara-Astiaso, D., Keren-Shaul, H., David, E., Salame, T. M., Tanay, A., van Oudenaarden, A., & Amit, I. (2016) · Cell · doi:10.1016/j.cell.2016.11.039 · Cited by 777 · cited 1×
“…with single-cell RNA-seq, but this does not easily scale to the profiling of thousands of single cells from thousands of perturbations, and is limited to features that can be read from RNA transcript profiles (Adamson et al, 2016; Dixit et al, 2016; Jaitin et al, 2016; Datlinger et al, 2017).”
BackgroundData-analysis strategies for image-based cell profiling
Caicedo, J. C., Cooper, S., Heigwer, F., Warchal, S., Qiu, P., Molnar, C., Vasilevich, A. S., Barry, J. D., Bansal, H. S., Kraus, O., et al. (2017) · Nature Methods · doi:10.1038/nmeth.4397 · Cited by 739 · cited 2×
“We subsequently calculated the Mahalanobis distance between each profile and the total distribution of feature profiles to quantify phenotypic dissimilarity (Caicedo et al, 2017).”
MethodIdentification and characterization of a nuclear pore complex protein
Davis, L. I., & Blobel, G. (1986) · Cell · doi:10.1016/0092-8674(86)90784-1 · Cited by 617 · cited 3×
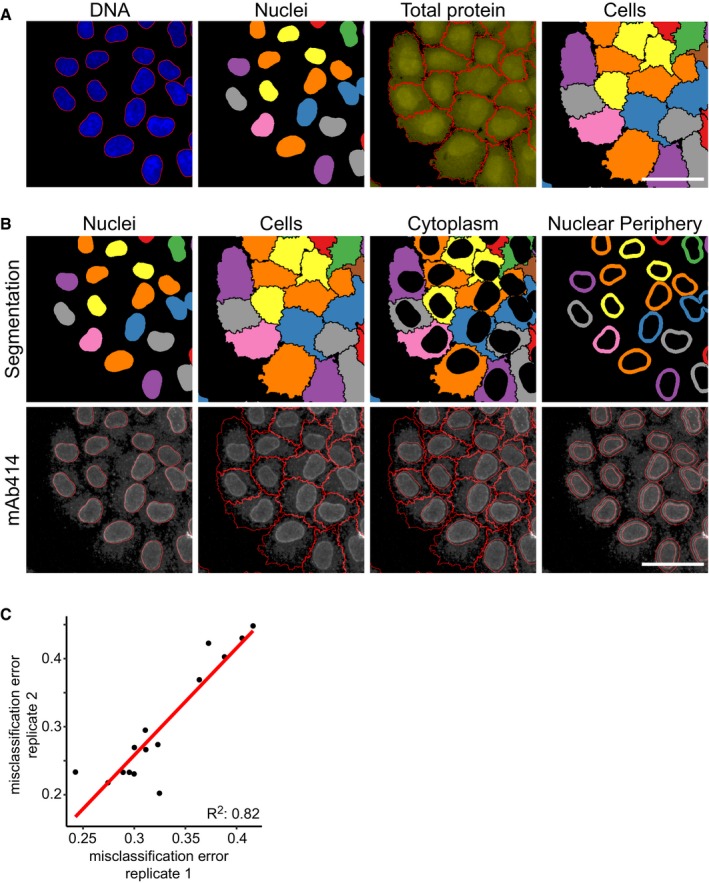
“…Biology 14: e8064 | 2018 ª 2018 The Authors 2 of 10 ª 2018 The Authors Molecular Systems Biology 14: e8064 | 2018 3 of 10 Molecular Systems Biology 14: e8064 | 2018 ª 2018 The Authors 4 of 10 staining pattern, with the majority of signal localized to the nuclear periphery (Davis & Blobel, 1986).”
BackgroundInfluentialThe art and design of genetic screens: RNA interference
Boutros, M., & Ahringer, J. (2008) · Nature Reviews Genetics · doi:10.1038/nrg2364 · Cited by 474 · cited 1×
“Forward and reverse genetic screens in mammalian cells and model organisms have provided a wealth of information about gene function (Boutros & Ahringer, 2008; Liberali et al, 2015).”
BackgroundSystems survey of endocytosis by multiparametric image analysis
Collinet, C., Stöter, M., Bradshaw, C. R., Samusik, N., Rink, J. C., Kenski, D., Habermann, B., Buchholz, F., Henschel, R., Mueller, M. S., et al. (2010) · Nature · doi:10.1038/nature08779 · Cited by 446 · cited 4×
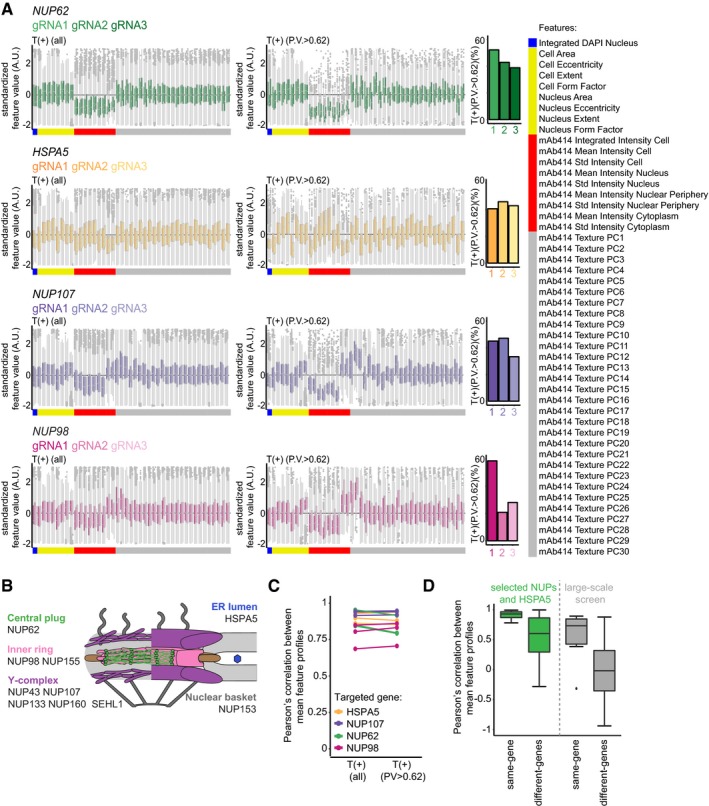
“…these profiles, revealed that profiles obtained from cells perturbed with different gRNAs targeting the same gene are highly similar across the full set of multivariate readouts (Figs 3C and EV6A and D), something that is generally not realized with RNAi (Collinet et al, 2010; Singh et al, 2015).”
BackgroundInfluentialThe Conserved Nup107-160 Complex Is Critical for Nuclear Pore Complex Assembly
Walther, T. C., Alves, A., Pickersgill, H., Loı̈odice, I., Hetzer, M., Galy, V., Hülsmann, B. B., Köcher, T., Wilm, M., Allen, T., et al. (2003) · Cell · doi:10.1016/s0092-8674(03)00235-6 · Cited by 401 · cited 3×
“Strikingly, hierarchical clustering of these profiles, as well as the correlation between these profiles, revealed that profiles obtained from cells perturbed with different gRNAs targeting the same gene are highly similar across the full set of multivariate readouts (Figs 3C and EV6A and D), something that is general…”
BackgroundMicroscopy-Based High-Content Screening
Boutros, M., Heigwer, F., & Laufer, C. (2015) · Cell · doi:10.1016/j.cell.2015.11.007 · Cited by 396 · cited 1×
“This arrayed screening strategy allows detailed, image-based phenotyping of populations of cells in which specific genes are perturbed (Boutros et al, 2015; Liberali et al, 2015; Caicedo et al, 2016).”
MethodImage-based multivariate profiling of drug responses from single cells
Loo, L.-H., Wu, L. F., & Altschuler, S. J. (2007) · Nature Methods · doi:10.1038/nmeth1032 · Cited by 343 · cited 1×
“…this aspect to address two challenges in the analysis of large-scale image-based profiling experiments; technical well-to-well variation and the identification of significant perturbation effects in high-dimensional single-cell datasets (Loo et al, 2007; Liberali et al, 2015; Caicedo et al, 2016).”
BackgroundThe critical role of GRP78 in physiologic and pathologic stress
Pfaffenbach, K. T., & Lee, A. S. (2011) · Current Opinion in Cell Biology · doi:10.1016/j.ceb.2010.09.007 · Cited by 327 · cited 2×
“This phenotype may reflect an early stage of the apoptotic programme, which could be triggered in the HSPA5 knockout cells through ectopic activation of the UPR (Kihlmark et al, 2001; Pfaffenbach & Lee, 2011).”
BackgroundImage-based transcriptomics in thousands of single human cells at single-molecule resolution
Battich, N., Stoeger, T., & Pelkmans, L. (2013) · Nature Methods · doi:10.1038/nmeth.2657 · Cited by 277 · cited 2×
“We employed a single-molecule fluorescence in situ hybridization (smFISH) technique (Battich et al, 2013) to detect the cells in which transcripts are depleted due to nonsense-mediated decay, which results from CRISPR-Cas9-induced frameshift mutations (Fig 1E, F and G).”
MethodSelf-citationHultquist, J. F., Schumann, K., Woo, J. M., Manganaro, L., McGregor, M. J., Doudna, J., Simon, V., Krogan, N. J., & Marson, A. (2016) · Cell Reports · doi:10.1016/j.celrep.2016.09.080 · Cited by 170 · cited 1×
“…the CRISPRCas9 system to an arrayed format, but these were limited in scale and only obtained well-averaged readouts with low information content (Hultquist et al, 2016; Tan & Martin, 2016; Strezoska et al, 2017), not realizing the full potential that image-based multivariate single-cell…”
Applications in image-based profiling of perturbations
Caicedo, J. C., Singh, S., & Carpenter, A. E. (2016) · Current Opinion in Biotechnology · doi:10.1016/j.copbio.2016.04.003 · Cited by 168 · cited 2×
“This arrayed screening strategy allows detailed, image-based phenotyping of populations of cells in which specific genes are perturbed (Boutros et al, 2015; Liberali et al, 2015; Caicedo et al, 2016).”
BackgroundMethodNuclear pore assembly proceeds by an inside-out extrusion of the nuclear envelope
Otsuka, S., Bui, K. H., Schorb, M., Hossain, M. J., Politi, A. Z., Koch, B., Eltsov, M., Beck, M., & Ellenberg, J. (2016) · eLife · doi:10.7554/elife.19071 · Cited by 158 · cited 1×
“We stained for this marker because the regulation of NPC assembly in interphase is incompletely understood (Otsuka et al, 2016; Weberruss & Antonin, 2016) and the subcellular localization of NPC components can only be investigated using microscopy.”
Sequential degradation of proteins from the nuclear envelope during apoptosis
Kihlmark, M., Imreh, G., & Hallberg, E. (2001) · Journal of Cell Science · doi:10.1242/jcs.114.20.3643 · Cited by 107
Single-cell and multivariate approaches in genetic perturbation screens
Liberali, P., Snijder, B., & Pelkmans, L. (2014) · Nature Reviews Genetics · doi:10.1038/nrg3768 · Cited by 107 · cited 3×
“Forward and reverse genetic screens in mammalian cells and model organisms have provided a wealth of information about gene function (Boutros & Ahringer, 2008; Liberali et al, 2015).”
BackgroundMethodSelf-citationIn situ genotyping of a pooled strain library after characterizing complex phenotypes
Lawson, M. J., Camsund, D., Larsson, J., Baltekin, Ö., Fange, D., & Elf, J. (2017) · Molecular Systems Biology · doi:10.15252/msb.20177951 · Cited by 82 · cited 1×
“Recently, methods to perturb cells in a pooled format, followed by image-based phenotyping and in situ genotyping were developed for prokaryotic model systems (Emanuel et al, 2017; Lawson et al, 2017).”
MethodHigh-throughput, image-based screening of pooled genetic-variant libraries
Emanuel, G., Moffitt, J. R., & Zhuang, X. (2017) · Nature Methods · doi:10.1038/nmeth.4495 · Cited by 78
Perforating the nuclear boundary – how nuclear pore complexes assemble
Weberruss, M. H., & Antonin, W. (2016) · Journal of Cell Science · doi:10.1242/jcs.194753 · Cited by 63 · cited 14×
“Antibodies used in this study are as follows: mouse anti-CD71/ TFRC (BD Biosciences 555534), mouse anti-CD107a/LAMP1 (BD Biosciences 555798), mouse anti-YAP1 (Santa-Cruz 63.7), mouse anti-NPC (mAb414, Abcam), goat anti-mouse Alexa 488 highly cross-absorbed secondary antibody (Life Technologies A11029).”
InfluentialComputer vision for image-based transcriptomics
Stoeger, T., Battich, N., Herrmann, M. D., Yakimovich, Y., & Pelkmans, L. (2015) · Methods · doi:10.1016/j.ymeth.2015.05.016 · Cited by 44 · cited 3×
“CellProfiler software was used for image analysis, cell segmentation and single-cell feature quantification as described in Stoeger et al (2015).”
BackgroundMethodInfluentialSelf-citationValidation of Synthetic CRISPR Reagents as a Tool for Arrayed Functional Genomic Screening
Tan, J., & Martin, S. E. (2016) · PLoS ONE · doi:10.1371/journal.pone.0168968 · Cited by 42 · cited 1×
“…to an arrayed format, but these were limited in scale and only obtained well-averaged readouts with low information content (Hultquist et al, 2016; Tan & Martin, 2016; Strezoska et al, 2017), not realizing the full potential that image-based multivariate single-cell phenotypic profiling could…”
BackgroundSingh, S., Wu, X., Ljosa, V., Bray, M.-A., Piccioni, F., Root, D. E., Doench, J. G., Boehm, J. S., & Carpenter, A. E. (2015) · PLOS ONE · doi:10.1371/journal.pone.0131370 · Cited by 38 · cited 1×
“…these profiles, revealed that profiles obtained from cells perturbed with different gRNAs targeting the same gene are highly similar across the full set of multivariate readouts (Figs 3C and EV6A and D), something that is generally not realized with RNAi (Collinet et al, 2010; Singh et al, 2015).”
BackgroundHigh-content analysis screening for cell cycle regulators using arrayed synthetic crRNA libraries
Strezoska, Ž., Perkett, M. R., Chou, E. T., Maksimova, E. M., Anderson, E. M., McClelland, S., Kelley, M. L., Vermeulen, A., & Smith, A. V. B. (2017) · Journal of Biotechnology · doi:10.1016/j.jbiotec.2017.04.017 · Cited by 27
Cited by
Optical Pooled Screens in Human Cells
Feldman, D., Singh, A., Schmid-Burgk, J. L., Carlson, R. J., Mezger, A., Garrity, A. J., Zhang, F., & Blainey, P. C. (2019) · Cell · doi:10.1016/j.cell.2019.09.016 · Cited by 321
A new era in functional genomics screens
Przybyla, L., & Gilbert, L. A. (2022) · Nature Reviews Genetics · doi:10.1038/s41576-021-00409-w · Cited by 281
MIGA2 Links Mitochondria, the ER, and Lipid Droplets and Promotes De Novo Lipogenesis in Adipocytes
Freyre, C. A. C., Rauher, P. C., Ejsing, C. S., & Klemm, R. W. (2019) · Molecular Cell · doi:10.1016/j.molcel.2019.09.011 · Cited by 253
Machine learning and image-based profiling in drug discovery
Scheeder, C., Heigwer, F., & Boutros, M. (2018) · Current Opinion in Systems Biology · doi:10.1016/j.coisb.2018.05.004 · Cited by 169
Christopher, J. A., Stadler, C., Martin, C. E., Morgenstern, M., Pan, Y., Betsinger, C. N., Rattray, D. G., Mahdessian, D., Gingras, A.-C., Warscheid, B., et al. (2021) · Nature Reviews Methods Primers · doi:10.1038/s43586-021-00029-y · Cited by 129
Metadata
- Authors
- de Groot, R., Lüthi, J., Lindsay, H., Holtackers, R., & Pelkmans, L.
- Affiliations
- University of Zurich (CH)
- Corresponding author
- Pelkmans, Lucas
- Venue
- Molecular Systems Biology
- Published
- 2018-01-01
- Volume
- 14
- Issue
- 1
- Pages
- e8064-e8064
- ISSN
- 1744-4292 (ISSN-L)
- PMC
- PMC5787707
- OpenAlex
- W2785088317
- Cited by
- 74
- References
- 35
- Citations by year
- 2026: 3 · 2025: 3 · 2024: 8 · 2023: 6 · 2022: 11 · 2021: 9 · 2020: 16 · 2019: 14 · 2018: 4
- FWCI
- 3.82
- Type
- journal article
- Language
- en
- Open access
- gold
- doi.org
- Licence
- other-oa
- creativecommons.org/licenses/by/4.0/ (tdm)
- creativecommons.org/licenses/by/4.0/ (vor, 22 d)
- Locations
- Molecular Systems Biology (publishedVersion, other-oa)
- PubMed Central (publishedVersion, cc-by)
- PubMed (publishedVersion)
- Zurich Open Repository and Archive (University of Zurich) (acceptedVersion, cc-by)
- DOAJ (DOAJ: Directory of Open Access Journals) (submittedVersion)
- Repository for Publications and Research Data (ETH Zurich) (submittedVersion, cc-by)
- Zurich Open Repository and Archive (University of Zurich) (submittedVersion, cc-by)
- ETH Zürich Research Collection (cc-by)
- Zurich Open Repository and Archive (University of Zurich)
- Funders
- SystemsX.ch (TPdF2015/342)
- Topics
- Life Sciences › Biochemistry, Genetics and Molecular Biology › Molecular Biology › CRISPR and Genetic Engineering
- Life Sciences › Biochemistry, Genetics and Molecular Biology › Biophysics › Cell Image Analysis Techniques
- Life Sciences › Biochemistry, Genetics and Molecular Biology › Molecular Biology › Single-cell and spatial transcriptomics
- Keywords
- image-based phenotyping, nuclear pore complex, cell morphology, subcellular localization, genetic heterogeneity, high-content imaging
- MeSH terms
- Machine Learning, HeLa Cells, Humans, Phenotype, Gene Library, Nuclear Pore, Gene Knockout Techniques, Single-Cell Analysis, CRISPR-Cas Systems
About these checks
Registry, retraction, Cites and statistics results are computed, not judged, with one exception: a printed reference that no index lists is read once by a model before it counts as a citation error. Claims are extracted by a model and kept only when their quote appears verbatim in the text; each cited source is then checked, with a model’s help, for whether it says what the claim relies on. Those verdicts can be wrong — read the claim’s quote and the cited source before relying on one.
Statistics and arithmetic are recomputed, not judged.
Confidence bands are shown only for fields calibrated on our annotated test set. None is calibrated yet, so no band is shown.
What counts as a claim ›How we measure confidence ›How we check this ›
Are you an author, or do you see a problem with this page? Request a review
Data sources
Bibliographic data: Semantic Scholar, OpenAlex, Crossref.
Contains information from the Semantic Scholar Academic Graph Datasets, made available under the ODC Attribution License (ODC-BY 1.0).
Semantic Scholar’s data is described in: Kinney, R., et al. (2023). The Semantic Scholar Open Data Platform. arXiv:2301.10140.
