

The DOI matches its Crossref record; 10 of the 10 references it cites were found in a registry or an index.
The Genomic and Transcriptomic Landscape of a HeLa Cell Line
Abstract
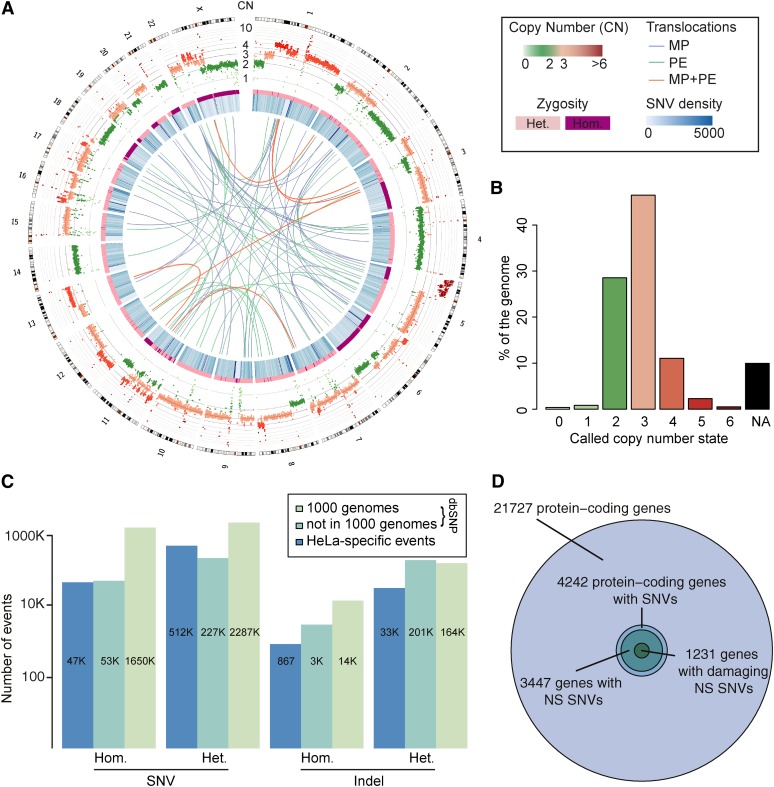
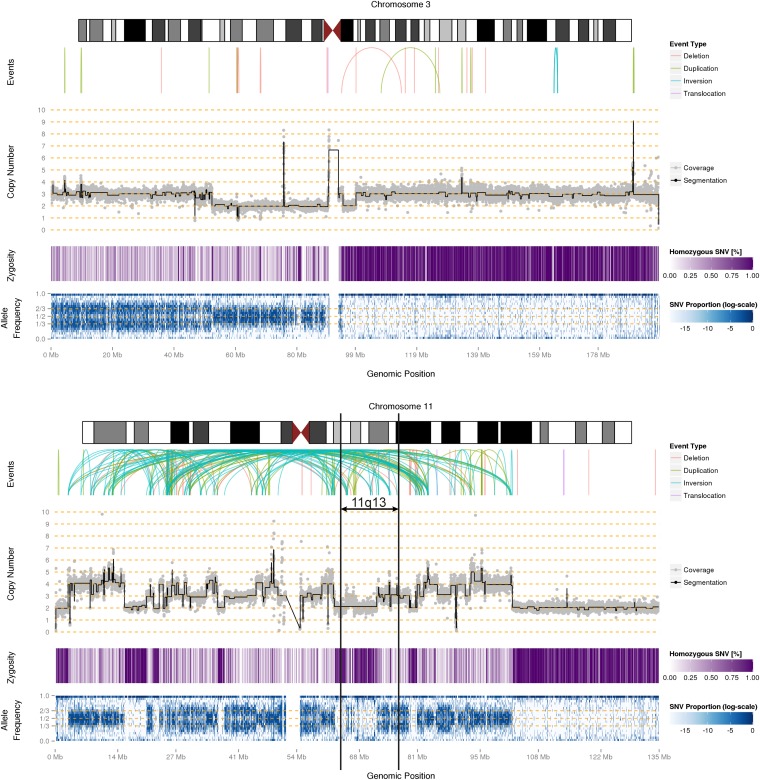
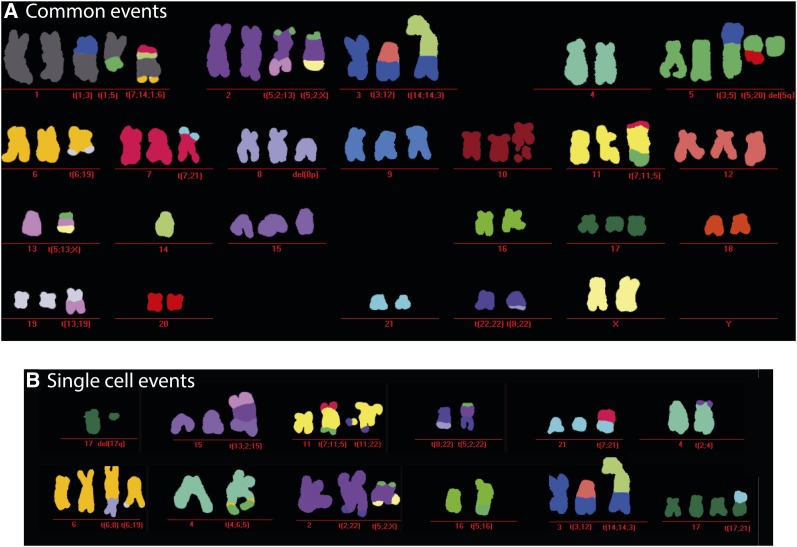
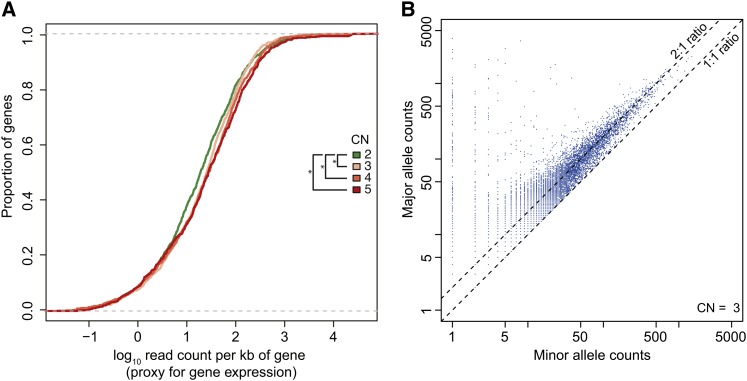
HeLa is the most widely used model cell line for studying human cellular and molecular biology. To date, no genomic reference for this cell line has been released, and experiments have relied on the human reference genome. Effective design and interpretation of molecular genetic studies performed using HeLa cells require accurate genomic information. Here we present a detailed genomic and transcriptomic characterization of a HeLa cell line. We performed DNA and RNA sequencing of a HeLa Kyoto cell line and analyzed its mutational portfolio and gene expression profile. Segmentation of the genome according to copy number revealed a remarkably high level of aneuploidy and numerous large structural variants at unprecedented resolution. Some of the extensive genomic rearrangements are indicative of catastrophic chromosome shattering, known as chromothripsis. Our analysis of the HeLa gene expression profile revealed that several pathways, including cell cycle and DNA repair, exhibit significantly different expression patterns from those in normal human tissues. Our results provide the first detailed account of genomic variants in the HeLa genome, yielding insight into their impact on gene expression and cellular function as well as their origins. This study underscores the importance of accounting for the strikingly aberrant characteristics of HeLa cells when designing and interpreting experiments, and has implications for the use of HeLa as a model of human biology.
Overview
The claims and statistics of this paper haven’t been checked yet.
Run the check — free, no account needed. It reads the open-access text and checks the sources it cites.
Integrity signals
Registry
Cites
Statistics
Figures
Verification
Claims the paper makes
The claims and statistics of this paper haven’t been checked yet.
Run the check — free, no account needed. It reads the open-access text and checks the sources it cites.
Claims other papers make about this one
Each is checked against this paper’s own text: does it say what the citing paper says it does?
In the citing paper
“Generally, various cell lines have revolutionized scientific investigations and have found applications in vaccine development, drug testing for metabolism and toxicity, generating antibodies, exploring gene functions, creating artificial tissues like synthetic skin, and producing biologic substances such as therapeutic proteins [16,19,26].”
From Cell Immortality: In Vitro Effective Techniques to Achieve and Investigate Its Applications and Challenges (2024) · cites this paper as [26]
In the citing paper
“Major discoveries have been made using this cell line, including the development of the polio vaccine in 1953 [25], the link between human papillomavirus (HPV) and cervical cancer, and the role of telomerase in chromosome maintenance [26].”
From Cell Immortality: In Vitro Effective Techniques to Achieve and Investigate Its Applications and Challenges (2024) · cites this paper as [26]
Self-check
Percentages, sums and reported differences re-computed from the paper’s own numbers.
The self-check needs the paper’s full text.
Citations
Cites
Hallmarks of Cancer: The Next Generation
Hanahan, D., & Weinberg, R. A. (2011) · Cell · doi:10.1016/j.cell.2011.02.013 · Cited by 66,590
Gene Ontology: tool for the unification of biology
Ashburner, M., Ball, C. A., Blake, J. A., Botstein, D., Butler, H., Cherry, J. M., Davis, A. P., Dolinski, K., Dwight, S. S., Eppig, J. T., et al. (2000) · Nature Genetics · doi:10.1038/75556 · Cited by 43,206
An integrated map of genetic variation from 1,092 human genomes
The 1000 Genomes Project Consortium (2012) · Nature · doi:10.1038/nature11632 · Cited by 7,711
The International HapMap Project
†The International HapMap Consortium, Genotyping centres: Baylor College of Medicine and ParAllele BioScience, Gibbs, R. A., Belmont, J. W., Hardenbol, P., Willis, T. D., Yu, F., Chinese HapMap Consortium, Yang, H., Ch'ang, L.-Y., et al. (2003) · Nature · doi:10.1038/nature02168 · Cited by 6,057
Landscape of transcription in human cells
Djebali, S., Davis, C. A., Merkel, A., Dobin, A., Lassmann, T., Mortazavi, A., Tanzer, A., Lagarde, J., Lin, W., Schlesinger, F., et al. (2012) · Nature · doi:10.1038/nature11233 · Cited by 5,187
Accurate whole human genome sequencing using reversible terminator chemistry
Bentley, D. R., Balasubramanian, S., Swerdlow, H. P., Smith, G. P., Milton, J., Brown, C. G., Hall, K. P., Evers, D. J., Barnes, C. L., Bignell, H. R., et al. (2008) · Nature · doi:10.1038/nature07517 · Cited by 3,684
Deep proteome and transcriptome mapping of a human cancer cell line
Nagaraj, N., Wisniewski, J. R., Geiger, T., Cox, J., Kircher, M., Kelso, J., Pääbo, S., & Mann, M. (2011) · Molecular Systems Biology · doi:10.1038/msb.2011.81 · Cited by 979
STUDIES ON THE PROPAGATION IN VITRO OF POLIOMYELITIS VIRUSES
Scherer, W. F., Syverton, J. T., & Gey, G. O. (1953) · Journal of Experimental Medicine · doi:10.1084/jem.97.5.695 · Cited by 856
Dissecting the genomic complexity underlying medulloblastoma
Jones, D. T. W., Jäger, N., Kool, M., Zichner, T., Hutter, B., Sultan, M., Cho, Y.-J., Pugh, T. J., Hovestadt, V., Stütz, A. M., et al. (2012) · Nature · doi:10.1038/nature11284 · Cited by 839
Self-citationAït Yahya-Graison, E., Aubert, J., Dauphinot, L., Rivals, I., Prieur, M., Golfier, G., Rossier, J., Personnaz, L., Créau, N., Bléhaut, H., et al. (2007) · The American Journal of Human Genetics · doi:10.1086/520000 · Cited by 338
Research works printed but not linked: 73
- Affymetrix ENCODE Transcriptome Project & Cold Spring Harbor Laboratory ENCODE Transcriptome Project, 2009, Post-transcriptional processing generates a diversity of 5′-modified long and short RNAs., Nature, 457, 1028, 10.1038/nature07759 · DOI
- Alekseev, 2009, Analysis of gene expression profiles in HeLa cells in response to overexpression or siRNA-mediated depletion of NASP., Reprod. Biol. Endocrinol., 7, 45, 10.1186/1477-7827-7-45 · DOI
- Anders, 2010, Differential expression analysis for sequence count data., Genome Biol., 11, R106, 10.1186/gb-2010-11-10-r106 · DOI · Paper page
- Bao, 2004, National center for biotechnology information viral genomes project., J. Virol., 78, 7291, 10.1128/JVI.78.14.7291-7298.2004 · DOI
- Bass, 2011, Genomic sequencing of colorectal adenocarcinomas identifies a recurrent VTI1A–TCF7L2 fusion., Nat. Genet., 43, 964, 10.1038/ng.936 · DOI
- Bauer, 2011, Model-based gene set analysis for Bioconductor., Bioinformatics, 27, 1882, 10.1093/bioinformatics/btr296 · DOI
- Berger, 2011, The genomic complexity of primary human prostate cancer., Nature, 470, 214, 10.1038/nature09744 · DOI
- Chakrabarti, 1998, Deletion mapping of endocrine tumors localizes a second tumor suppressor gene on chromosome band 11q13., Genes Chromosomes Cancer, 22, 130, 10.1002/(SICI)1098-2264(199806)22:2<130::AID-GCC7>3.0.CO;2-Y · DOI
- Chaudhry, 2002, Gene expression profiling of HeLa cells in G1 or G2 phases., Oncogene, 21, 1934, 10.1038/sj.onc.1205264 · DOI
- Chen, 1988, Re-evaluation of HeLa, HeLa S3, and HEp-2 karyotypes., Cytogenet. Cell Genet., 48, 19, 10.1159/000132579 · DOI
- Cheng, 2002, Mapping of nasopharyngeal carcinoma tumor-suppressive activity to a 1.8-megabase region of chromosome band 11q13., Genes Chromosomes Cancer, 34, 97, 10.1002/gcc.10048 · DOI
- Corver, 2011, Cervical carcinoma-associated fibroblasts are DNA diploid and do not show evidence for somatic genetic alterations., Cell Oncol (Dordr), 34, 553, 10.1007/s13402-011-0061-5 · DOI
- Deng, 2010, Genomic responses to abnormal gene dosage: the X chromosome improved on a common strategy., PLoS Biol., 8, e1000318, 10.1371/journal.pbio.1000318 · DOI
- Francke, 1973, The band patterns of twelve D 98-AH-2 marker chromosomes and their use for identification of intraspecific cell hybrids., Chromosoma, 41, 111, 10.1007/BF00284079 · DOI
- Fuchs, 2010, Clustering phenotype populations by genome-wide RNAi and multiparametric imaging., Mol. Syst. Biol., 6, 370, 10.1038/msb.2010.25 · DOI
- Geigl, 2006, Multiplex-fluorescence in situ hybridization for chromosome karyotyping., Nat. Protoc., 1, 1172, 10.1038/nprot.2006.160 · DOI
- Gey, 1952, Tissue culture studies of the proliferative capacity of cervical carcinoma and normal epithelium., Cancer Res., 12, 264
- Heneen, 1976, HeLa cells and their possible contamination of other cell lines: karyotype studies., Hereditas, 82, 217, 10.1111/j.1601-5223.1976.tb01560.x · DOI
- Hnilicová, 2011, Histone deacetylase activity modulates alternative splicing., PLoS ONE, 6, e16727, 10.1371/journal.pone.0016727 · DOI
- Jaluria, 2007, Enhancement of cell proliferation in various mammalian cell lines by gene insertion of a cyclin-dependent kinase homolog., BMC Biotechnol., 7, 71, 10.1186/1472-6750-7-71 · DOI · Paper page
- Jurka, 2005, Repbase Update, a database of eukaryotic repetitive elements., Cytogenet. Genome Res., 110, 462, 10.1159/000084979 · DOI
- Kaelbling, 1986, Suppression of tumorigenicity in somatic cell hybrids., Cytogenet. Genome Res., 41, 65, 10.1159/000132206 · DOI
- Kim, 2007, Ubiquitin-binding protein RAP80 mediates BRCA1-dependent DNA damage response., Science, 316, 1202, 10.1126/science.1139621 · DOI · Paper page
- Kittler, 2004, An endoribonuclease-prepared siRNA screen in human cells identifies genes essential for cell division., Nature, 432, 1036, 10.1038/nature03159 · DOI
- Kloosterman, 2011, Chromothripsis is a common mechanism driving genomic rearrangements in primary and metastatic colorectal cancer., Genome Biol., 12, R103, 10.1186/gb-2011-12-10-r103 · DOI · Paper page
- Koi, 1989, Normal human chromosome 11 suppresses tumorigenicity of human cervical tumor cell line SiHa., Mol. Carcinog., 2, 12, 10.1002/mc.2940020103 · DOI
- Koopman, 2000, Multiple genetic alterations cause frequent and heterogeneous human histocompatibility leukocyte antigen class I loss in cervical cancer., J. Exp. Med., 191, 961, 10.1084/jem.191.6.961 · DOI
- Korbel, 2007, Paired-end mapping reveals extensive structural variation in the human genome., Science, 318, 420, 10.1126/science.1149504 · DOI · Paper page
- Kraemer, 1974, On the nature of heteroploidy., Cold Spring Harb. Symp. Quant. Biol., 38, 133, 10.1101/SQB.1974.038.01.017 · DOI
- Krzywinski, 2009, Circos: an information aesthetic for comparative genomics., Genome Res., 19, 1639, 10.1101/gr.092759.109 · DOI
- Ludwig, 2005, Role of viral factor E3L in modified vaccinia virus ankara infection of human HeLa Cells: regulation of the virus life cycle and identification of differentially expressed host genes., J. Virol., 79, 2584, 10.1128/JVI.79.4.2584-2596.2005 · DOI
- Macville, 1999, Comprehensive and definitive molecular cytogenetic characterization of HeLa cells by spectral karyotyping., Cancer Res., 59, 141
- Magrangeas, 2011, Chromothripsis identifies a rare and aggressive entity among newly diagnosed multiple myeloma patients., Blood, 118, 675, 10.1182/blood-2011-03-344069 · DOI
- Maher, 2012, Chromothripsis and human disease: piecing together the shattering process., Cell, 148, 29, 10.1016/j.cell.2012.01.006 · DOI
- Mazur, 2012, RNAiAtlas: a database for RNAi (siRNA) libraries and their specificity., Database (Oxford), 2012, bas027, 10.1093/database/bas027 · DOI
- McKenna, 2010, The Genome Analysis Toolkit: a MapReduce framework for analyzing next-generation DNA sequencing data, 1297
- Mincheva, 1987, Chromosomal integration sites of human papillomavirus DNA in three cervical cancer cell lines mapped by in situ hybridization., Med. Microbiol. Immunol. (Berl.), 176, 245, 10.1007/BF00190531 · DOI
- Mitra, 1994, Allelotype analysis of cervical carcinoma., Cancer Res., 54, 4481
- Mullokandov, 1996, Genomic alterations in cervical carcinoma: losses of chromosome heterozygosity and human papilloma virus tumor status., Cancer Res., 56, 197
- Murray, 2004, Diverse and specific gene expression responses to stresses in cultured human cells., Mol. Biol. Cell, 15, 2361, 10.1091/mbc.e03-11-0799 · DOI · Paper page
- Nelson-Rees, 1980, Characteristics of HeLa strains: permanent vs. variable features., Cytogenet. Cell Genet., 27, 216, 10.1159/000131490 · DOI
- Neumann, 2010, Phenotypic profiling of the human genome by time-lapse microscopy reveals cell division genes., Nature, 464, 721, 10.1038/nature08869 · DOI
- Ng, 2003, SIFT: predicting amino acid changes that affect protein function., Nucleic Acids Res., 31, 3812, 10.1093/nar/gkg509 · DOI
- Oshimura, 1990, Transfer of a normal human chromosome 11 suppresses tumorigenicity of some but not all tumor cell lines., J. Cell. Biochem., 42, 135, 10.1002/jcb.240420304 · DOI
- Parkhomchuk, 2009, Transcriptome analysis by strand-specific sequencing of complementary DNA., Nucleic Acids Res., 37, e123, 10.1093/nar/gkp596 · DOI
- Pelkmans, 2005, Genome-wide analysis of human kinases in clathrin- and caveolae/raft-mediated endocytosis., Nature, 436, 78, 10.1038/nature03571 · DOI
- Popescu, 1989, Preferential sites for viral integration on mammalian genome., Cancer Genet. Cytogenet., 42, 157, 10.1016/0165-4608(89)90084-8 · DOI
- Rader, 1998, Cervical intraepithelial neoplasia III shows frequent allelic loss in 3p and 6p., Genes Chromosomes Cancer, 22, 57, 10.1002/(SICI)1098-2264(199805)22:1<57::AID-GCC8>3.0.CO;2-6 · DOI
- Rausch, 2012, DELLY: structural variant discovery by integrated paired-end and split-read analysis., Bioinformatics, 28, i333, 10.1093/bioinformatics/bts378 · DOI
- Rausch, 2012, Genome sequencing of pediatric medulloblastoma links catastrophic DNA rearrangements with TP53 mutations., Cell, 148, 59, 10.1016/j.cell.2011.12.013 · DOI · Paper page
- Ruess, 1993, HeLa D98/aH-2 studied by chromosome painting and conventional cytogenetical techniques., Chromosoma, 102, 473, 10.1007/BF00357102 · DOI
- Saxon, 1986, Introduction of human chromosome 11 via microcell transfer controls tumorigenic expression of HeLa cells., EMBO J., 5, 3461, 10.1002/j.1460-2075.1986.tb04670.x · DOI
- Schlattl, 2011, Relating CNVs to transcriptome data at fine resolution: assessment of the effect of variant size, type, and overlap with functional regions., Genome Res., 21, 2004, 10.1101/gr.122614.111 · DOI
- Sherry, 2001, dbSNP: the NCBI database of genetic variation., Nucleic Acids Res., 29, 308, 10.1093/nar/29.1.308 · DOI · Paper page
- Skloot, 2010, The Immortal Life of Henrietta Lacks
- Srivatsan, 1986, Implication of chromosome 11 in the suppression of neoplastic expression in human cell hybrids., Cancer Res., 46, 6174
- Srivatsan, 2002, Localization of deletion to a 300 Kb interval of chromosome 11q13 in cervical cancer., Oncogene, 21, 5631, 10.1038/sj.onc.1205698 · DOI
- Srivatsan, 1993, Deletion of chromosome 11 and of 14q sequences in neuroblastoma., Genes Chromosomes Cancer, 7, 32, 10.1002/gcc.2870070106 · DOI
- Stanbridge, 1981, Specific chromosome loss associated with the expression of tumorigenicity in human cell hybrids., Somatic Cell Genet., 7, 699, 10.1007/BF01538758 · DOI
- Steigemann, 2009, Aurora B-mediated abscission checkpoint protects against tetraploidization., Cell, 136, 473, 10.1016/j.cell.2008.12.020 · DOI
- Stephens, 2011, Massive genomic rearrangement acquired in a single catastrophic event during cancer development., Cell, 144, 27, 10.1016/j.cell.2010.11.055 · DOI · Paper page
- Stephens, 2009, Complex landscapes of somatic rearrangement in human breast cancer genomes., Nature, 462, 1005, 10.1038/nature08645 · DOI
- Tanaka, 1998, Analysis of loss of heterozygosity on chromosome 11 and infrequent inactivation of the MEN1 gene in sporadic pituitary adenomas., J. Clin. Endocrinol. Metab., 83, 2631
- Venkatraman, 2007, A faster circular binary segmentation algorithm for the analysis of array CGH data., Bioinformatics, 23, 657, 10.1093/bioinformatics/btl646 · DOI
- Venugopalan, 1998, Loss of heterozygosity in squamous cell carcinomas of the head and neck defines a tumor suppressor gene region on 11q13., Cancer Genet. Cytogenet., 104, 124, 10.1016/S0165-4608(97)00461-5 · DOI
- Vermeulen, 2005, Frequent HLA class I loss is an early event in cervical carcinogenesis., Hum. Immunol., 66, 1167, 10.1016/j.humimm.2005.10.011 · DOI
- Whitfield, 2002, Identification of genes periodically expressed in the human cell cycle and their expression in tumors., Mol. Biol. Cell, 13, 1977, 10.1091/mbc.02-02-0030 · DOI · Paper page
- Wu, 2008, Poly A-transcripts expressed in HeLa cells., PLoS ONE, 3, e2803, 10.1371/journal.pone.0002803 · DOI
- Wu, 2010, Fast and SNP-tolerant detection of complex variants and splicing in short reads., Bioinformatics, 26, 873, 10.1093/bioinformatics/btq057 · DOI · Paper page
- Ye, 2009, Pindel: a pattern growth approach to detect break points of large deletions and medium sized insertions from paired-end short reads., Bioinformatics, 25, 2865, 10.1093/bioinformatics/btp394 · DOI
- Yoon, 2010, Noncanonical transcript forms in yeast and their regulation during environmental stress., RNA, 16, 1256, 10.1261/rna.2038810 · DOI
- Zhu, 2005, Functional analysis of human microtubule-based motor proteins, the kinesins and dyneins, in mitosis/cytokinesis using RNA interference., Mol. Biol. Cell, 16, 3187, 10.1091/mbc.e05-02-0167 · DOI
- Zhuang, 1995, Identical allelic loss on chromosome 11q13 in microdissected in situ and invasive human breast cancer., Cancer Res., 55, 467
Cited by
Single-cell RNA-seq: advances and future challenges
Saliba, A.-E., Westermann, A. J., Gorski, S. A., & Vogel, J. (2014) · Nucleic Acids Research · doi:10.1093/nar/gku555 · Cited by 847
Multi-omic measurements of heterogeneity in HeLa cells across laboratories
Liu, Y., Mi, Y., Mueller, T., Kreibich, S., Williams, E. G., Van Drogen, A., Borel, C., Frank, M., Germain, P.-L., Bludau, I., et al. (2019) · Nature Biotechnology · doi:10.1038/s41587-019-0037-y · Cited by 338
Lightbody, G., Haberland, V., Browne, F., Taggart, L., Zheng, H., Parkes, E., & Blayney, J. K. (2019) · Briefings in Bioinformatics · doi:10.1093/bib/bby051 · Cited by 173
Lysosomal recruitment of TSC2 is a universal response to cellular stress
Demetriades, C., Plescher, M., & Teleman, A. A. (2016) · Nature Communications · doi:10.1038/ncomms10662 · Cited by 160
Generation and validation of homozygous fluorescent knock-in cells using CRISPR-Cas9 genome editing
Koch, B., Nijmeijer, B., Kueblbeck, M., Cai, Y., Walther, N., & Ellenberg, J. (2018) · Nature Protocols · doi:10.1038/nprot.2018.042 · Cited by 134
Experimental and computational framework for a dynamic protein atlas of human cell division
Cai, Y., Hossain, M. J., Hériché, J.-K., Politi, A. Z., Walther, N., Koch, B., Wachsmuth, M., Nijmeijer, B., Kueblbeck, M., Martinic-Kavur, M., et al. (2018) · Nature · doi:10.1038/s41586-018-0518-z · Cited by 121
Westhaus, A., Cabanes-Creus, M., Rybicki, A., Baltazar, G., Navarro, R. G., Zhu, E., Drouyer, M., Knight, M., Albu, R. F., Ng, B. H., et al. (2020) · Human Gene Therapy · doi:10.1089/hum.2019.264 · Cited by 102
Jedrzejczak-Silicka, M. (2017) · New Insights into Cell Culture Technology · doi:10.5772/66905 · Cited by 87
Chalak, M., Hesaraki, M., Mirbahari, S. N., Yeganeh, M., Abdi, S., Rajabi, S., & Hemmatzadeh, F. (2024) · Life · doi:10.3390/life14030417 · Cited by 66
Rajkowska, K., Nowak, A., Kunicka-Styczyńska, A., & Siadura, A. (2016) · RSC Advances · doi:10.1039/c6ra21108a · Cited by 55
Hudson, K. L., & Collins, F. S. (2013) · Nature · doi:10.1038/500141a · Cited by 52
Mapping genome-wide transcription factor binding sites in frozen tissues
Savic, D., Gertz, J., Jain, P., Cooper, G. M., & Myers, R. M. (2013) · Epigenetics & Chromatin · doi:10.1186/1756-8935-6-30 · Cited by 31
CeL-ID: cell line identification using RNA-seq data
Mohammad, T. A., Tsai, Y. S., Ameer, S., Chen, H.-I. H., Chiu, Y.-C., & Chen, Y. (2019) · BMC Genomics · doi:10.1186/s12864-018-5371-9 · Cited by 19
Forés-Martos, J., Forte, A., García-Martínez, J., & Pérez-Ortín, J. E. (2021) · Cells · doi:10.3390/cells10020334 · Cited by 8
Metadata
- Authors
- Landry, J. J. M., Pyl, P. T., Rausch, T., Zichner, T., Tekkedil, M. M., Stütz, A. M., Jauch, A., Aiyar, R. S., Pau, G., Delhomme, N., Gagneur, J., Korbel, J. O., Huber, W., & Steinmetz, L. M.
- Affiliations
- European Molecular Biology Laboratory, Genome Biology Unit, 69117 Heidelberg, Germany
- University Hospital Heidelberg, Institute of Human Genetics, 69120 Heidelberg, Germany
- Venue
- G3 Genes|Genomes|Genetics
- Publisher
- Oxford University Press (OUP)
- Published
- 2013-08-01
- Volume
- 3
- Issue
- 8
- Pages
- 1213-1224
- ISSN
- 2160-1836
- PMC
- PMC3737162
- Cited by
- 416
- References
- 10
- Language
- en
About these checks
Registry, retraction, Cites and statistics results are computed, not judged, with one exception: a printed reference that no index lists is read once by a model before it counts as a citation error. Claims are extracted by a model and kept only when their quote appears verbatim in the text; each cited source is then checked, with a model’s help, for whether it says what the claim relies on. Those verdicts can be wrong — read the claim’s quote and the cited source before relying on one.
Statistics and arithmetic are recomputed, not judged.
Confidence bands are shown only for fields calibrated on our annotated test set. None is calibrated yet, so no band is shown.
What counts as a claim ›How we measure confidence ›How we check this ›
Are you an author, or do you see a problem with this page? Request a review
