

The DOI matches its Crossref record; 27 of the 29 references it cites were found in a registry or an index.
Suicide Trends Among and Within Urbanization Levels by Sex, Race/Ethnicity, Age Group, and Mechanism of Death—United States, 2001–2015
Open accessAbstract
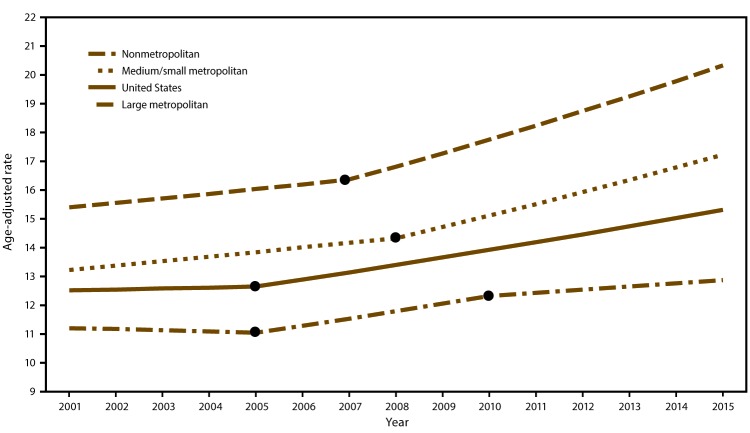
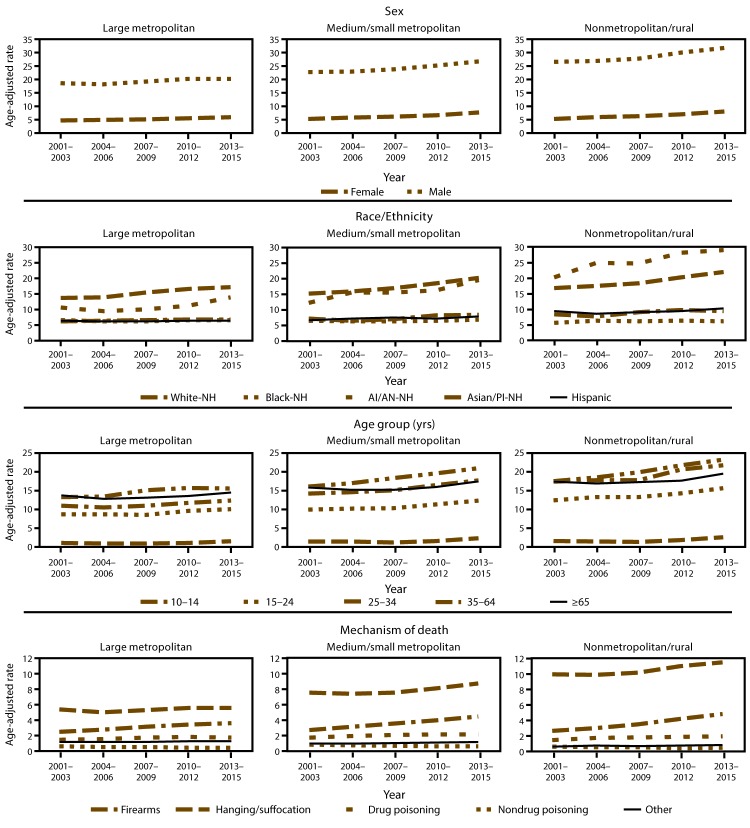
PROBLEM/CONDITION: Suicide is a public health problem and one of the top 10 leading causes of death in the United States. Substantial geographic variations in suicide rates exist, with suicides in rural areas occurring at much higher rates than those occurring in more urban areas. Understanding demographic trends and mechanisms of death among and within urbanization levels is important to developing and targeting future prevention efforts. REPORTING PERIOD: 2001-2015. DESCRIPTION OF SYSTEM: Mortality data from the National Vital Statistics System (NVSS) include demographic, geographic, and cause of death information derived from death certificates filed in the 50 states and the District of Columbia. NVSS was used to identify suicide deaths, defined by International Classification of Diseases, 10th Revision (ICD-10) underlying cause of death codes X60-X84, Y87.0, and U03. This report examines annual county level trends in suicide rates during 2001-2015 among and within urbanization levels by select demographics and mechanisms of death. Counties were collapsed into three urbanization levels using the 2006 National Center for Health Statistics classification scheme. RESULTS: Suicide rates increased across the three urbanization levels, with higher rates in nonmetropolitan/rural counties than in medium/small or large metropolitan counties. Each urbanization level experienced substantial annual rate changes at different times during the study period. Across urbanization levels, suicide rates were consistently highest for men and non-Hispanic American Indian/Alaska Natives compared with rates for women and other racial/ethnic groups; however, rates were highest for non-Hispanic whites in more metropolitan counties. Trends indicate that suicide rates for non-Hispanic blacks were lowest in nonmetropolitan/rural counties and highest in more urban counties. Increases in suicide rates occurred for all age groups across urbanization levels, with the highest rates for persons aged 35-64 years. For mechanism of death, greater increases in rates of suicide by firearms and hanging/suffocation occurred across all urbanization levels; rates of suicide by firearms in nonmetropolitan/rural counties were almost two times that of rates in larger metropolitan counties. INTERPRETATION: Suicide rates in nonmetropolitan/rural counties are consistently higher than suicide rates in metropolitan counties. These trends also are observed by sex, race/ethnicity, age group, and mechanism of death. PUBLIC HEALTH ACTION: Interventions to prevent suicides should be ongoing, particularly in rural areas. Comprehensive suicide prevention efforts might include leveraging protective factors and providing innovative prevention strategies that increase access to health care and mental health care in rural communities. In addition, distribution of socioeconomic factors varies in different communities and needs to be better understood in the context of suicide prevention.
Overview
The claims and statistics of this paper haven’t been checked yet.
Run the check — free, no account needed. It reads the open-access text and checks the sources it cites.
Integrity signals
Registry
Cites
Statistics
Figures
Verification
Claims the paper makes
The claims and statistics of this paper haven’t been checked yet.
Run the check — free, no account needed. It reads the open-access text and checks the sources it cites.
Claims other papers make about this one
Each is checked against this paper’s own text: does it say what the citing paper says it does?
The check wasn’t confident either way, so it gives no verdict — never disputed.
In the citing paper
“However, the WHO highlights that some risk factors, such as harmful use of alcohol and substance use disorders, contribute to suicide ideation in all age groups [14,53].”
From Toxicological Findings of Self-Poisoning Suicidal Deaths: A Systematic Review by Countries (2022) · cites this paper as [53]
Experimental — accuracy not yet measuredThe check wasn’t confident either way, so it gives no verdict — never disputed.
In the citing paper
“The young age of the victims correlates with their vulnerability and impulsiveness and their easy access to toxic drugs [52,53].”
From Toxicological Findings of Self-Poisoning Suicidal Deaths: A Systematic Review by Countries (2022) · cites this paper as [53]
Experimental — accuracy not yet measured
Self-check
Percentages, sums and reported differences re-computed from the paper’s own numbers.
The self-check needs the paper’s full text.
Citations
Cites
2013 NCHS Urban-Rural Classification Scheme for Counties.
Ingram, D. D., & Franco, S. J. (2012) · PubMed · Cited by 1,523
Mortality and Morbidity in the 21st Century
Case, A., & Deaton, A. (2017) · Brookings Papers on Economic Activity · doi:10.1353/eca.2017.0005 · Cited by 1,448
(2016) · PubMed · Cited by 580
Wyman, P. A., Brown, C. H., LoMurray, M., Schmeelk-Cone, K., Petrova, M., Yu, Q., Walsh, E., Tu, X., & Wang, W. (2010) · American Journal of Public Health · doi:10.2105/ajph.2009.190025 · Cited by 536
Suicide and Suicidal Attempts in the United States: Costs and Policy Implications
Shepard, D. S., Gurewich, D., Lwin, A. K., Reed, G. A., & Silverman, M. M. (2016) · Suicide and Life-Threatening Behavior · doi:10.1111/sltb.12225 · Cited by 413
Cunningham, T. J., Croft, J. B., Liu, Y., Lu, H., Eke, P. I., & Giles, W. H. (2017) · MMWR. Morbidity and Mortality Weekly Report · doi:10.15585/mmwr.mm6617e1 · Cited by 394
Widening Rural-Urban Disparities in Youth Suicides, United States, 1996-2010
Fontanella, C. A., Steelesmith, D. L., Phillips, G. S., Bridge, J. A., Lester, N. A., Sweeney, H. A., & Campo, J. V. (2015) · Archives of Pediatrics and Adolescent Medicine · doi:10.1001/jamapediatrics.2014.3561 · Cited by 378
Goldney, R. D. (2008) · Cited by 306
Townsend, L. C., Sathiaseelan, A., Fairhurst, G., & Wallace, C. (2013) · Local Economy The Journal of the Local Economy Policy Unit · doi:10.1177/0269094213496974 · Cited by 288
The reliability of suicide statistics: a systematic review
Tøllefsen, I. M., Hem, E., & Ekeberg, Ø. (2012) · BMC Psychiatry · doi:10.1186/1471-244x-12-9 · Cited by 223
Cited by
Sorted by citations
Stone, D. M., Simon, T. R., Fowler, K. A., Kegler, S. R., Yuan, K., Holland, K. M., Ivey-Stephenson, A. Z., & Crosby, A. E. (2018) · MMWR. Morbidity and Mortality Weekly Report · doi:10.15585/mmwr.mm6722a1 · Cited by 634
Self-citationSuicidal Thoughts and Behaviors Among Adults Aged ≥18 Years — United States, 2015–2019
Ivey-Stephenson, A. Z., Crosby, A. E., Hoenig, J. M., Gyawali, S., Park-Lee, E., & Hedden, S. L. (2022) · MMWR. Surveillance Summaries · doi:10.15585/mmwr.ss7101a1 · Cited by 512
Self-citationA call to action to address rural mental health disparities
Morales, D. A., Barksdale, C. L., & Beckel-Mitchener, A. C. (2020) · Journal of Clinical and Translational Science · doi:10.1017/cts.2020.42 · Cited by 494
Hales, C. M., Fryar, C. D., Carroll, M. D., Freedman, D. S., Aoki, Y., & Ogden, C. L. (2018) · JAMA · doi:10.1001/jama.2018.7270 · Cited by 430
Harrington, R. A., Califf, R. M., Balamurugan, A., Brown, N., Benjamin, R. M., Braund, W. E., Hipp, J. S., Konig, M., Sánchez, E., & Maddox, K. E. J. (2020) · Circulation · doi:10.1161/cir.0000000000000753 · Cited by 393
Suicide Case-Fatality Rates in the United States, 2007 to 2014: A Nationwide Population-Based Study
Conner, A., Azrael, D., & Miller, M. (2019) · Annals of Internal Medicine · doi:10.7326/m19-1324 · Cited by 286
Feiss, R., Dolinger, S. B., Merritt, M., Reiche, E., Martin, K., Yanes, J. A., Thomas, C. M., & Pangelinan, M. (2019) · Journal of Youth and Adolescence · doi:10.1007/s10964-019-01085-0 · Cited by 252
Bernert, R. A., Hilberg, A. M., Melia, R., Kim, J. P., Shah, N. H., & Abnousi, F. (2020) · International Journal of Environmental Research and Public Health · doi:10.3390/ijerph17165929 · Cited by 243
Male and Female Physician Suicidality
Duarte, D. G. G., El-Hagrassy, M. M., Couto, T. C. E., Gurgel, W. D. S., Fregni, F., & Corrêa, H. (2020) · JAMA Psychiatry · doi:10.1001/jamapsychiatry.2020.0011 · Cited by 175
Reducing Suicidal Ideation Through Insomnia Treatment (REST-IT): A Randomized Clinical Trial
McCall, W. V., Benca, R. M., Rosenquist, P. B., Youssef, N. A., McCloud, L., Newman, J. C., Case, D., Rumble, M. E., Szabo, S. T., Phillips, M., et al. (2019) · American Journal of Psychiatry · doi:10.1176/appi.ajp.2019.19030267 · Cited by 157
Maternal drug-related death and suicide are leading causes of postpartum death in California
Goldman-Mellor, S. J., & Margerison, C. E. (2019) · American Journal of Obstetrics and Gynecology · doi:10.1016/j.ajog.2019.05.045 · Cited by 165
Declining Life Expectancy in the United States: Missing the Trees for the Forest
Harper, S., Riddell, C. A., & King, N. B. (2021) · Annual Review of Public Health · doi:10.1146/annurev-publhealth-082619-104231 · Cited by 144
Daugherty, J., Waltzman, D., Sarmiento, K., & Xu, L. (2019) · MMWR Morbidity and Mortality Weekly Report · doi:10.15585/mmwr.mm6846a2 · Cited by 145
Identification of Suicide Attempt Risk Factors in a National US Survey Using Machine Learning
de la Garza, Á. G., Blanco, C., Olfson, M., & Wall, M. M. (2021) · JAMA Psychiatry · doi:10.1001/jamapsychiatry.2020.4165 · Cited by 146
Suicide Risk Assessment and Prevention: Challenges and Opportunities
Ryan, E. P., & Oquendo, M. A. (2020) · FOCUS The Journal of Lifelong Learning in Psychiatry · doi:10.1176/appi.focus.20200011 · Cited by 160
Rural–urban mental health disparities in the United States during COVID-19.
Summers, N. (2020) · Psychological Trauma Theory Research Practice and Policy · doi:10.1037/tra0000871 · Cited by 117
Spiller, H. A., Ackerman, J. P., Smith, G. A., Kistamgari, S., Funk, A. R., McDermott, M. R., & Casavant, M. J. (2020) · Clinical Toxicology · doi:10.1080/15563650.2019.1665182 · Cited by 110
Association of Restrictive Housing During Incarceration With Mortality After Release
Brinkley‐Rubinstein, L., Sivaraman, J. J. C., Rosen, D. L., Cloud, D. H., Junker, G., Proescholdbell, S., Shanahan, M. E., & Ranapurwala, S. I. (2019) · JAMA Network Open · doi:10.1001/jamanetworkopen.2019.12516 · Cited by 103
Using the tools of genetic epidemiology to understand sex differences in neuropsychiatric disorders
Merikangas, A. K., & Almasy, L. (2020) · Genes, Brain and Behavior · doi:10.1111/gbb.12660 · Cited by 82
Shiels, M. S., Tatalovich, Z., Chen, Y., Haozous, E. A., Hartge, P. A., Nápoles, A. M., Pérez‐Stable, E. J., Rodriquez, E. J., Spillane, S., Thomas, D. A., et al. (2020) · JAMA Network Open · doi:10.1001/jamanetworkopen.2020.16217 · Cited by 78
Schmutte, T. J., & Wilkinson, S. T. (2020) · American Journal of Preventive Medicine · doi:10.1016/j.amepre.2019.11.001 · Cited by 74
Trends in Firearm Injuries Among Children and Teenagers in the United States
Olufajo, O. A., Zeineddin, A., Nonez, H., Okorie, N., Cruz, E. D. L., Cornwell, E. E., & Williams, M. (2019) · Journal of Surgical Research · doi:10.1016/j.jss.2019.07.056 · Cited by 72
Rural-Urban Mortality Disparities: Variations Across Causes of Death and Race/Ethnicity, 2013–2017
Probst, J. C., Zahnd, W. E., Hung, P., Eberth, J. M., Crouch, E. L., & Merrell, M. A. (2020) · American Journal of Public Health · doi:10.2105/ajph.2020.305703 · Cited by 72
A Systematic Review of Factors Impacting Suicide Risk Among Rural Adults in the United States
Mohatt, N. V., Kreisel, C. J., Hoffberg, A. S., Wendleton, L., & Beehler, S. (2020) · The Journal of Rural Health · doi:10.1111/jrh.12532 · Cited by 74
Forrest, L. N., Beccia, A. L., Exten, C. L., Gehman, S., & Ansell, E. B. (2023) · JAMA Psychiatry · doi:10.1001/jamapsychiatry.2023.2295 · Cited by 74
Rural Versus Urban Hospitalizations for Firearm Injuries in Children and Adolescents
Herrin, B. R., Gaither, J. R., Leventhal, J. M., & Dodington, J. M. (2018) · PEDIATRICS · doi:10.1542/peds.2017-3318 · Cited by 69
Okubo, R., Yoshioka, T., Nakaya, T., Hanibuchi, T., Okano, H., Ikezawa, S., Tsuno, K., Murayama, H., & Tabuchi, T. (2021) · Journal of Affective Disorders · doi:10.1016/j.jad.2021.03.028 · Cited by 67
Air pollution and suicide in rural and urban America: Evidence from wildfire smoke
Molitor, D., Mullins, J. T., & White, C. (2023) · Proceedings of the National Academy of Sciences · doi:10.1073/pnas.2221621120 · Cited by 71
Osazuwa-Peters, N., Barnes, J., Okafor, S., Taylor, D. B., Hussaini, A., Boakye, E. A., Simpson, M., Graboyes, E., & Lee, W. T. (2021) · JAMA Otolaryngology - Head and Neck Surgery · doi:10.1001/jamaoto.2021.1728 · Cited by 50
An Analysis of Suicide Risk Factors among Farmers in the Midwestern United States
Bjornestad, A. G., Cuthbertson, C. A., & Hendricks, J. (2021) · International Journal of Environmental Research and Public Health · doi:10.3390/ijerph18073563 · Cited by 64
Culturally responsive assessment of suicidal thoughts and behaviors in youth of color
Molock, S. D., Boyd, R. C., Alvarez, K., Cha, C., Denton, E.-G., Glenn, C. R., Katz, C. C., Mueller, A. S., Meca, A., Meza, J. I., et al. (2023) · American Psychologist · doi:10.1037/amp0001140 · Cited by 58
Toxicological Findings of Self-Poisoning Suicidal Deaths: A Systematic Review by Countries
Albano, G. D., Malta, G., La Spina, C., Rifiorito, A., Provenzano, V., Triolo, V., Vaiano, F., Bertol, E., Zerbo, S., & Argo, A. (2022) · Toxics · doi:10.3390/toxics10110654 · Cited by 58
Recent trends in the rural–urban suicide disparity among veterans using VA health care
Shiner, B. R., Peltzman, T., Cornelius, S. L., Gui, J., Forehand, J. A., & Watts, B. V. (2020) · Journal of Behavioral Medicine · doi:10.1007/s10865-020-00176-9 · Cited by 57
Sex-specific and age-specific suicide mortality by method in 58 countries between 2000 and 2015
Wu, Y., Schwebel, D. C., Huang, Y., Ning, P., Cheng, P., & Hu, G. (2020) · Injury Prevention · doi:10.1136/injuryprev-2019-043601 · Cited by 60
Eisenlohr-Moul, T. A., Divine, M., Schmalenberger, K. M., Murphy, L. L., Buchert, B., Wagner-Schuman, M. L., Kania, A., Raja, S., Miller, A. B., Barone, J., et al. (2022) · BMC Psychiatry · doi:10.1186/s12888-022-03851-0 · Cited by 62
Disparities in traumatic brain injury-related deaths—United States, 2020
Peterson, A. B., Zhou, H., & Thomas, K. E. (2022) · Journal of Safety Research · doi:10.1016/j.jsr.2022.10.001 · Cited by 55
Firearm Legislation Stringency and Firearm-Related Fatalities among Children in the US
Madhavan, S., Taylor, J. S., Chandler, J. M., Staudenmayer, K., & Chao, S. D. (2019) · Journal of the American College of Surgeons · doi:10.1016/j.jamcollsurg.2019.02.055 · Cited by 53
Assini‐Meytin, L. C., Fix, R. L., Green, K. M., Nair, R., & Letourneau, E. J. (2021) · Journal of Child & Adolescent Trauma · doi:10.1007/s40653-021-00424-3 · Cited by 56
Public Libraries as Partners in Telemedicine Delivery: A Review and Research Agenda
DeGuzman, P. B., Jain, N., & Loureiro, C. G. (2021) · Public Library Quarterly · doi:10.1080/01616846.2021.1877080 · Cited by 48
Decomposing Mortality Disparities in Urban and Rural U.S. Counties
Spencer, J. C., Wheeler, S. B., Rotter, J., & Holmes, M. (2018) · Health Services Research · doi:10.1111/1475-6773.12982 · Cited by 46
Disparities in Firearm Injury: Consequences of Structural Violence
Boeck, M. A., Strong, B. L., & Campbell, A. R. (2020) · Current Trauma Reports · doi:10.1007/s40719-020-00188-5 · Cited by 44
Historical prevalence of slavery predicts contemporary American gun ownership
Buttrick, N. R., & Mazen, J. A. M. (2022) · PNAS Nexus · doi:10.1093/pnasnexus/pgac117 · Cited by 43
Declines In Pediatric Mortality Fall Short For Rural US Children
Probst, J. C., Zahnd, W. E., & Breneman, C. B. (2019) · Health Affairs · doi:10.1377/hlthaff.2019.00892 · Cited by 43
Before and During Pandemic Telemedicine Use: An Analysis of Rural and Urban Safety-Net Clinics
Larson, A. E., Zahnd, W. E., Davis, M. M., Stange, K. C., Yoon, J., Heintzman, J. D., & Harvey, S. M. (2022) · American Journal of Preventive Medicine · doi:10.1016/j.amepre.2022.06.012 · Cited by 40
Tran, F., & Morrison, C. N. (2020) · Spatial and Spatio-temporal Epidemiology · doi:10.1016/j.sste.2020.100359 · Cited by 38
Geographic Disparities in the Availability of Mental Health Services in U.S. Public Schools
Graves, J. M., Abshire, D. A., Mackelprang, J. L., Dilley, J. A., Amiri, S., Chacon, C. M., & Mason, A. (2022) · American Journal of Preventive Medicine · doi:10.1016/j.amepre.2022.09.003 · Cited by 36
Traumatic Brain Injury–Related Hospitalizations and Deaths in Urban and Rural Counties—2017
Daugherty, J., Sarmiento, K., Waltzman, D., & Xu, L. (2021) · Annals of Emergency Medicine · doi:10.1016/j.annemergmed.2021.09.433 · Cited by 36
Each post matters: a content analysis of #mentalhealth images on Instagram
Lee, N., Buchanan, K., & Yu, M. (2020) · Journal of Visual Communication in Medicine · doi:10.1080/17453054.2020.1781535 · Cited by 40
Does population density moderate suicide risk? An Italian population study over the last 30 years
Vichi, M., Vitiello, B., Ghirini, S., & Pompili, M. (2020) · European Psychiatry · doi:10.1192/j.eurpsy.2020.69 · Cited by 35
Comparative risk of suicide by specific substance use disorders: A national cohort study
Crump, C., Sundquist, J., Kendler, K. S., Edwards, A. C., & Sundquist, K. (2021) · Journal of Psychiatric Research · doi:10.1016/j.jpsychires.2021.10.017 · Cited by 35
Morrison, K., & Hopkins, R. (2018) · Journal of Black Psychology · doi:10.1177/0095798418813511 · Cited by 31
Filippelli, G. M., Freeman, J. L., Gibson, P. J., Jay, S. J., Moreno-Madriñán, M. J., Ogashawara, I., Rosenthal, F. S., Wang, Y., & Wells, E. M. (2020) · Climatic Change · doi:10.1007/s10584-020-02710-9 · Cited by 32
African American adolescent suicidal ideation and behavior: The role of racism and prevention
Robinson, W. L., Whipple, C. R., Jason, L. A., & Flack, C. E. (2021) · Journal of Community Psychology · doi:10.1002/jcop.22543 · Cited by 32
Snell-Rood, C., & Carpenter-Song, E. (2018) · Social Science & Medicine (1967) · doi:10.1016/j.socscimed.2018.10.012 · Cited by 27
DeGuzman, P. B., Vogel, D. L., Bernacchi, V., Scudder, M. A., & Jameson, M. J. (2022) · JMIR Formative Research · doi:10.2196/33262 · Cited by 28
Woolf, S. H. (2025) · PEDIATRICS · doi:10.1542/peds.2025-070849 · Cited by 33
Wiglesworth, A., Clement, D. N., Wingate, L. R., & Klimes‐Dougan, B. (2022) · Suicide and Life-Threatening Behavior · doi:10.1111/sltb.12851 · Cited by 33
Walters, J. E. (2019) · Human Services Organizations Management Leadership & Governance · doi:10.1080/23303131.2019.1696909 · Cited by 27
A Systematic Review of School Teleconsultation: Implications for Research and Practice
King, H. C., Bloomfield, B. S., Wu, S., & Fischer, A. J. (2021) · School Psychology Review · doi:10.1080/2372966x.2021.1894478 · Cited by 27
Grocke-Dewey, M., Hardison‐Moody, A., Haynes‐Maslow, L., Maras, S. A., Webber, E. J., Andress, L., Houghtaling, B., Patton-López, M. M., Shanks, J. D., & Shanks, C. B. (2021) · Preventive Medicine Reports · doi:10.1016/j.pmedr.2021.101537 · Cited by 27
Rurality as a Risk Factor for Attempted Suicide and Death by Suicide in Ontario, Canada
Barry, R., Rehm, J. T., de Oliveira, C., Gozdyra, P., Chen, S., & Kurdyak, P. A. (2021) · The Canadian Journal of Psychiatry · doi:10.1177/07067437211053300 · Cited by 27
Posamentier, J., Seibel, K., & DyTang, N. (2022) · Trauma Violence & Abuse · doi:10.1177/15248380211039475 · Cited by 38
Urban Scaling of Health Outcomes: a Scoping Review
McCulley, E. M., Mullachery, P. H., Ortigoza, A. F., Rodrı́guez, D. A., Roux, A. V. D., & Bilal, U. (2022) · Journal of Urban Health · doi:10.1007/s11524-021-00577-4 · Cited by 29
Suicide among adolescents in Italy: a nationwide cohort study of the role of family characteristics
Grande, E., Vichi, M., Alicandro, G., Simeoni, S., Murianni, L., Marchetti, S., Zengarini, N., Frova, L., & Pompili, M. (2020) · European Child & Adolescent Psychiatry · doi:10.1007/s00787-020-01591-8 · Cited by 27
Assessment of county-level proxy variables for household firearm ownership
Haviland, M. J., Gause, E. L., Rivara, F. P., Bowen, A. G., Hanron, A. E., & Rowhani‐Rahbar, A. (2021) · Preventive Medicine · doi:10.1016/j.ypmed.2021.106571 · Cited by 26
Samples, H., Cruz, N., Corr, A., & Akkas, F. (2024) · Psychiatric Services · doi:10.1176/appi.ps.20230466 · Cited by 36
Kearsey, E. O. R., Been, J. V., Souter, V., & Stock, S. J. (2022) · American Journal of Obstetrics and Gynecology · doi:10.1016/j.ajog.2022.03.037 · Cited by 25
Achieving health equity in US suicides: a narrative review and commentary
Perry, S. W., Rainey, J. C., Allison, S. C., Bastiampillai, T. J., Wong, M., Licinio, J., Sharfstein, S. S., & Wilcox, H. C. (2022) · BMC Public Health · doi:10.1186/s12889-022-13596-w · Cited by 31
Projecting the Suicide Burden of Climate Change in the United States
Belova, A., Gould, C. A., Munson, K., Howell, M., Trevisan, C., Obradovich, N., & Martinich, J. A. (2022) · GeoHealth · doi:10.1029/2021gh000580 · Cited by 21
Understanding Mental Health Organizations’ Instagram Through Visuals: A Content Analysis
Jia, M.-Y., Ju, R., & Zhu, J. (2023) · Health Communication · doi:10.1080/10410236.2023.2185350 · Cited by 21
Vakkalanka, J. P., Harland, K. K., Wittrock, A., Schmidt, M., Mack, L. J., Nipe, M., Himadi, E., Ward, M. M., & Mohr, N. M. (2019) · Journal of Epidemiology & Community Health · doi:10.1136/jech-2019-212623 · Cited by 22
McCall, W. V., Rosenquist, P. B., & Miller, B. J. (2022) · Current Psychiatry Reports · doi:10.1007/s11920-022-01315-6 · Cited by 21
Lee, S., Lee, R. J., & Scherr, S. (2022) · Landscape and Urban Planning · doi:10.1016/j.landurbplan.2022.104606 · Cited by 21
Screening for suicide risk in adult sleep patients
Drapeau, C. W., Nadorff, M. R., McCall, W. V., Titus, C. E., Barclay, N., & Payne, A. (2019) · Sleep Medicine Reviews · doi:10.1016/j.smrv.2019.03.009 · Cited by 24
Ali, B., Rockett, I. R. H., & Miller, T. R. (2019) · Archives of Suicide Research · doi:10.1080/13811118.2019.1661894 · Cited by 21
Unemployment insurance program accessibility and suicide rates in the United States
Kaufman, J. A., Livingston, M. D., & Komro, K. A. (2020) · Preventive Medicine · doi:10.1016/j.ypmed.2020.106318 · Cited by 21
Suicide Among American Indian and Alaska Native Veterans Who Use Veterans Health Administration Care
Mohatt, N. V., Hoffmire, C. A., Schneider, A. L., Goss, C. W., Shore, J. H., Spark, T. L., & Kaufman, C. E. (2021) · Medical Care · doi:10.1097/mlr.0000000000001656 · Cited by 21
Innovative Directions to Advance Mental Health Disparities Research
Barksdale, C. L., Pérez‐Stable, E. J., & Gordon, J. A. (2022) · American Journal of Psychiatry · doi:10.1176/appi.ajp.21100972 · Cited by 24
Alqahtani, S., Nehme, Z., Williams, B. A., Bernard, S. A., & Smith, K. L. (2019) · Prehospital Emergency Care · doi:10.1080/10903127.2019.1666944 · Cited by 20
Suicide attempts in patients with head and neck cancer in Taiwan
Sun, L., Lin, C., Shen, W., & Kao, C. (2020) · Psycho-Oncology · doi:10.1002/pon.5373 · Cited by 19
Dawood, M. H., Fazli, Y., Lund, S., Qazi, S. U., Tahir, R., Masood, A. Z., Qureshi, A. A., Safdar, S., Zaheer, H., & Chaychi, M. T. M. (2025) · BMC Public Health · doi:10.1186/s12889-025-21657-z · Cited by 18
Verlenden, J., Naser, S. C., & Brown, J. S. (2020) · Journal of Applied School Psychology · doi:10.1080/15377903.2020.1780660 · Cited by 24
Rural–Urban Comparisons in the Rates of Self-Harm, U.S., 2018
Wang, J., Brown, M. M., Ivey-Stephenson, A. Z., Xu, L., & Stone, D. M. (2022) · American Journal of Preventive Medicine · doi:10.1016/j.amepre.2021.12.018 · Cited by 18
Self-citationDifferential impact in suicide mortality during the COVID-19 pandemic in Brazil
Ornell, F. R., Bumaguin, D. B., Borelli, W. V., Narvaez, J. C. D. M., Moura, H. F., Passos, I. C., Sordi, A. O., Schuch, J. B., Kessler, F. H. P., Scherer, J. N., et al. (2022) · Brazilian Journal of Psychiatry · doi:10.47626/1516-4446-2022-2581 · Cited by 18
School-Wide Positive Behavior Support Telecoaching in a Rural District
McDaniel, S. C., & Bloomfield, B. S. (2020) · Journal of Educational Technology Systems · doi:10.1177/0047239519886283 · Cited by 17
Opioid Crisis in the Rural U.S.
Monnat, S. M. (2020) · National symposium on family issues · doi:10.1007/978-3-030-37689-5_5 · Cited by 18
Roles of peer specialists and use of mental health services among youth with serious mental illness
Ojeda, V. D., Jones, N., Munson, M. R., Berliant, E., & Gilmer, T. (2020) · Early Intervention in Psychiatry · doi:10.1111/eip.13036 · Cited by 21
Youssef, N. A., Ravilla, D., Patel, C., Yassa, M., Sadek, R., Zhang, L. F., McCloud, L., McCall, W. V., & Rosenquist, P. B. (2019) · Brain Sciences · doi:10.3390/brainsci9050099 · Cited by 17
Moral injury and suicidal ideation among health professionals: The role of mental health
He, Z., Lei, Q., Hu, X., Xiong, M., Liu, J., Wen, J., Shi, X., & Wang, Z. (2023) · Journal of Affective Disorders · doi:10.1016/j.jad.2023.04.033 · Cited by 17
Ghadipasha, M., Talaie, R., Mahmoodi, Z., Karimi, S. E., Forouzesh, M., Morsalpour, M., Mahdavi, S. A., Mousavi, S. S., Ashrafiesfahani, S., Kordrostami, R., et al. (2024) · Frontiers in Psychiatry · doi:10.3389/fpsyt.2024.1261621 · Cited by 19
LeCloux, M., Weimer, M., Culp, S., Bjorkgren, K., Service, S. K., & Campo, J. V. (2020) · Psychosomatics · doi:10.1016/j.psym.2020.05.002 · Cited by 17
Intersections of Firearm Suicide, Drug-Related Mortality, and Economic Dependency in Rural America
Kalesan, B., Zhao, S., Poulson, M. R., Neufeld, M. Y., Dechert, T. A., Siracuse, J. J., Zuo, Y., & Li, F. (2020) · Journal of Surgical Research · doi:10.1016/j.jss.2020.06.011 · Cited by 17
LeCloux, M., Aguinaldo, L. D., Lanzillo, E. C., & Horowitz, L. M. (2020) · The Journal of Rural Health · doi:10.1111/jrh.12508 · Cited by 17
“A country boy can survive:” Rural culture and male-targeted suicide prevention messaging
Ewert, R. (2021) · Social Science & Medicine · doi:10.1016/j.socscimed.2021.114439 · Cited by 16
Mukherjee, S., & Wei, Z. (2021) · PLoS ONE · doi:10.1371/journal.pone.0258824 · Cited by 17
Suicide Evaluation in the Pediatric Emergency Setting
Ambrose, A. J. H., & Prager, L. M. (2018) · Child and Adolescent Psychiatric Clinics of North America · doi:10.1016/j.chc.2018.03.003 · Cited by 16
Youssef, N. A., George, M. S., McCall, W. V., Sahlem, G. L., Short, B., Kerns, S., Manett, A. J., Fox, J. B., Dancy, M. M., Cook, D. N., et al. (2021) · Journal of Ect · doi:10.1097/yct.0000000000000776 · Cited by 15
Hall, J. E., Moonesinghe, R., Bouye, K. E., & Penman‐Aguilar, A. (2019) · International Journal of Environmental Research and Public Health · doi:10.3390/ijerph16030436 · Cited by 15
The role of race in rural‐urban suicide disparities
Peltzman, T., Gottlieb, D. J., Levis, M., & Shiner, B. R. (2021) · The Journal of Rural Health · doi:10.1111/jrh.12603 · Cited by 15
Social Determinants and Differences in Mortality by Race/Ethnicity
Pérez‐Stable, E. J., & Rodriquez, E. J. (2020) · JAMA Network Open · doi:10.1001/jamanetworkopen.2019.21392 · Cited by 15
Metadata
- Authors
- Ivey-Stephenson, A. Z., Crosby, A. E., Jack, S. P. D., Haileyesus, T., & Kresnow-Sedacca, M.-J.
- Affiliations
- National Center for Injury Prevention and Control (US)
- Division of Analysis, Research, and Practice Integration, National Center for Injury Prevention and Control, CDC
- Corresponding author
- Ivey-Stephenson, Asha Z.
- ORCID
- Crosby, Alex E.
- Venue
- MMWR. Surveillance Summaries
- Published
- 2017-10-06
- Volume
- 66
- Issue
- 18
- Pages
- 1-16
- ISSN
- 1545-8636 (ISSN-L)
- 1546-0738
- PMC
- PMC5829833
- OpenAlex
- W2762275952
- Cited by
- 319
- References
- 29
- Citations by year
- 2026: 17 · 2025: 39 · 2024: 29 · 2023: 40 · 2022: 52 · 2021: 49 · 2020: 51 · 2019: 27 · 2018: 13 · 2017: 1
- FWCI
- 31.21
- Type
- journal article
- Language
- en
- Open access
- hybrid
- doi.org
- Licence
- public-domain
- Locations
- MMWR Surveillance Summaries (publishedVersion, public-domain)
- Europe PMC (PubMed Central) (publishedVersion, cc-by)
- PubMed Central (publishedVersion, cc-by)
- PubMed (publishedVersion)
- Funders
- Centers for Disease Control and Prevention
- National Center for Injury Prevention and Control
- Topics
- Social Sciences › Psychology › Clinical Psychology › Suicide and Self-Harm Studies
- Social Sciences › Sociology and Political Science › Homicide, Infanticide, and Child Abuse
- Health Sciences › Medicine › Public Health, Environmental and Occupational Health › Injury Epidemiology and Prevention
- Keywords
- suicide, suicide rates, urbanization level, urban-rural differences, sex differences, racial and ethnic disparities, age groups, mechanism of death, firearm suicide, suicide prevention, non-Hispanic blacks, non-Hispanic whites
- MeSH terms
- Adolescent, Adult, Aged, Cause of Death, Child, Ethnicity, Female, Humans, Male, Middle Aged, Suicide, United States, Urbanization, Age Distribution, Sex Distribution, Racial Groups, Young Adult
About these checks
Registry, retraction, Cites and statistics results are computed, not judged, with one exception: a printed reference that no index lists is read once by a model before it counts as a citation error. Claims are extracted by a model and kept only when their quote appears verbatim in the text; each cited source is then checked, with a model’s help, for whether it says what the claim relies on. Those verdicts can be wrong — read the claim’s quote and the cited source before relying on one.
Statistics and arithmetic are recomputed, not judged.
Confidence bands are shown only for fields calibrated on our annotated test set. None is calibrated yet, so no band is shown.
What counts as a claim ›How we measure confidence ›How we check this ›
Are you an author, or do you see a problem with this page? Request a review
