PreprintCited by 27

The DOI matches its Crossref record; 6 of the 6 references it cites were found in a registry or an index.

Mitochondrial mutation, drift and selection during human development and ageing

Campbell, Peter, Chapman, Michael Spencer, Przybilla, Moritz, Lawson, Andrew, Mitchell, Emily, Dawson, Kevin, Williams, Nicholas, Harvey, Luke, Ranzoni, Anna Maria, Cvejic, Ana, Mahbubani, Krishna, Saeb-Parsy, Kourosh, Green, Anthony, Nangalia, Jyoti, Laurenti, Elisa, Martincorena, Inigo·2023

Abstract

Progressive dysfunction of mitochondria, organelles responsible for energy provision to cells, is a major hallmark of ageing. How the dysfunction steadily accrues over a lifetime remains unclear, given the transient nature of free radical damage and the high turnover of mitochondria. Here, we leveraged whole-genome sequencing data from single-cell derived foetal and adult haematopoietic stem/progenitor cell colonies to study the clonal dynamics of turnover and selection in mitochondrial genomes throughout life. We found that genetic drift and independent convergence of mitochondrial mutations complicate their use as lineage marks in single-cell sequencing experiments. Point mutations accrued linearly with age at an average rate of 0.007 mutations/genome/year. Using the distribution of mtDNA allele frequencies with age, we infer that a cell’s complement of mitochondrial genomes is replicated every 4-19 weeks in adults, with faster turnover rates during foetal development. Clock-like accumulation of mutations coupled with rapid turnover induces complex evolutionary dynamics in mitochondria as individuals age. Nonsense mutations are disadvantageous regardless of their heteroplasmy level. Missense variants, however, are positively selected at low heteroplasmy but negatively selected at high heteroplasmy, suggesting that some mutations improve fitness of individual mitochondria, even though fitness of the whole cell deteriorates if their expansion proceeds too far. Thus, age-related decline in mitochondrial function can arise from preferential cellular accumulation of selfish mitochondrial clones whose superior fitness ultimately disadvantages the host cell.

Overview

The claims and statistics of this paper haven’t been checked yet.

Run the check — free, no account needed. It reads the open-access text and checks the sources it cites.

A few free checks a day · papers already verified open instantly · results are public

Integrity signals

Registry

Crossref · 10.21203/rs.3.rs-3083262/v1

Cites

6 of 6 references verified0 citation errors · 0 not checkable

Statistics

Figures

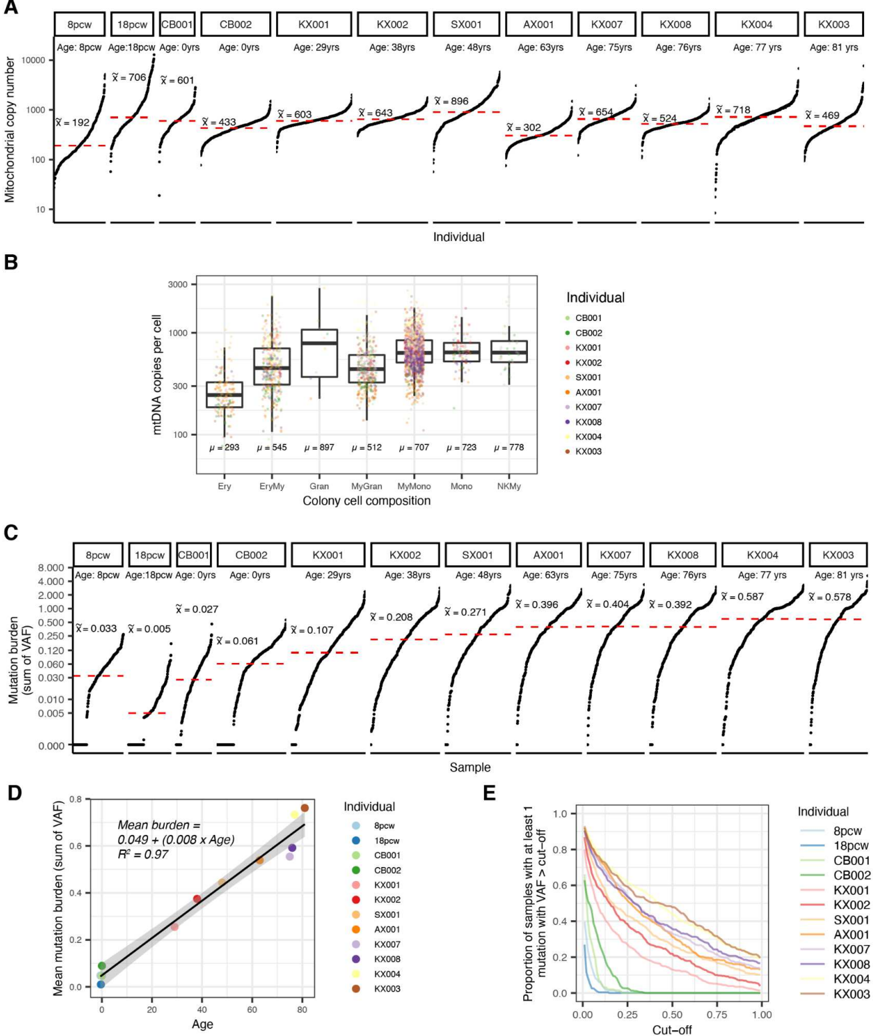
Fig. 1 Genomic variation in the mitochondrial genome throughout life. a , Mitochondrial copy number (log10, y-axis) across all samples per patient (x-axis). Patients have been ordered by increased age. Horizontal red line indicates the median copy number across all samples within a patient annotated above. b , Mitochondrial copy number (y-axis) for each HSC-derived colony where the colony cell type composition was available. c, Mitochondrial mutation burden represented as the sum of variant allele fraction (VAF) across all samples per patient. Patients are ordered by increasing age. d, Correlation between median mitochondrial mutation burden (y-axis) and age (x-axis). The black line highlights a linear regression with gray boundaries indicating the standard error. Each dot is coloured according to the patient identity. e, Proportion (y-axis) of samples per patient with at least 1 mutation at a VAF higher than our detection limit. The x-axis indicates the VAF level of a respective mutation. (Ery - Erythroid, Gran - Granulocytic, EryMy - Erythroid/ myeloid, MyGran - Myeloid/ Granulocytic, MyMono - Myeloid/ Monocytic, Mono - Monocytic, NKMy - Natural Killer/ Myeloid)
Fig. 1 Genomic variation in the mitochondrial genome throughout life. a , Mitochondrial copy number (log10, y-axis) across all samples per patient (x-axis). Patients have been ordered by increased age. Horizontal red line indicates the median copy number across all samples within a patient annotated above. b , Mitochondrial copy number (y-axis) for each HSC-derived colony where the colony cell type composition was available. c, Mitochondrial mutation burden represented as the sum of variant allele fraction (VAF) across all samples per patient. Patients are ordered by increasing age. d, Correlation between median mitochondrial mutation burden (y-axis) and age (x-axis). The black line highlights a linear regression with gray boundaries indicating the standard error. Each dot is coloured according to the patient identity. e, Proportion (y-axis) of samples per patient with at least 1 mutation at a VAF higher than our detection limit. The x-axis indicates the VAF level of a respective mutation. (Ery - Erythroid, Gran - Granulocytic, EryMy - Erythroid/ myeloid, MyGran - Myeloid/ Granulocytic, MyMono - Myeloid/ Monocytic, Mono - Monocytic, NKMy - Natural Killer/ Myeloid)CC-BY · From the PDF
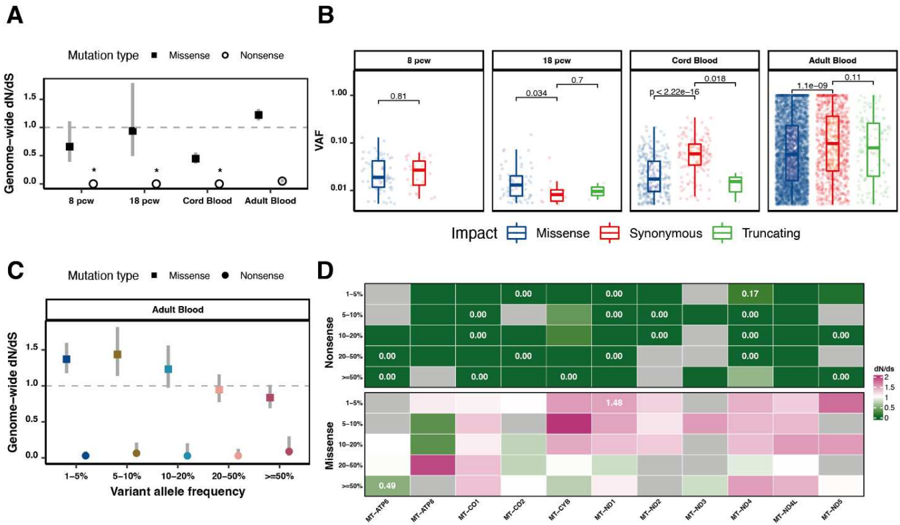
Fig. 2 Functional somatic mutations in the mitochondrial genome. a , Mitochondrial genome-wide d N /d S ratio for missense and nonsense mutations in the overarching age groups. Asterisks highlight d N /d S ratios where the confidence intervals from dndscv were infinitive. b, Boxplots highlighting the variant allele fraction (y-axis) of all mutations per mutation type (x-axis) across age groups. Statistical annotations denote the results of a Wilcoxon rank sum test using synonymous mutations as a reference. Of note, the 8pcw fetus did not have truncating mutations therefore not showing any data for this mutation type. c, Mitochondrial genome-wide d N /d S ratio for missense and nonsense mutations of specific VAF levels in the adult blood. d , Gene-level d N /d S ratios for missense and nonsense mutations for all coding mitochondrial genes on the heavy strand across VAF levels. Note that MT-ND6 is on the light strand and was not considered for this analysis. Only point estimates which have a significant qvalue as provided by dndscv (q-value ≤ 0.05) are highlighted in cells.
Fig. 2 Functional somatic mutations in the mitochondrial genome. a , Mitochondrial genome-wide d N /d S ratio for missense and nonsense mutations in the overarching age groups. Asterisks highlight d N /d S ratios where the confidence intervals from dndscv were infinitive. b, Boxplots highlighting the variant allele fraction (y-axis) of all mutations per mutation type (x-axis) across age groups. Statistical annotations denote the results of a Wilcoxon rank sum test using synonymous mutations as a reference. Of note, the 8pcw fetus did not have truncating mutations therefore not showing any data for this mutation type. c, Mitochondrial genome-wide d N /d S ratio for missense and nonsense mutations of specific VAF levels in the adult blood. d , Gene-level d N /d S ratios for missense and nonsense mutations for all coding mitochondrial genes on the heavy strand across VAF levels. Note that MT-ND6 is on the light strand and was not considered for this analysis. Only point estimates which have a significant qvalue as provided by dndscv (q-value ≤ 0.05) are highlighted in cells.CC-BY · From the PDF
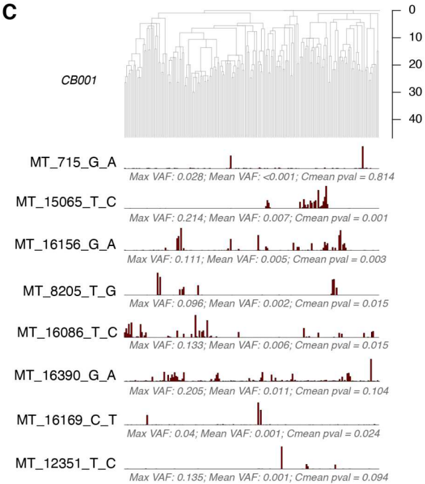
Fig. 3 Heteroplasmic mutations during early development. a -d , Bar plots below the phylogenetic trees for the 8pcw foetal (a), 18pcw foetal (b), CB001 cord blood (c) and CB002 cord blood (d) samples, showing the VAF for shared mutations (present at >1% VAF in >1 sample) across samples. Printed below each bar plot are the maximum mutation VAF, the mean VAF across all samples and the p-value for the Cmean measure of phylogenetic signal. The phylogeny illustrates the clonal relationships between samples. Only shared mutations for which the inferred MRCA was the zygote are depicted, with the exception of the highly asymmetric 18pcw phylogeny, for which the depicted mutation has an inferred MRCA of the 2-cell stage embryo. The red box highlights a known pathogenic mutation
Fig. 3 Heteroplasmic mutations during early development. a -d , Bar plots below the phylogenetic trees for the 8pcw foetal (a), 18pcw foetal (b), CB001 cord blood (c) and CB002 cord blood (d) samples, showing the VAF for shared mutations (present at >1% VAF in >1 sample) across samples. Printed below each bar plot are the maximum mutation VAF, the mean VAF across all samples and the p-value for the Cmean measure of phylogenetic signal. The phylogeny illustrates the clonal relationships between samples. Only shared mutations for which the inferred MRCA was the zygote are depicted, with the exception of the highly asymmetric 18pcw phylogeny, for which the depicted mutation has an inferred MRCA of the 2-cell stage embryo. The red box highlights a known pathogenic mutationCC-BY · From the PDF
Image 4
CC-BY · From the PDF
Image 5
CC-BY · From the PDF
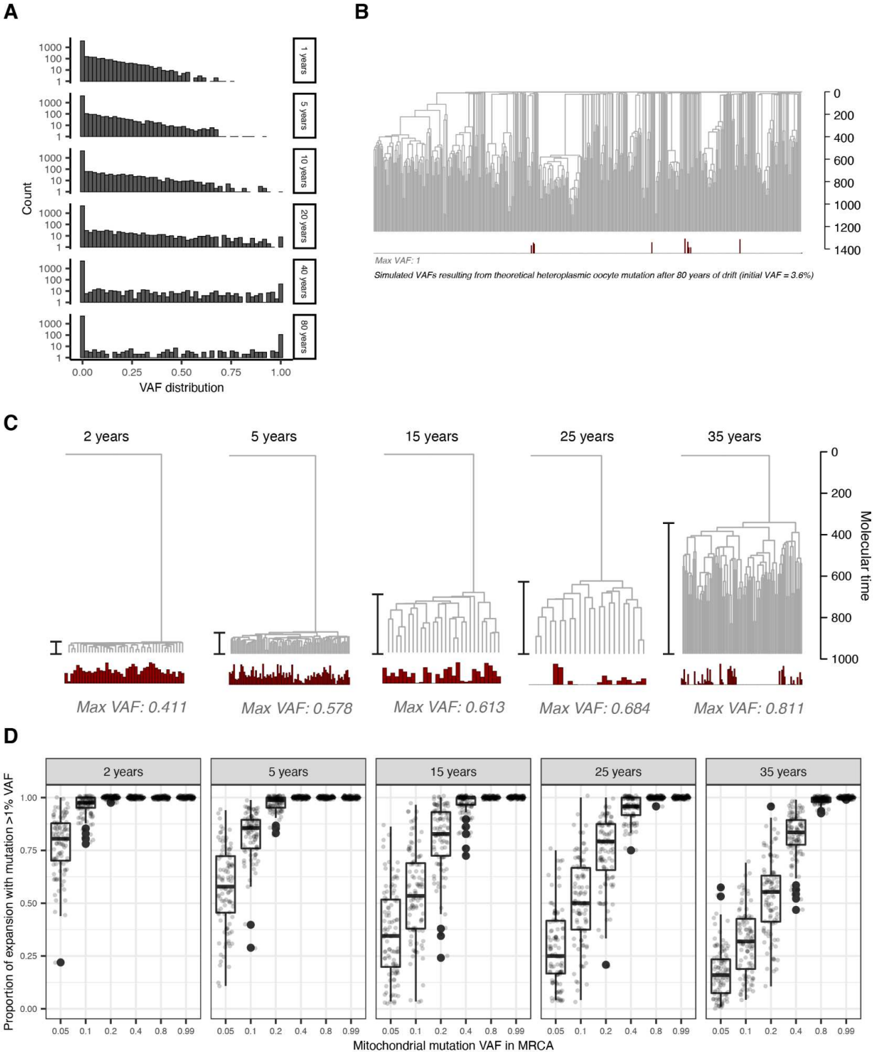
Fig. 6 Understanding the implications of drift through simulation. a, Simulation of the VAF distribution for a heteroplasmic mutation present in the oocyte at 3.6% VAF through lifetime. By old age, the mutation has been either lost or fixed in most lineages. b , Simulated VAF distribution of a heteroplasmic mutation present in the oocyte at 3.6% VAF that has undergone drift through the KX004 phylogeny (used for illustrative purposes only). The mutation has been fixed in multiple unrelated lineages. c , Illustrative heteroplasmic drift simulations for clonal expansions arising with distinct dynamics (2 yrs = rapid growth, 35 yrs = slow growth). The mtDNA copy number used is 1000, and the generation time 20 days, corresponding to the highest density posterior estimates from the ABC. In each simulation, VAF in the MRCA is 0.2. d , Boxplot derived from simulations ( N =100 for each boxplot) indicating the proportion of clonal expansions anticipated to have detectable levels (>1% VAF) of a mitochondrial marker mutation depending on the specific dynamic of an expansion (indicated above each panel), and mutation VAF in the MRCA. Jittered raw data is plotted overlying. The boxes indicate the median and IQR and the whiskers extend to the largest and smallest values no more than 1.5× IQR
Fig. 6 Understanding the implications of drift through simulation. a, Simulation of the VAF distribution for a heteroplasmic mutation present in the oocyte at 3.6% VAF through lifetime. By old age, the mutation has been either lost or fixed in most lineages. b , Simulated VAF distribution of a heteroplasmic mutation present in the oocyte at 3.6% VAF that has undergone drift through the KX004 phylogeny (used for illustrative purposes only). The mutation has been fixed in multiple unrelated lineages. c , Illustrative heteroplasmic drift simulations for clonal expansions arising with distinct dynamics (2 yrs = rapid growth, 35 yrs = slow growth). The mtDNA copy number used is 1000, and the generation time 20 days, corresponding to the highest density posterior estimates from the ABC. In each simulation, VAF in the MRCA is 0.2. d , Boxplot derived from simulations ( N =100 for each boxplot) indicating the proportion of clonal expansions anticipated to have detectable levels (>1% VAF) of a mitochondrial marker mutation depending on the specific dynamic of an expansion (indicated above each panel), and mutation VAF in the MRCA. Jittered raw data is plotted overlying. The boxes indicate the median and IQR and the whiskers extend to the largest and smallest values no more than 1.5× IQRCC-BY · From the PDF
Image 7
CC-BY · From the PDF
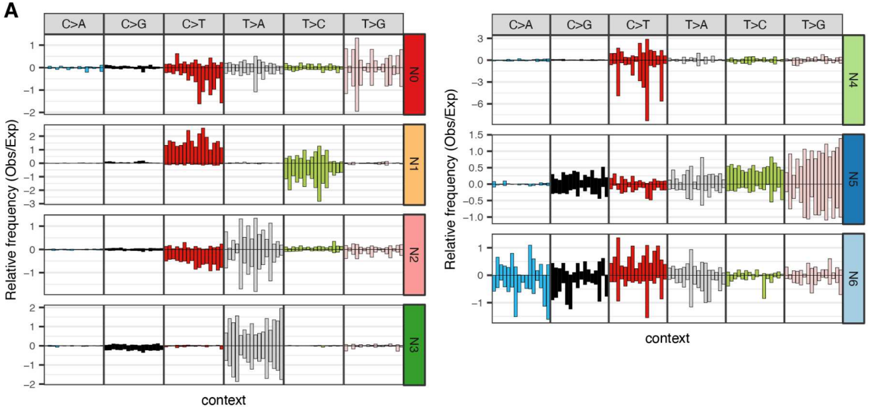
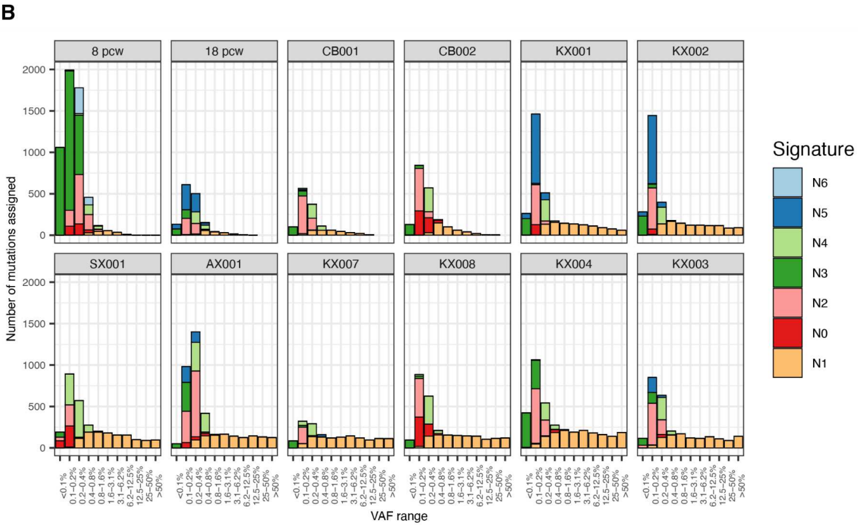
Extended Data Fig. 2| Mitochondrial mutation signature decomposition by variant allele fraction. a, 192-profile mutational signatures extracted by a hierarchical Dirichlet process (Methods). Mutations were aggregated according to individual and VAF. Positive bars represent mutations on the heavy strand, and negative bars those on the light strand. Bars are coloured by the substitution type. Signature 'N1' is the genuine signature. b , Absolute signature contributions to mutation sets at different VAF levels in different individuals, demonstrating large contributions of artefactual signatures at low VAFs <0.5%, and almost exclusive contributions of the genuine 'N1' signature at higher VAFs above ~1%. VAF, variant allele fraction.
Extended Data Fig. 2| Mitochondrial mutation signature decomposition by variant allele fraction. a, 192-profile mutational signatures extracted by a hierarchical Dirichlet process (Methods). Mutations were aggregated according to individual and VAF. Positive bars represent mutations on the heavy strand, and negative bars those on the light strand. Bars are coloured by the substitution type. Signature 'N1' is the genuine signature. b , Absolute signature contributions to mutation sets at different VAF levels in different individuals, demonstrating large contributions of artefactual signatures at low VAFs <0.5%, and almost exclusive contributions of the genuine 'N1' signature at higher VAFs above ~1%. VAF, variant allele fraction.CC-BY · From the PDF
Image 9
CC-BY · From the PDF
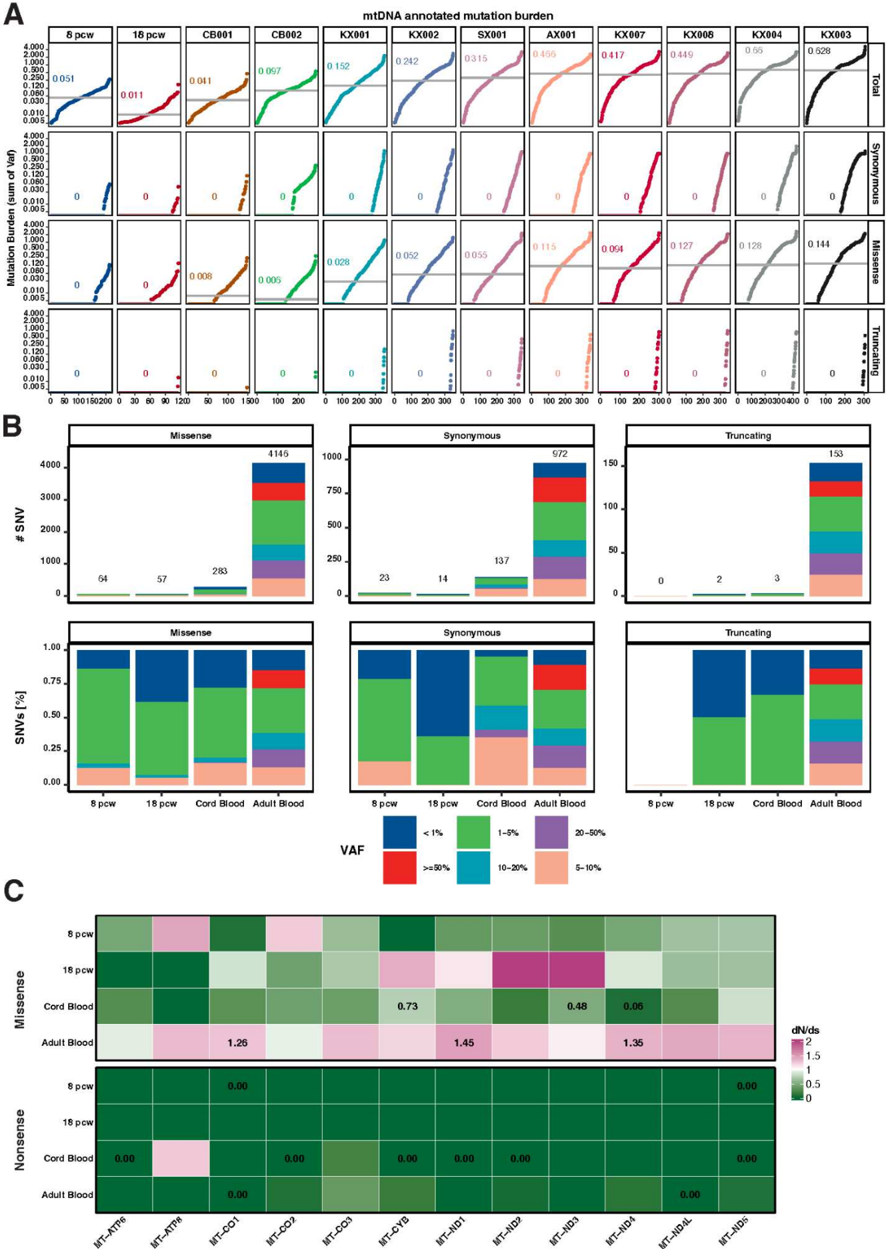
Extended Data Fig. 3| Functional somatic mutations and selection in age groups. a, Functional mitochondrial mutation burden for synonymous, missense and truncating mutations represented as the sum of variant allele fraction (VAF) across all samples per patient equivalent to Fig. 1A. b, Bar plot showing the total number and proportion of functional mitochondrial mutations for synonymous, missense and truncating mutations per age groups, coloured according to the variant allele fraction
Extended Data Fig. 3| Functional somatic mutations and selection in age groups. a, Functional mitochondrial mutation burden for synonymous, missense and truncating mutations represented as the sum of variant allele fraction (VAF) across all samples per patient equivalent to Fig. 1A. b, Bar plot showing the total number and proportion of functional mitochondrial mutations for synonymous, missense and truncating mutations per age groups, coloured according to the variant allele fractionCC-BY · From the PDF
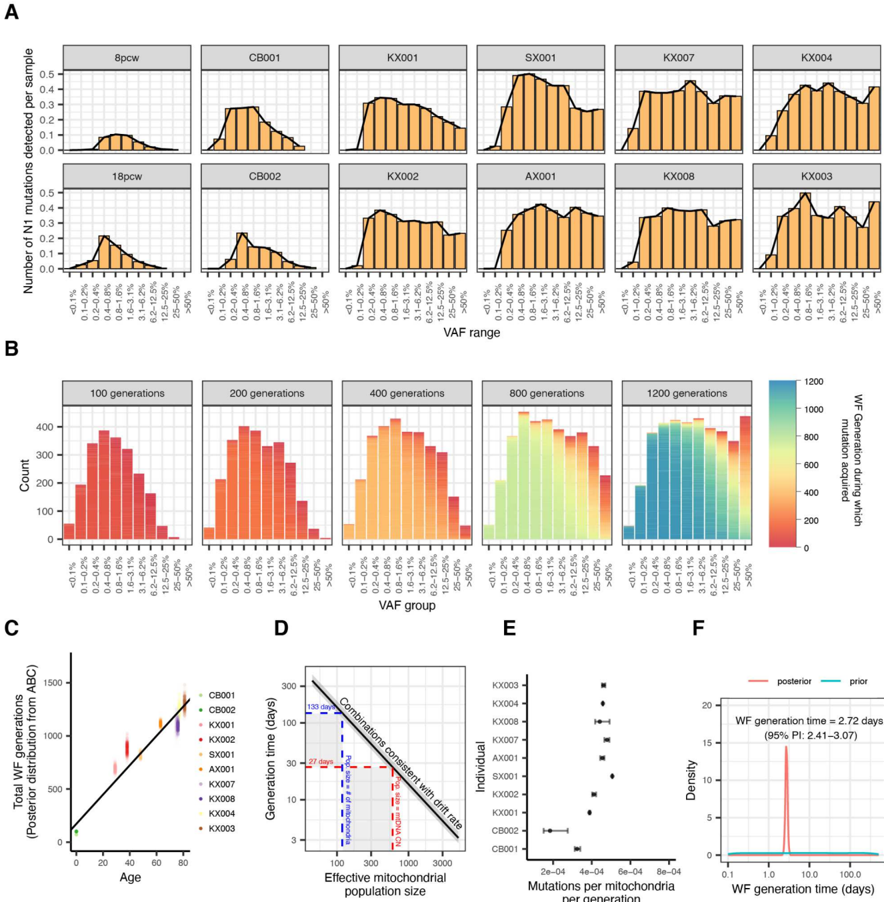
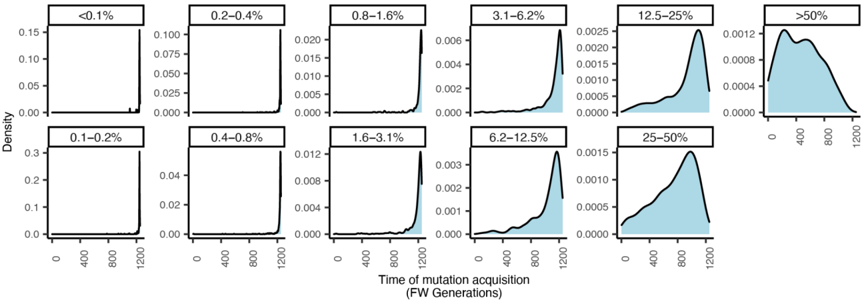
Extended Data Fig. 4| Timing of mutation acquisition for mutations present in different VAF ranges. Wright-Fisher model of heteroplasmic drift illustrates that after 1200 generations (equivalent to an elderly individual of approximately 80 years), mutations in different VAF ranges have been acquired at different times. Low VAF mutations have invariably been acquired in recent generations. High VAF mutations have more variable time of acquisition, but are more likely to have been acquired early in life. (VAF = Variant Allele Fraction)
Extended Data Fig. 4| Timing of mutation acquisition for mutations present in different VAF ranges. Wright-Fisher model of heteroplasmic drift illustrates that after 1200 generations (equivalent to an elderly individual of approximately 80 years), mutations in different VAF ranges have been acquired at different times. Low VAF mutations have invariably been acquired in recent generations. High VAF mutations have more variable time of acquisition, but are more likely to have been acquired early in life. (VAF = Variant Allele Fraction)CC-BY · From the PDF
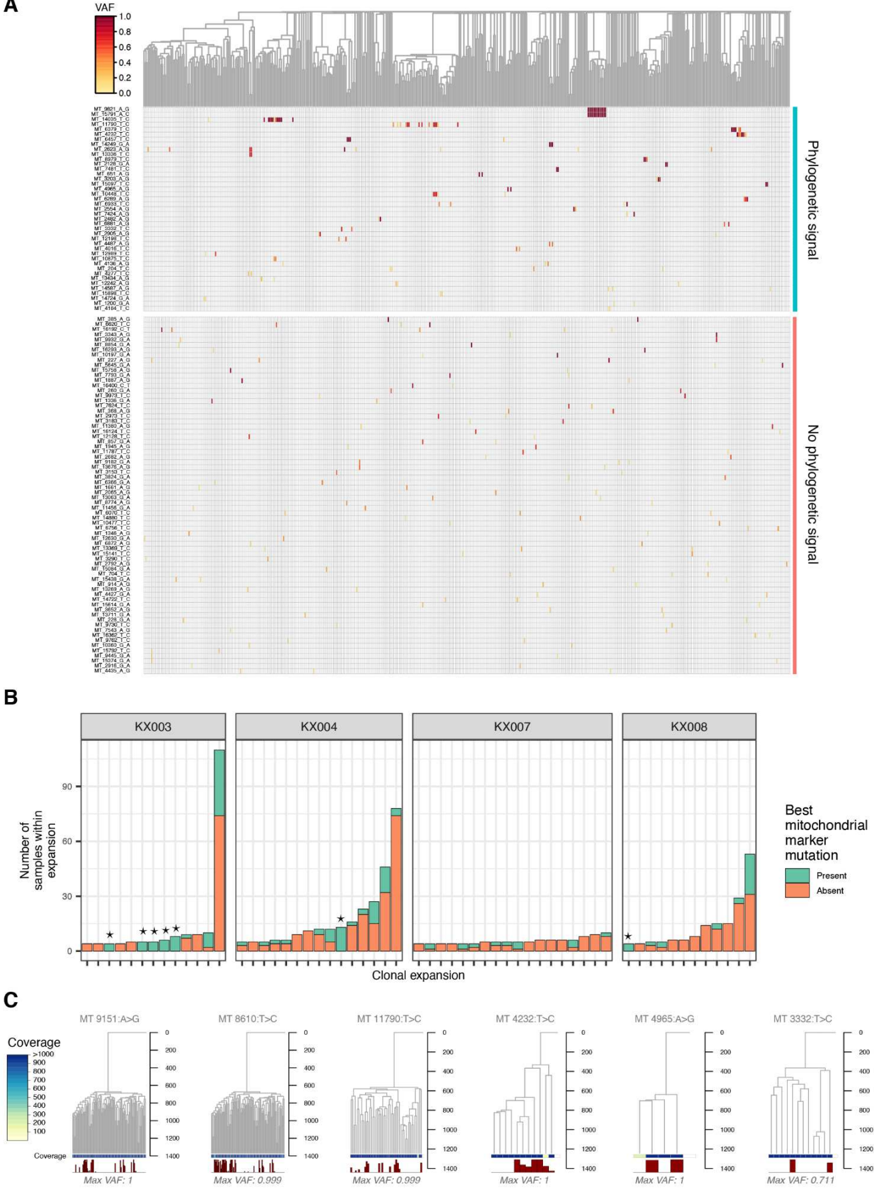
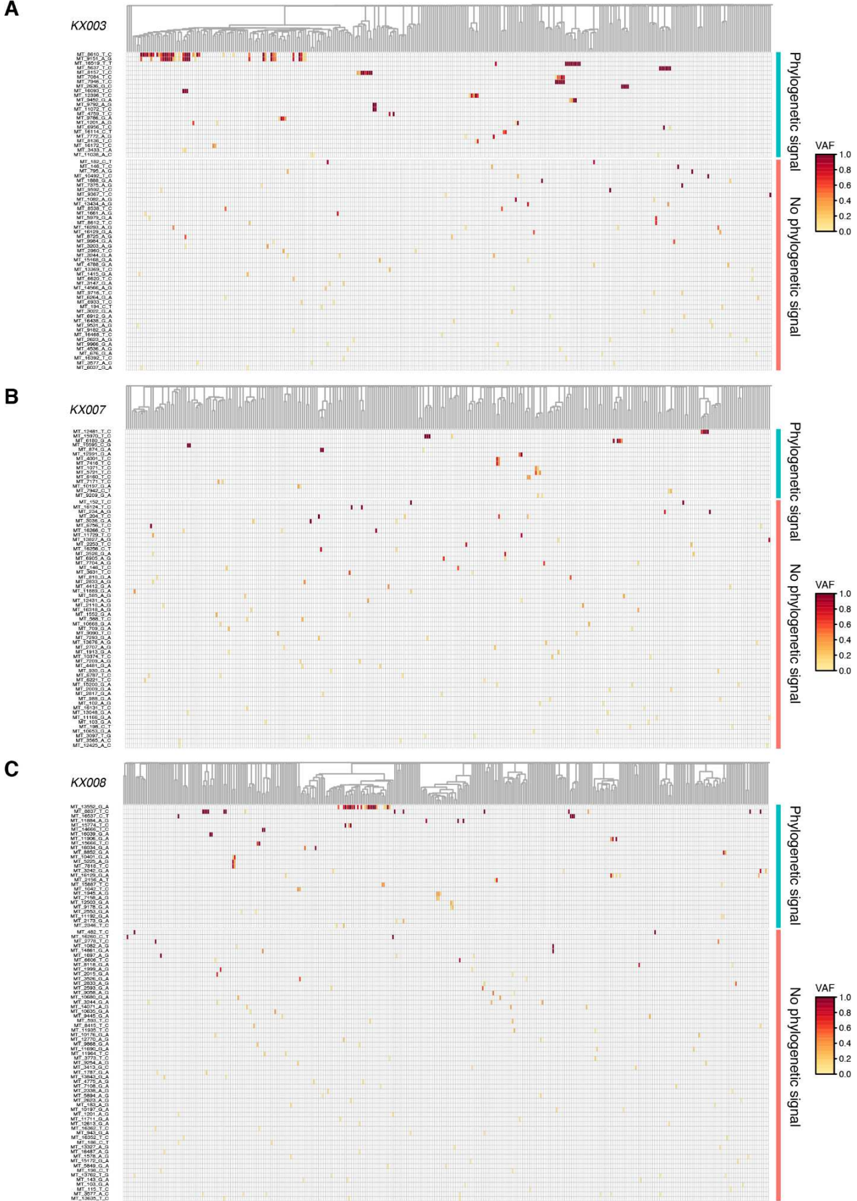
Extended Data Fig. 5| Shared mitochondrial mutations. a -c, Similar to Fig. 5a, heatmaps of shared mitochondrial mutations for KX003 (a), KX007 (b) and KX008 (c). Each row represents a mitochondrial mutation (labeled with the mutation reference in format MT-Position-Reference-Alternative), and each column a sample, ordered by the SNV-based phylogeny (shown above). Mutations are grouped by those that correlate with the SNV phylogeny, and those that do not. SNV, Single nucleotide variant; VAF, variant allele fraction; MRCA, Most recent common ancestor.
Extended Data Fig. 5| Shared mitochondrial mutations. a -c, Similar to Fig. 5a, heatmaps of shared mitochondrial mutations for KX003 (a), KX007 (b) and KX008 (c). Each row represents a mitochondrial mutation (labeled with the mutation reference in format MT-Position-Reference-Alternative), and each column a sample, ordered by the SNV-based phylogeny (shown above). Mutations are grouped by those that correlate with the SNV phylogeny, and those that do not. SNV, Single nucleotide variant; VAF, variant allele fraction; MRCA, Most recent common ancestor.CC-BY · From the PDF
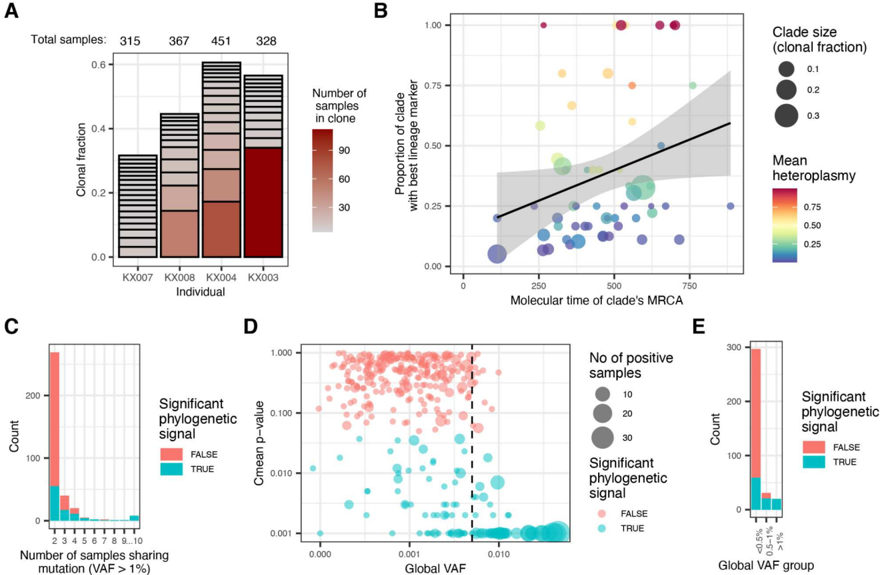
Extended Data Fig. 6| Correlation between shared mtDNA mutations and the phylogeny. a, Overview of the clonal expansions in each individual, including all post-embryonic clones with >1% clonal fraction. b, Proportion of a clonal expansion with the best mitochondrial marker mutation for that clone vs the molecular time of the clone's most recent common ancestor (MRCA). The black line represents the relationship estimate by linear regression, p-value = 0.04, R 2 =0.056. The gray shaded area represents the 95% CI. c, Barplot indicating the number of samples sharing each mutation, coloured by whether the mutation correlates with the phylogeny. d , Scatter plot of mitochondrial mutation phylogenetic signal p-values (Cmean p-value < 0.05 indicates significant correlation), by the global VAF. Dot size indicates the number of samples sharing the mutation. Vertical dashed line is at global VAF of 0.5%, the cut-off used for inclusion of mutations for inferring clones. e, Numbers of mitochondrial mutations with or without phylogenetic signal, divided into three groups by global VAF. mtDNA, mitochondrial DNA; VAF, variant allele fraction; MRCA, Most recent common ancestor; CI, Confidence interval.
Extended Data Fig. 6| Correlation between shared mtDNA mutations and the phylogeny. a, Overview of the clonal expansions in each individual, including all post-embryonic clones with >1% clonal fraction. b, Proportion of a clonal expansion with the best mitochondrial marker mutation for that clone vs the molecular time of the clone's most recent common ancestor (MRCA). The black line represents the relationship estimate by linear regression, p-value = 0.04, R 2 =0.056. The gray shaded area represents the 95% CI. c, Barplot indicating the number of samples sharing each mutation, coloured by whether the mutation correlates with the phylogeny. d , Scatter plot of mitochondrial mutation phylogenetic signal p-values (Cmean p-value < 0.05 indicates significant correlation), by the global VAF. Dot size indicates the number of samples sharing the mutation. Vertical dashed line is at global VAF of 0.5%, the cut-off used for inclusion of mutations for inferring clones. e, Numbers of mitochondrial mutations with or without phylogenetic signal, divided into three groups by global VAF. mtDNA, mitochondrial DNA; VAF, variant allele fraction; MRCA, Most recent common ancestor; CI, Confidence interval.CC-BY · From the PDF
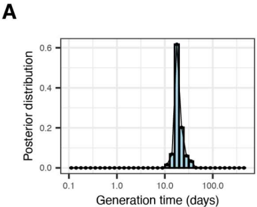
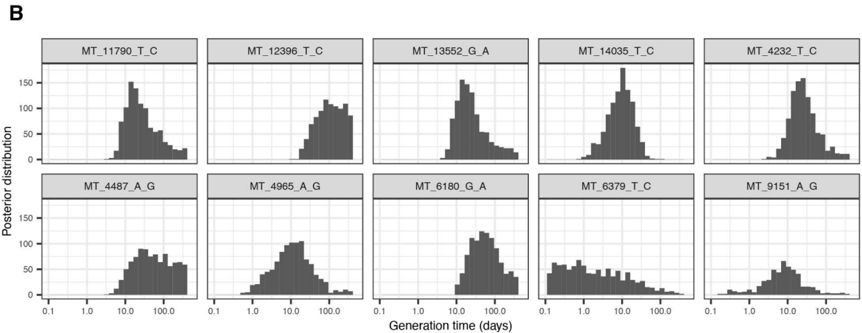
Extended Data Fig. 7| Inference of mtDNA allelic drift through VAF distributions across clonal expansions. a, Posterior distribution for the generation time in adult HSCs assessed using an ABC leveraging the VAF distributions across clonal expansions of specific mutations. The simulations within this ABC were performed using a fixed population size of 675 (the mean mtDNA genome copy number across the 4 individuals considered). The corresponding inferred drift parameter was determined as 12,000 mitochondria days (95% CI, 8,500 - 26,900). b , Posterior distributions for the generation time in adult HSCs as inferred from individual mutation distributions that were combined to create (A). mtDNA, mitochondrial DNA; VAF, variant allele fraction; ABC, Approximate Bayesian computation, CI, Confidence interval.
Extended Data Fig. 7| Inference of mtDNA allelic drift through VAF distributions across clonal expansions. a, Posterior distribution for the generation time in adult HSCs assessed using an ABC leveraging the VAF distributions across clonal expansions of specific mutations. The simulations within this ABC were performed using a fixed population size of 675 (the mean mtDNA genome copy number across the 4 individuals considered). The corresponding inferred drift parameter was determined as 12,000 mitochondria days (95% CI, 8,500 - 26,900). b , Posterior distributions for the generation time in adult HSCs as inferred from individual mutation distributions that were combined to create (A). mtDNA, mitochondrial DNA; VAF, variant allele fraction; ABC, Approximate Bayesian computation, CI, Confidence interval.CC-BY · From the PDF
Image 15
CC-BY · From the PDF
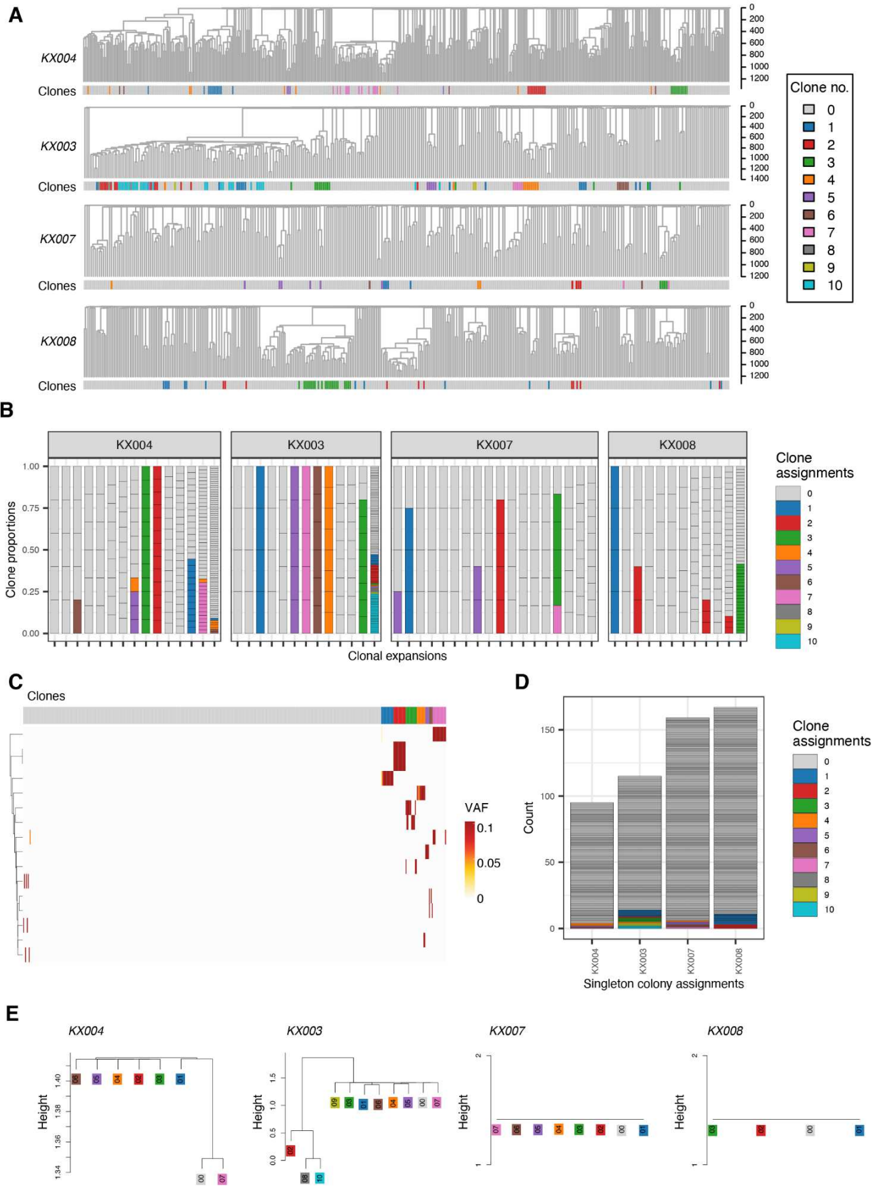
Extended Data Fig. 8| Inferring clones using mitochondrial mutations. a, Clones inferred using mitochondrial mutations for KX004, KX003, KX007 and KX008, highlighted as barplots compared to the high-confidence SNV-based phylogenies above. b , Bar plots for all four patients highlighting the proportion of SNV-based clonal expansions overlapping with the inferred mitochondrial clones highlighted in a. c , Heatmap of shared mutations in KX004 utilised for clustering ( y axis) in all samples ( x axis) coloured according to the VAF and grouped according to clone assignment. d , Singleton
Extended Data Fig. 8| Inferring clones using mitochondrial mutations. a, Clones inferred using mitochondrial mutations for KX004, KX003, KX007 and KX008, highlighted as barplots compared to the high-confidence SNV-based phylogenies above. b , Bar plots for all four patients highlighting the proportion of SNV-based clonal expansions overlapping with the inferred mitochondrial clones highlighted in a. c , Heatmap of shared mutations in KX004 utilised for clustering ( y axis) in all samples ( x axis) coloured according to the VAF and grouped according to clone assignment. d , SingletonCC-BY · From the PDF
Image 17
CC-BY · From the PDF

Verification

Claims the paper makes

The claims and statistics of this paper haven’t been checked yet.

Run the check — free, no account needed. It reads the open-access text and checks the sources it cites.

A few free checks a day · papers already verified open instantly · results are public

Claims other papers make about this one

Each is checked against this paper’s own text: does it say what the citing paper says it does?

Self-check

Percentages, sums and reported differences re-computed from the paper’s own numbers.

The self-check needs the paper’s full text.

Citations

Cites

Research works printed but not linked: 14

  1. Hübner, A. et al. Sharing of heteroplasmies between human liver lobes varies across the mtDNA genome. Sci. Rep. 9, 11219 (2019).
  2. Li, M., Schröder, R., Ni, S., Madea, B. & Stoneking, M. Extensive tissue-related and allele-related mtDNA heteroplasmy suggests positive selection for somatic mutations. Proc. Natl. Acad. Sci. U. S. A. 112, 2491-2496 (2015).
  3. Larman, T. C. et al. Spectrum of somatic mitochondrial mutations in five cancers. Proc. Natl. Acad. Sci. U. S. A. 109, 14087-14091 (2012).
  4. Stewart, J. B. et al. Simultaneous DNA and RNA Mapping of Somatic Mitochondrial Mutations across Diverse Human Cancers. PLoS Genet. 11, e1005333 (2015).
  5. Longchamps, R. J. et al. Evaluation of mitochondrial DNA copy number estimation techniques. PLoS One 15, e0228166 (2020).
  6. Lareau, C. A. et al. Massively parallel single-cell mitochondrial DNA genotyping and chromatin profiling. Nat. Biotechnol. (2020) doi:10.1038/s41587-020-0645-6. · DOI · Paper page
  7. Rebolledo-Jaramillo, B. et al. Maternal age effect and severe germ-line bottleneck in the inheritance of human mitochondrial DNA. Proc. Natl. Acad. Sci. U. S. A. 111, 15474- 15479 (2014).
  8. Laipis, P. J., Van de Walle, M. J. & Hauswirth, W. W. Unequal partitioning of bovine mitochondrial genotypes among siblings. Proc. Natl. Acad. Sci. U. S. A. 85, 8107-8110 (1988).
  9. Coorens, T. H. H. et al. Extensive phylogenies of human development inferred from somatic mutations. Nature 1-6 (2021) doi:10.1038/s41586-021-03790-y. · DOI
  10. Tao, L. et al. Retrospective cell lineage reconstruction in humans by using short tandem repeats. Cell Reports Methods 1, 100054 (2021).
  11. Xu, J. et al. Single-cell lineage tracing by endogenous mutations enriched in transposase accessible mitochondrial DNA. Elife 8, e45105 (2019).
  12. Kimura, M. SOLUTION OF A PROCESS OF RANDOM GENETIC DRIFT WITH A CONTINUOUS MODEL. Proc. Natl. Acad. Sci. U. S. A. 41, 144-150 (1955).
  13. Tischler, G. & Leonard, S. biobambam: tools for read pair collation based algorithms on BAM files. Source Code Biol. Med. 9, 13 (2014).
  14. Gerstung, M., Papaemmanuil, E. & Campbell, P. J. Subclonal variant calling with multiple samples and prior knowledge. Bioinformatics 30, 1198 (2014).

Cited by

See all 27

Metadata

Authors
Campbell, P., Chapman, M. S., Przybilla, M., Lawson, A., Mitchell, E., Dawson, K., Williams, N., Harvey, L., Ranzoni, A. M., Cvejic, A., Mahbubani, K., Saeb-Parsy, K., Green, A., Nangalia, J., Laurenti, E., & Martincorena, I.
Published
2023-06-26
Cited by
27
References
6
Type
Preprint

About these checks

Registry, retraction, Cites and statistics results are computed, not judged, with one exception: a printed reference that no index lists is read once by a model before it counts as a citation error. Claims are extracted by a model and kept only when their quote appears verbatim in the text; each cited source is then checked, with a model’s help, for whether it says what the claim relies on. Those verdicts can be wrong — read the claim’s quote and the cited source before relying on one.

Statistics and arithmetic are recomputed, not judged.

Confidence bands are shown only for fields calibrated on our annotated test set. None is calibrated yet, so no band is shown.

What counts as a claim ›How we measure confidence ›How we check this ›

Are you an author, or do you see a problem with this page? Request a review