

The DOI matches its Crossref record; 1 of the 1 references it cites were found in a registry or an index.
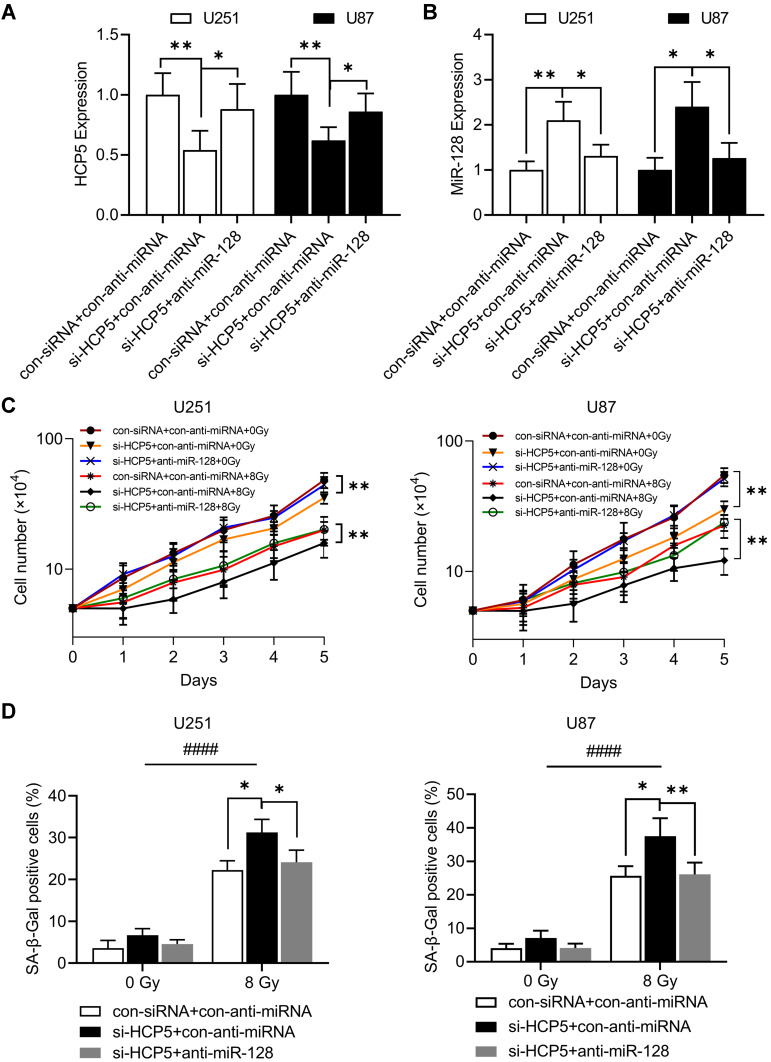
Knockdown of Long Non-Coding RNA HCP5 Increases Radiosensitivity Through Cellular Senescence by Regulating microRNA-128 in Gliomas
Overview
The claims and statistics of this paper haven’t been checked yet.
Run the check — free, no account needed. It reads the open-access text and checks the sources it cites.
Integrity signals
Registry
Cites
Statistics
Figures
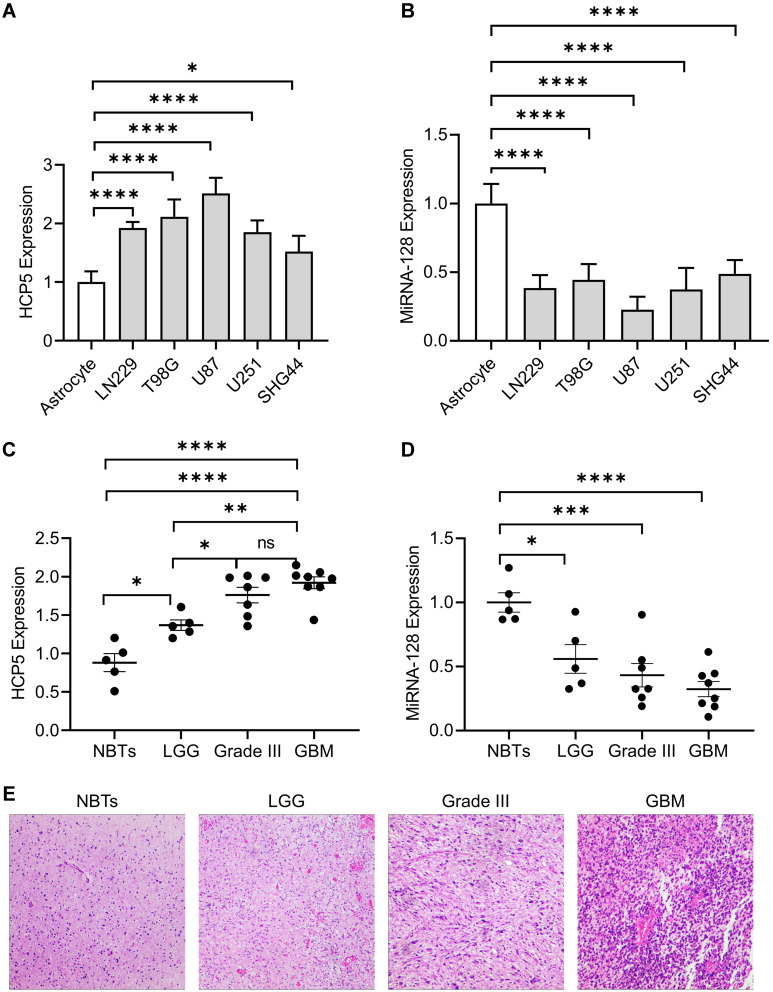
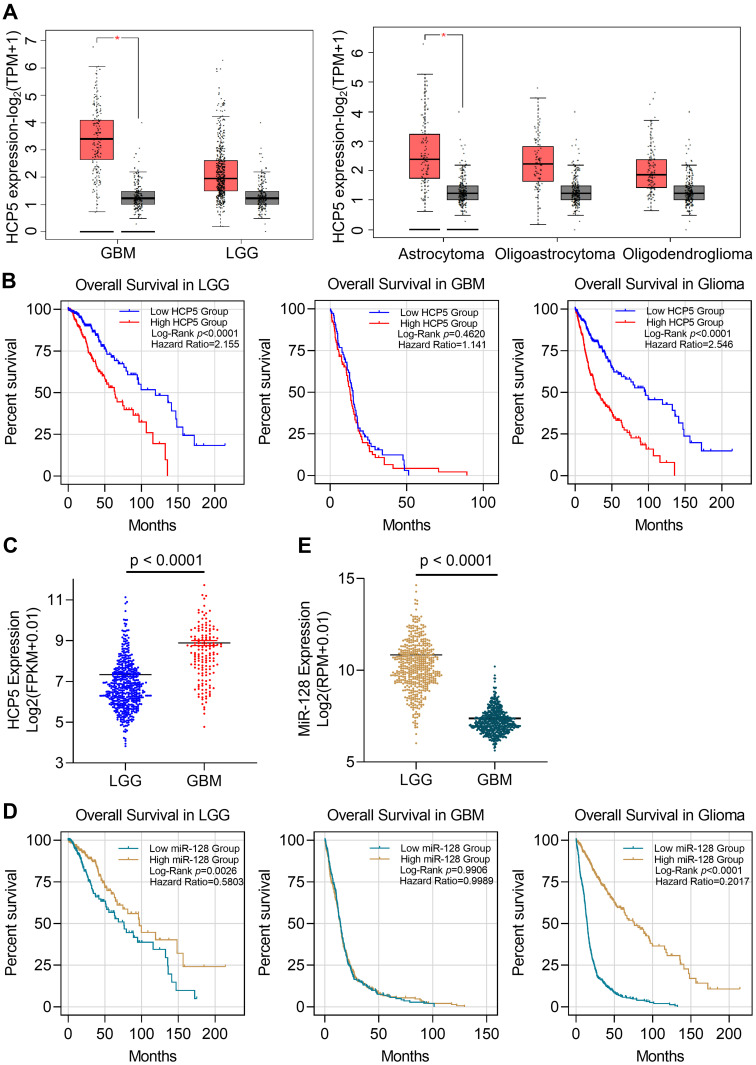
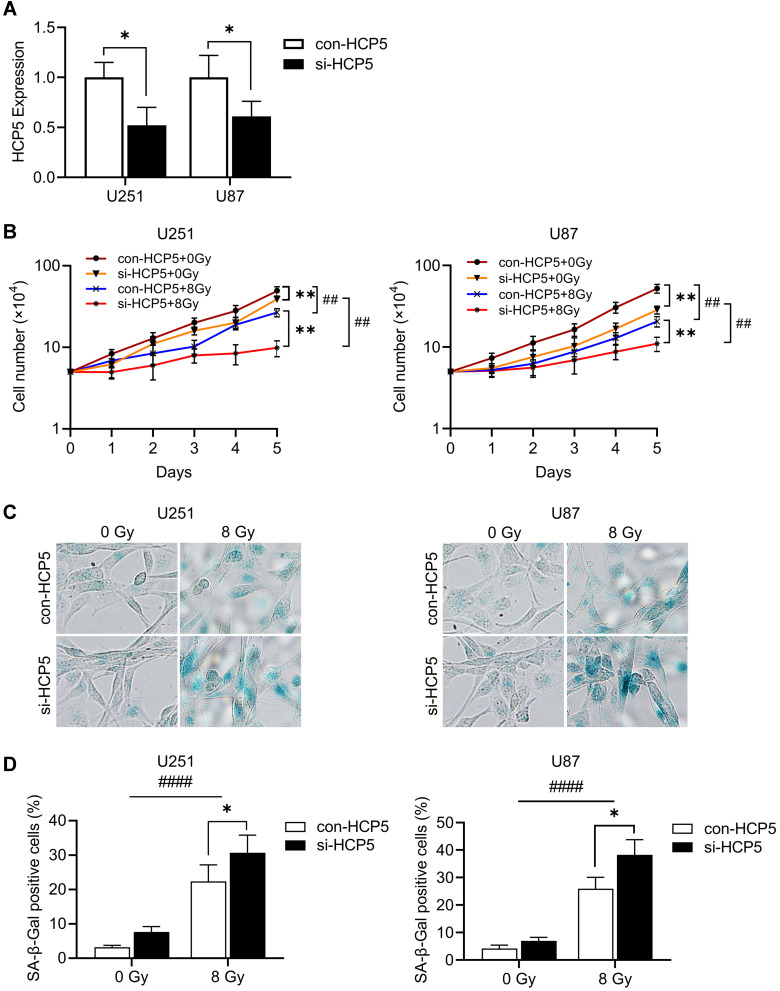
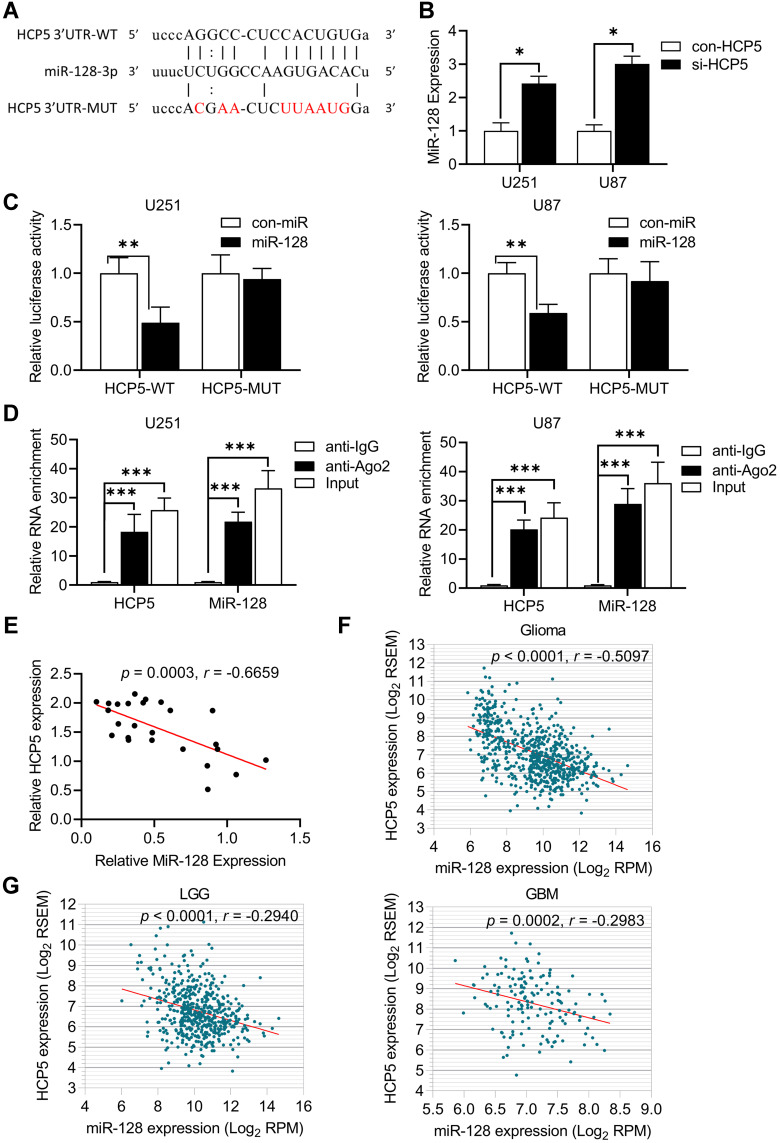
Verification
Claims the paper makes
The claims and statistics of this paper haven’t been checked yet.
Run the check — free, no account needed. It reads the open-access text and checks the sources it cites.
Claims other papers make about this one
Each is checked against this paper’s own text: does it say what the citing paper says it does?
In the citing paper
“More recent findings demonstrated a decreased level of miR-128-3p through a sponge mechanism by lncRNA HCP5 (Histocompatibility leukocyte antigen complex P5).”
From MiR-128-3p – a gray eminence of the human central nervous system (2024) · cites this paper as [171]
In the citing paper
“This direct interaction between microRNA and lncRNA regulated the response of glioma cells to ionizing radiation by interfering with cellular senescence”
From MiR-128-3p – a gray eminence of the human central nervous system (2024) · cites this paper as [171]
In the citing paper
“as the knockdown of lncRNA HCP5 inhibited cell proliferation and enhanced radiosensitivity in gliomas.171”
From MiR-128-3p – a gray eminence of the human central nervous system (2024) · cites this paper as [171]
Self-check
Percentages, sums and reported differences re-computed from the paper’s own numbers.
The self-check needs the paper’s full text.
Citations
Cites
Regulation of miRNA expression during neural cell specification
Smirnova, L., Gräfe, A., Seiler, A., Schumacher, S., Nitsch, R., & Wulczyn, F. G. (2005) · European Journal of Neuroscience · doi:10.1111/j.1460-9568.2005.03978.x · Cited by 707
Research works printed but not linked: 62
- Chen, 2017, Neurotherapeutics, 14, 284, 10.1007/s13311-017-0519-x · DOI · Paper page
- Cancer Genome Atlas Research N. Comprehensive genomic characterization defines human glioblastoma genes and core pathways. Nature. 2008;455(7216):1061–1068. doi:10.1038/nature07385 · DOI · Paper page
- Homma, 2006, J Neuropathol Exp Neurol, 65, 846, 10.1097/01.jnen.0000235118.75182.94 · DOI
- Khasraw, 2014, Cochrane Database Syst Rev, CD008218, 10.1002/14651858.CD008218.pub3 · DOI
- Deng, 2013, Int J Mol Sci, 14, 18319, 10.3390/ijms140918319 · DOI
- Ponting, 2009, Cell, 136, 629, 10.1016/j.cell.2009.02.006 · DOI · Paper page
- Teppan, 2020, Noncoding RNA, 6, 52
- Egranov, 2020, RNA Biol, 17, 1625, 10.1080/15476286.2020.1767455 · DOI
- Lu, 2019, Front Oncol, 9, 1099, 10.3389/fonc.2019.01099 · DOI
- Fu, 2018, Neurotherapeutics, 15, 1139, 10.1007/s13311-018-0649-9 · DOI · Paper page
- Li, 2019, Neoplasma, 66, 118, 10.4149/neo_2018_180613N391 · DOI
- Wang, 2015, Cell Signal, 27, 275, 10.1016/j.cellsig.2014.11.011 · DOI
- Cai, 2015, Oncotarget, 6, 19759, 10.18632/oncotarget.4331 · DOI
- Hu, 2018, J Cell Mol Med, 22, 497, 10.1111/jcmm.13338 · DOI
- Yao, 2015, Cancer Lett, 359, 75, 10.1016/j.canlet.2014.12.051 · DOI
- Wang, 2019, J Exp Clin Cancer Res, 38, 371, 10.1186/s13046-019-1361-2 · DOI
- Liu, 2008, PLoS Genet, 4, e1000041, 10.1371/journal.pgen.1000041 · DOI
- Kulski, 2019, Cells, 8, 10.3390/cells8050480 · DOI
- Yu, 2018, Eur Rev Med Pharmacol Sci, 22, 4812, 10.26355/eurrev_201808_15616 · DOI
- Hu, 2020, Oncol Rep, 43, 328, 10.3892/or.2019.7404 · DOI
- Zhao, 2020, Onco Targets Ther, 13, 11827, 10.2147/OTT.S249770 · DOI
- Liang, 2018, Cell Death Dis, 9, 372, 10.1038/s41419-018-0382-7 · DOI
- Chen, 2019, Biomed Pharmacother, 116, 108966, 10.1016/j.biopha.2019.108966 · DOI
- Wu, 2020, Biomed Pharmacother, 122, 109789, 10.1016/j.biopha.2019.109789 · DOI
- Liu, 2013, Oncol Lett, 6, 393, 10.3892/ol.2013.1380 · DOI
- Lange, 2013, J Hepatol, 59, 504, 10.1016/j.jhep.2013.04.032 · DOI
- Teng, 2016, Mol Ther, 24, 1806, 10.1038/mt.2016.103 · DOI
- Bartel, 2004, Cell, 116, 281, 10.1016/S0092-8674(04)00045-5 · DOI
- Tumilson, 2014, Mol Neurobiol, 50, 545, 10.1007/s12035-014-8679-8 · DOI
- Persengiev, 2012, Curr Gerontol Geriatr Res, 2012, 359369, 10.1155/2012/359369 · DOI
- Sun, 2018, Int J Clin Exp Pathol, 11, 1423
- Ye, 2015, Mol Med Rep, 12, 6247, 10.3892/mmr.2015.4175 · DOI
- Ye, 2014, Oncol Lett, 8, 2601, 10.3892/ol.2014.2606 · DOI
- Li, 2014, Nucleic Acids Res, 42, D92, 10.1093/nar/gkt1248 · DOI · Paper page
- Tang, 2017, Nucleic Acids Res, 45, W98, 10.1093/nar/gkx247 · DOI · Paper page
- Dimri, 1995, Proc Natl Acad Sci U S A, 92, 9363, 10.1073/pnas.92.20.9363 · DOI · Paper page
- Huo, 2019, Exp Ther Med, 17, 2921, 10.3892/etm.2019.7284 · DOI
- Van Meir, 2010, CA Cancer J Clin, 60, 166, 10.3322/caac.20069 · DOI · Paper page
- Prensner, 2011, Cancer Discov, 1, 391, 10.1158/2159-8290.CD-11-0209 · DOI
- Renganathan, 2017, Adv Exp Med Biol, 1008, 199, 10.1007/978-981-10-5203-3_7 · DOI
- Fu, 2020, Mol Ther Nucleic Acids, 21, 712, 10.1016/j.omtn.2020.07.005 · DOI
- Choudhari, 2020, Adv Clin Chem, 95, 105, 10.1016/bs.acc.2019.08.003 · DOI
- Peng, 2018, Mol Cancer, 17, 61, 10.1186/s12943-018-0812-2 · DOI
- Chen, 2020, Med Sci Monit, 26, e921383
- Qi, 2015, J Med Genet, 52, 710, 10.1136/jmedgenet-2015-103334 · DOI
- Ergun, 2015, Tumour Biol, 36, 3129, 10.1007/s13277-015-3346-x · DOI
- Tay, 2014, Nature, 505, 344, 10.1038/nature12986 · DOI · Paper page
- Wu, 2019, Discov Med, 28, 129
- Zhu, 2020, J Pediatr Surg, 10.1016/j.jpedsurg.2020.10.011 · DOI
- Zhao, 2019, Cancer Manag Res, 11, 10455, 10.2147/CMAR.S230324 · DOI
- Wang, 2019, Cancer Med, 8, 4389, 10.1002/cam4.2335 · DOI
- Liu, 2019, Onco Targets Ther, 12, 8207, 10.2147/OTT.S222703 · DOI
- Chen, 2019, J Pediatr Endocrinol Metab, 32, 1327, 10.1515/jpem-2018-0432 · DOI
- Ciafre, 2005, Biochem Biophys Res Commun, 334, 1351, 10.1016/j.bbrc.2005.07.030 · DOI · Paper page
- Godlewski, 2008, Cancer Res, 68, 9125, 10.1158/0008-5472.CAN-08-2629 · DOI · Paper page
- Zhang, 2009, J Mol Med, 87, 43, 10.1007/s00109-008-0403-6 · DOI · Paper page
- Ye, 2018, Eur Rev Med Pharmacol Sci, 22, 8781, 10.26355/eurrev_201812_16645 · DOI
- Shang, 2016, Oncol Lett, 11, 904, 10.3892/ol.2015.3927 · DOI
- She, 2014, Oncol Rep, 32, 957, 10.3892/or.2014.3318 · DOI
- Shan, 2016, Oncotarget, 7, 78813, 10.18632/oncotarget.12385 · DOI · Paper page
- Tu, 2013, Cancer Res, 73, 6046, 10.1158/0008-5472.CAN-13-0358 · DOI
- Peruzzi, 2013, Neuro Oncol, 15, 1212, 10.1093/neuonc/not055 · DOI · Paper page
Cited by
Sorted by citations
MiR-128-3p – a gray eminence of the human central nervous system
Kiel, K., Król, S. K., Bronisz, A., & Godlewski, J. (2024) · Molecular Therapy Nucleic Acids · doi:10.1016/j.omtn.2024.102141 · Cited by 15
Metadata
- Authors
- Wang, C., Yu, G., Xu, Y., Liu, C., Sun, Q., Li, W., Sun, J., Jiang, Y., & Ye, L.
- ORCID
- Ye, Lan
- Venue
- Cancer Management and Research
- Publisher
- Informa UK Limited
- Published
- 2021-05
- Volume
- Volume 13
- Pages
- 3723-3737
- ISSN
- 1179-1322
- PMC
- PMC8113609
- Cited by
- 13
- References
- 1
- Language
- en
About these checks
Registry, retraction, Cites and statistics results are computed, not judged, with one exception: a printed reference that no index lists is read once by a model before it counts as a citation error. Claims are extracted by a model and kept only when their quote appears verbatim in the text; each cited source is then checked, with a model’s help, for whether it says what the claim relies on. Those verdicts can be wrong — read the claim’s quote and the cited source before relying on one.
Statistics and arithmetic are recomputed, not judged.
Confidence bands are shown only for fields calibrated on our annotated test set. None is calibrated yet, so no band is shown.
What counts as a claim ›How we measure confidence ›How we check this ›
Are you an author, or do you see a problem with this page? Request a review
