

The DOI matches its Crossref record; 89 of the 90 references it cites were found in a registry or an index.
Baseline MRI Predictors of Conversion from MCI to Probable AD in the ADNI Cohort
Open accessAbstract
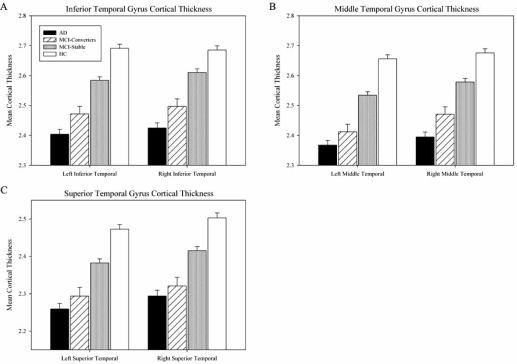
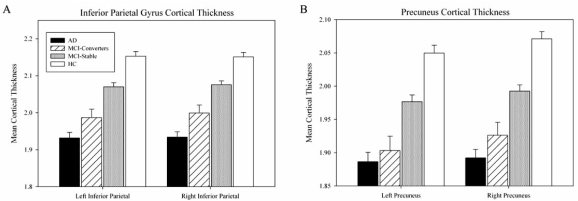
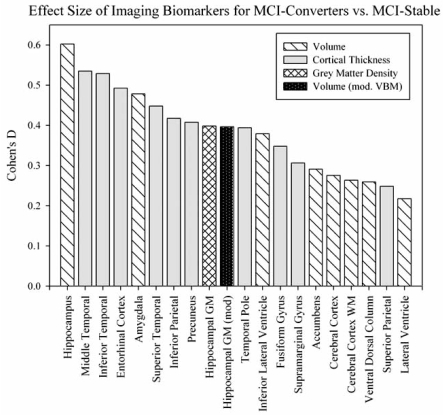
The Alzheimer's Disease Neuroimaging Initiative (ADNI) is a multi-center study assessing neuroimaging in diagnosis and longitudinal monitoring. Amnestic Mild Cognitive Impairment (MCI) often represents a prodromal form of dementia, conferring a 10-15% annual risk of converting to probable AD. We analyzed baseline 1.5T MRI scans in 693 participants from the ADNI cohort divided into four groups by baseline diagnosis and one year MCI to probable AD conversion status to identify neuroimaging phenotypes associated with MCI and AD and potential predictive markers of imminent conversion. MP-RAGE scans were analyzed using publicly available voxel-based morphometry (VBM) and automated parcellation methods. Measures included global and hippocampal grey matter (GM) density, hippocampal and amygdalar volumes, and cortical thickness values from entorhinal cortex and other temporal and parietal lobe regions. The overall pattern of structural MRI changes in MCI (n=339) and AD (n=148) compared to healthy controls (HC, n=206) was similar to prior findings in smaller samples. MCI-Converters (n=62) demonstrated a very similar pattern of atrophic changes to the AD group up to a year before meeting clinical criteria for AD. Finally, a comparison of effect sizes for contrasts between the MCI-Converters and MCI-Stable (n=277) groups on MRI metrics indicated that degree of neurodegeneration of medial temporal structures was the best antecedent MRI marker of imminent conversion, with decreased hippocampal volume (left > right) being the most robust. Validation of imaging biomarkers is important as they can help enrich clinical trials of disease modifying agents by identifying individuals at highest risk for progression to AD.
Overview
The claims and statistics of this paper haven’t been checked yet.
Run the check — free, no account needed. It reads the open-access text and checks the sources it cites.
Integrity signals
Registry
Cites
Statistics
Figures
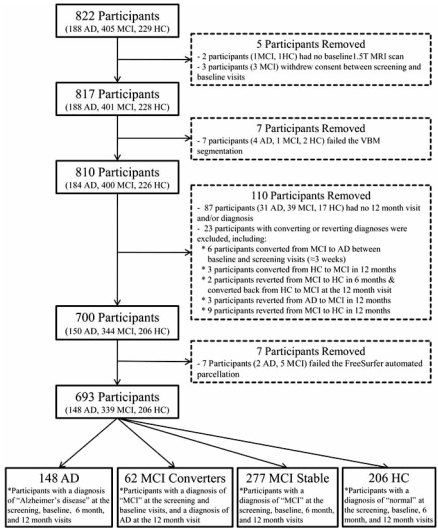
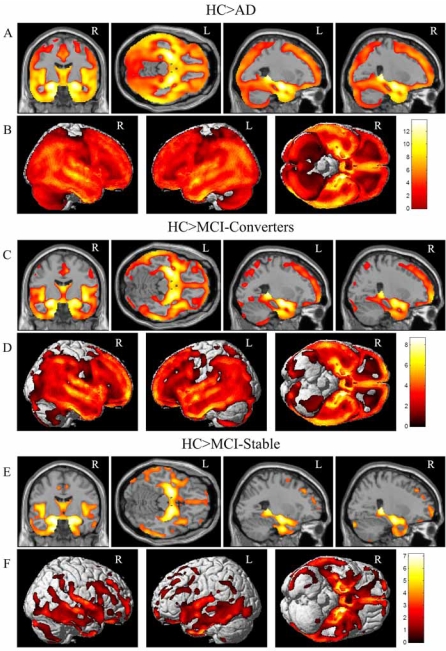
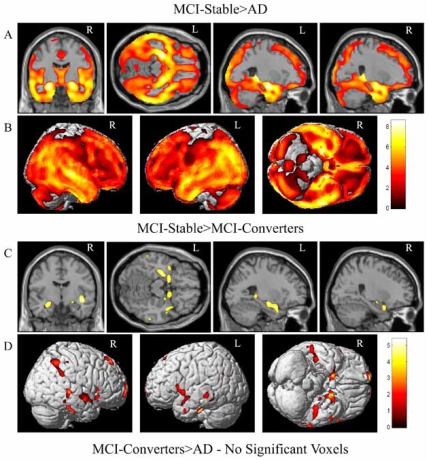
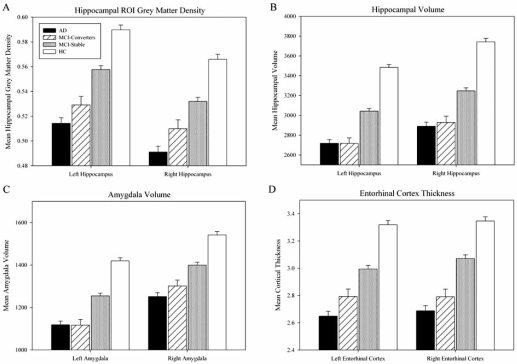
Verification
Claims the paper makes
The claims and statistics of this paper haven’t been checked yet.
Run the check — free, no account needed. It reads the open-access text and checks the sources it cites.
Claims other papers make about this one
Each is checked against this paper’s own text: does it say what the citing paper says it does?
In the citing paper
“they reliably predict cognitive decline [222]”
From Genetic architecture of Alzheimer's disease (2020) · cites this paper as [222]
In the citing paper
“a large number of novel loci and genes have been nominated by these analyses [222, 229–231]”
From Genetic architecture of Alzheimer's disease (2020) · cites this paper as [222]
Self-check
Percentages, sums and reported differences re-computed from the paper’s own numbers.
The self-check needs the paper’s full text.
Citations
Cites
Folstein, M. F., Folstein, S. E., & McHugh, P. R. (1975) · Journal of Psychiatric Research · doi:10.1016/0022-3956(75)90026-6 · Cited by 88,282
Cortical Surface-Based Analysis
Dale, A. M., Fischl, B., & Sereno, M. I. (1999) · NeuroImage · doi:10.1006/nimg.1998.0395 · Cited by 10,910
The Clinical Dementia Rating (CDR): Current version and scoring rules
Morris, J. C. (1993) · Neurology · doi:10.1212/wnl.43.11.2412-a · Cited by 9,882
Mild Cognitive Impairment: Clinical Characterization and Outcome
Petersen, R. C., Smith, G. E., Waring, S. C., Ivnik, R. J., Tangalos, E. G., & Kokmen, E. (1999) · Archives of Neurology · doi:10.1001/archneur.56.3.303 · Cited by 8,980
Voxel-Based Morphometry—The Methods
Ashburner, J., & Friston, K. J. (2000) · NeuroImage · doi:10.1006/nimg.2000.0582 · Cited by 8,676
Fischl, B., Salat, D. H., Busa, E., Albert, M., Dieterich, M., Haselgrove, C., van der Kouwe, A., Killiany, R., Kennedy, D., Klaveness, S., et al. (2002) · Neuron · doi:10.1016/s0896-6273(02)00569-x · Cited by 8,610
Mild cognitive impairment as a diagnostic entity
Petersen, R. C. (2004) · Journal of Internal Medicine · doi:10.1111/j.1365-2796.2004.01388.x · Cited by 7,864
Sheikh (1986) · doi:10.1300/j018v05n01_09 · Cited by 7,236
Cortical Surface-Based Analysis
Fischl, B., Sereno, M. I., & Dale, A. M. (1999) · NeuroImage · doi:10.1006/nimg.1998.0396 · Cited by 6,147
Measuring the thickness of the human cerebral cortex from magnetic resonance images
Fischl, B. R., & Dale, A. M. (2000) · Proceedings of the National Academy of Sciences · doi:10.1073/pnas.200033797 · Cited by 5,995
Research works printed but not linked: 1
- [35]Dickerson BC Goncharova I Sullivan MP Forchetti C Wilson RS Bennett DA MRI-derived entorhinal and hippocampal atrophy in incipient and very mild Alzheimer's disease Neurobiol Aging 2001 22 747 754 11705634
Cited by
Sorted by citations
Items 201–300 of 538
Mohammadi, A., Kargar, M., & Hesami, E. (2018) · Psychogeriatrics · doi:10.1111/psyg.12301 · Cited by 36
Punzi, M., Sestieri, C., Picerni, E., Chiarelli, A. M., Padulo, C., Pizzi, A. D., Tullo, M. G., Tosoni, A., Granzotto, A., Penna, S. D., et al. (2024) · Heliyon · doi:10.1016/j.heliyon.2024.e27429 · Cited by 38
FASTKD2 is associated with memory and hippocampal structure in older adults
Ramanan, V. K., Nho, K. T., Shen, L., Risacher, S. L., Kim, S., McDonald, B. C., Farlow, M. R., Foroud, T., Gao, S., Soininen, H. S., et al. (2014) · Molecular Psychiatry · doi:10.1038/mp.2014.142 · Cited by 37
Self-citationWu, Z., Xu, D., Potter, T. B. H., Zhang, Y., & Initiative, T. A. D. N. (2019) · Frontiers in Aging Neuroscience · doi:10.3389/fnagi.2019.00113 · Cited by 38
Llano, D. A., Devanarayan, P., & Devanarayan, V. (2019) · Alzheimer Disease & Associated Disorders · doi:10.1097/wad.0000000000000328 · Cited by 35
Sensitivity of restriction spectrum imaging to memory and neuropathology in Alzheimer’s disease
Reas, E. T., Hagler, D. J., White, N. S., Kuperman, J. M., Bartsch, H., Cross, K., Loi, R. Q., Balachandra, A. R., Meloy, M. J., Wierenga, C. E., et al. (2017) · Alzheimer's Research & Therapy · doi:10.1186/s13195-017-0281-7 · Cited by 35
Lesjak, Ž., Pernuš, F., Likar, B., & Špiclin, Ž. (2016) · Neuroinformatics · doi:10.1007/s12021-016-9301-1 · Cited by 35
Changes in the Hippocampal Volume and Shape in Early-Onset Mild Cognitive Impairment
Moon, S. W., Lee, B., & Choi, Y. C. (2018) · Psychiatry Investigation · doi:10.30773/pi.2018.02.12 · Cited by 35
Brain MR Radiomics to Differentiate Cognitive Disorders
Ranjbar, S., Velgos, S. N., Dueck, A. C., Geda, Y. E., Mitchell, J. R., & Initiative, T. A. D. N. (2019) · Journal of Neuropsychiatry · doi:10.1176/appi.neuropsych.17120366 · Cited by 35
Butyrylcholinesterase genotype and gender influence Alzheimer's disease phenotype
Lane, R. M., & He, Y. (2012) · Alzheimer s & Dementia · doi:10.1016/j.jalz.2010.12.005 · Cited by 35
del Val, L. P., Cantero, J. L., & Atienza, M. (2016) · Scientific Reports · doi:10.1038/srep31859 · Cited by 33
Early Indications of Future Cognitive Decline: Stable versus Declining Controls
Rizk‐Jackson, A., Insel, P. S., Petersen, R. C., Aisen, P. S. S., Jack, C. R., & Weiner, M. W. (2013) · PLoS ONE · doi:10.1371/journal.pone.0074062 · Cited by 34
Non-linear ICA Analysis of Resting-State fMRI in Mild Cognitive Impairment
Bi, X.-A., Sun, Q., Zhao, J., Xu, Q., & Wang, L. (2018) · Frontiers in Neuroscience · doi:10.3389/fnins.2018.00413 · Cited by 32
Fernandes, A. S., Tábuas‐Pereira, M., Duro, D., Lima, M., Gens, H., Santiago, B., Durães, J., Almeida, M. R., Leitão, M. J., Baldeiras, I., et al. (2020) · Experimental Gerontology · doi:10.1016/j.exger.2020.111004 · Cited by 37
A Two-Stage Model for Predicting Mild Cognitive Impairment to Alzheimer’s Disease Conversion
Lu, P., Hu, L., Zhang, N., Liang, H., Tian, T., & Lu, L. J. (2022) · Frontiers in Aging Neuroscience · doi:10.3389/fnagi.2022.826622 · Cited by 34
Clinical and MRI Predictors of Conversion From Mild Behavioural Impairment to Dementia
Orso, B., Mattei, C., Arnaldi, D., Massa, F., Serafini, G., Plantone, D., Doglione, E., Grafman, J. H., Nobili, F. M., & Pardini, M. (2019) · American Journal of Geriatric Psychiatry · doi:10.1016/j.jagp.2019.12.007 · Cited by 33
Modeling Alzheimer’s Disease Progression with Fused Laplacian Sparse Group Lasso
Liu, X., Cao, P., Gonçalves, A. R., Zhao, D., & Banerjee, A. (2018) · ACM Transactions on Knowledge Discovery from Data · doi:10.1145/3230668 · Cited by 33
Progranulin levels in blood in Alzheimer's disease and mild cognitive impairment
Cooper, Y. A., Nachun, D. C., Dokuru, D. R., Yang, Z., Karydas, A. M., Serrero, G., Yue, B., Initiative, A. D. N., Boxer, A. L., Miller, B. L., et al. (2018) · Annals of Clinical and Translational Neurology · doi:10.1002/acn3.560 · Cited by 32
Junior, D. A. D. A., Sair, H. I., Peters, M. E., Carvalho, A. F., Yedavalli, V. S., Sólnes, L. B., & Luna, L. (2023) · Journal of Psychiatric Research · doi:10.1016/j.jpsychires.2023.06.016 · Cited by 34
Suppa, P., Initiative, A. A. D. N., Hampel, H. J., Spies, L., Fiebach, J. B., Dubois, B., & Buchert, R. (2015) · Journal of Alzheimer s Disease · doi:10.3233/jad-142280 · Cited by 31
ten Kate, M., Barkhof, F., Visser, P. J., Teunissen, C. E., Scheltens, P., van der Flier, W. M., & Tijms, B. M. (2017) · Alzheimer s Research & Therapy · doi:10.1186/s13195-017-0299-x · Cited by 33
Validity and reliability of the medial temporal lobe atrophy scale in a memory clinic population
Molinder, A., Ziegelitz, D., Maier, S. E., & Eckerström, C. (2021) · BMC Neurology · doi:10.1186/s12883-021-02325-2 · Cited by 32
Johnson, J. K., Pa, J., Boxer, A. L., Kramer, J. H., Freeman, K. M., & Yaffe, K. S. (2010) · Dementia and Geriatric Cognitive Disorders · doi:10.1159/000318836 · Cited by 33
Event time analysis of longitudinal neuroimage data
Sabuncu, M. R., Bernal-Rusiel, J. L., Reuter, M., Greve, D. N., & Fischl, B. R. (2014) · NeuroImage · doi:10.1016/j.neuroimage.2014.04.015 · Cited by 33
A fuzzy-based system reveals Alzheimer’s Disease onset in subjects with Mild Cognitive Impairment
Tangaro, S., Fanizzi, A., Amoroso, N., & Bellotti, R. (2017) · Physica Medica · doi:10.1016/j.ejmp.2017.04.027 · Cited by 32
Evaluating Alzheimer's disease biomarkers as mediators of age-related cognitive decline
Hohman, T. J., Tommet, D., Marks, S. M., Contreras, J. A., Jones, R. N., & Mungas, D. (2017) · Neurobiology of Aging · doi:10.1016/j.neurobiolaging.2017.06.022 · Cited by 33
Burggren, A. C., Renner, B., Jones, M., Donix, M., Suthana, N., Martin‐Harris, L., Ercoli, L. M., Miller, K. J., Siddarth, P., Small, G. W., et al. (2011) · International Journal of Alzheimer s Disease · doi:10.4061/2011/956053 · Cited by 35
A supervised multiview spectral embedding method for neuroimaging classification
Liu, S., Zhang, L., Cai, W., Song, Y., Wang, Z., Wen, L., & Feng, D. D. (2013) · Proceedings - International Conference on Image Processing · doi:10.1109/icip.2013.6738124 · Cited by 29
Koychev, I. G., Lawson, J., Chessell, T., Mackay, C. E., Gunn, R. N., Sahakian, B. J., Rowe, J. B., Thomas, A. J., Rochester, L., Chan, D., et al. (2019) · BMJ Open · doi:10.1136/bmjopen-2018-024498 · Cited by 31
Papp, K. V., Snyder, P. J., Maruff, P. T., Bartkowiak, J., & Pietrzak, R. H. (2011) · PLoS ONE · doi:10.1371/journal.pone.0021688 · Cited by 32
Delattre, C., Bournonville, C., Auger, F., Lopes, R., Delmaire, C., Hénon, H., Mendyk, A., Bombois, S., Devedjian, J.-C., Leys, D., et al. (2017) · Translational Stroke Research · doi:10.1007/s12975-017-0576-9 · Cited by 29
Horgusluoglu, E., Risacher, S. L., Crane, P. K., Hibar, D. P., Thompson, P. M., Saykin, A. J., Nho, K. T., Initiative, A. D. N., Weiner, M. W., Aisen, P. S. S., et al. (2019) · Scientific Reports · doi:10.1038/s41598-019-50507-3 · Cited by 30
Self-citationSloan, C., Shen, L., West, J. D., Wishart, H. A., Flashman, L. A., Rabin, L. A., Santulli, R. B., Guerin, S. J., Rhodes, C. H., Tsongalis, G. J., et al. (2010) · American Journal of Medical Genetics Part B Neuropsychiatric Genetics · doi:10.1002/ajmg.b.31078 · Cited by 28
Self-citationGenius, J., Klafki, H., Benninghoff, J., Esselmann, H., & Wiltfang, J. (2012) · European Archives of Psychiatry and Clinical Neuroscience · doi:10.1007/s00406-012-0362-3 · Cited by 29
Zhao, L., Initiative, A. D. N., Luo, Y., Lew, D., Liu, W., Au, L. W. C., Mok, V., & Shi, L. (2019) · Aging · doi:10.18632/aging.102184 · Cited by 28
Tabatabaei-Jafari, H., Shaw, M. E., Walsh, E., & Cherbuin, N. (2019) · Neurobiology of Aging · doi:10.1016/j.neurobiolaging.2019.08.033 · Cited by 29
Jiang, S., Xie, Y., & Colditz, G. A. (2020) · Journal of the Royal Statistical Society Series C (Applied Statistics) · doi:10.1111/rssc.12449 · Cited by 27
Neuroinflammation and Brain Functional Disconnection in Alzheimer’s Disease
Baglio, F., Saresella, M., Preti, M. G., Cabinio, M., Griffanti, L., Marventano, I., Piancone, F., Calabrese, E., Nemni, R., & Clerici, M. (2013) · Frontiers in Aging Neuroscience · doi:10.3389/fnagi.2013.00081 · Cited by 29
Exercise, the diurnal cycle of cortisol and cognitive impairment in older adults
Tortosa‐Martínez, J., Manchado, C., Cortell-Tormo, J. M., & Chulvi‐Medrano, I. (2018) · Neurobiology of Stress · doi:10.1016/j.ynstr.2018.08.004 · Cited by 28
Biomarkers in Alzheimer’s, Frontotemporal, Lewy Body, and Vascular Dementias
Koenig, A. M., Nobuhara, C. K., Williams, V. J., & Arnold, S. E. (2018) · FOCUS The Journal of Lifelong Learning in Psychiatry · doi:10.1176/appi.focus.20170048 · Cited by 29
Nour, A. E. A. M., Jiao, Y., Teng, G., & Initiative, A. D. N. (2020) · Acta Neurologica Belgica · doi:10.1007/s13760-020-01349-8 · Cited by 27
Interactions Between Aging and Alzheimer’s Disease on Structural Brain Networks
Wu, Z., Gao, Y., Potter, T. B. H., Benoit, J. S., Shen, J. F., Schulz, P. E., Zhang, Y., & Initiative, A. T. A. D. N. (2021) · Frontiers in Aging Neuroscience · doi:10.3389/fnagi.2021.639795 · Cited by 29
Discovery of Novel Markers for Identifying Cognitive Decline Using Neuron-Derived Exosomes
Zhong, J., Ren, X., Liu, W., Wang, S., Lv, Y., Nie, L., Lin, R., Tian, X., Yang, X., Zhu, F., et al. (2021) · Frontiers in Aging Neuroscience · doi:10.3389/fnagi.2021.696944 · Cited by 28
Nho, K. T., Shen, L., Kim, S., Risacher, S. L., West, J. D., Foroud, T., Jack, C. R., Weiner, M. W., & Saykin, A. J. (2010) · PubMed Central · Cited by 27
Self-citationRole of tau versus TDP‐43 pathology on medial temporal lobe atrophy in aging and Alzheimer's disease
Wisse, L. E. M., Wuestefeld, A., Murray, M. E., Jagust, W. J., & Joie, R. L. (2025) · Alzheimer s & Dementia · doi:10.1002/alz.14582 · Cited by 24
Tortosa‐Martínez, J., & Clow, A. (2012) · Stress · doi:10.3109/10253890.2011.629323 · Cited by 29
Bayesian functional joint models for multivariate longitudinal and time-to-event data
Li, K., & Luo, S. (2018) · Computational Statistics & Data Analysis · doi:10.1016/j.csda.2018.07.015 · Cited by 27
Recent Advances in Imaging Alzheimer's Disease
Braskie, M. N., Toga, A. W., & Thompson, P. M. (2012) · Journal of Alzheimer s Disease · doi:10.3233/jad-2012-129016 · Cited by 26
Current Therapies and New Strategies for the Management of Alzheimer’s Disease
Aderinwale, O. G., Ernst, H. W., & Mousa, S. A. (2010) · American Journal of Alzheimer s Disease & Other Dementias® · doi:10.1177/1533317510372372 · Cited by 27
Thalamic volume loss as an early sign of amnestic mild cognitive impairment
Zidan, M., Boban, J. M., Bjelan, M., Todorović, A., Stankov, T. V., Semnic, M. D., Boban, N., & Kozic, D. B. (2019) · Journal of Clinical Neuroscience · doi:10.1016/j.jocn.2019.07.004 · Cited by 27
Localized Sparse Code Gradient in Alzheimer's disease staging
Liu, S., Cai, W., Song, Y., Pujol, S., Kikinis, R., Wen, L., & Feng, D. D. (2013) · Annual International Conference of the IEEE Engineering in Medicine and Biology Society (EMBC) · doi:10.1109/embc.2013.6610769 · Cited by 25
Ferrari, B. L., Neto, G. D. C. C., Nucci, M. P., Mamani, J. B., Lacerda, S. S., Felicio, A. C., Amaro, E., & Gamarra, L. F. (2019) · Medicine · doi:10.1097/md.0000000000017824 · Cited by 25
Predicting diagnosis 4 years prior to Alzheimer’s disease incident
Qiu, A., Xu, L., & Liu, C. (2022) · NeuroImage Clinical · doi:10.1016/j.nicl.2022.102993 · Cited by 25
Hu, X., Meier, M., & Pruessner, J. C. (2023) · Brain and Behavior · doi:10.1002/brb3.2925 · Cited by 24
Risacher, S. L., & Apostolova, L. G. (2023) · CONTINUUM Lifelong Learning in Neurology · doi:10.1212/con.0000000000001248 · Cited by 25
Self-citationPrins, N. D., van der Flier, W. M., Brashear, H. R., Knol, D. L., van de Pol, L. A., Barkhof, F., & Scheltens, P. (2013) · Journal of Alzheimer s Disease · doi:10.3233/jad-122233 · Cited by 25
Nesteruk, M., Nesteruk, T., Styczyńska, M., Barczak, A. K., Mandecka, M., Walecki, J. M., & Barcikowska, M. (2015) · Neurologia i Neurochirurgia Polska · doi:10.1016/j.pjnns.2015.09.003 · Cited by 25
Deep brain stimulation: a novel strategy for treating Alzheimer's disease.
Lyketsos, C. G., Targum, S. D., Pendergrass, J. C., & Lozano, A. M. (2012) · Europe PMC (PubMed Central) · Cited by 25
Functional changes in the cortical semantic network in amnestic mild cognitive impairment.
Pineault, J., Jolicœur, P., Grimault, S., Bermudez, P., Brambati, S. M., Lacombe, J., Villalpando, J. M., Kergoat, M., & Joubert, S. (2018) · Neuropsychology · doi:10.1037/neu0000466 · Cited by 28
van der Vlies, A. E., Staekenborg, S. S., Behloul, F., Prins, N. D., Barkhof, F., Vrenken, H., Reiber, J. H. C., Scheltens, P., & van der Flier, W. M. (2013) · Journal of Alzheimer s Disease · doi:10.3233/jad-121291 · Cited by 24
Genetic Association of HLA Gene Variants with MRI Brain Structure in Alzheimer’s Disease
Initiative, A. D. N., Wang, Z., Wan, Y., Tan, L., Liu, J., Wang, H.-F., Sun, F.-R., Tan, C., Tan, C.-C., Jiang, T., et al. (2016) · Molecular Neurobiology · doi:10.1007/s12035-016-9889-z · Cited by 24
Xu, W., Initiative, A. D. N., Su, B., Shen, X., Bi, Y., Tan, C., Li, J., Cao, X., Dong, Q., Tan, L., et al. (2020) · Aging · doi:10.18632/aging.103497 · Cited by 24
Liu, S., Cai, W., Wen, L., & Feng, D. D. (2013) · IEEE International Symposium on Biomedical Imaging (ISBI) · doi:10.1109/isbi.2013.6556779 · Cited by 23
Family History of Alzheimer’s Disease and Subjective Memory Performance
Haußmann, R., Ganske, S., Gruschwitz, A., Werner, A., Osterrath, A., Lange, J., Buthut, M., Donix, K. L., Linn, J., & Donix, M. (2018) · American Journal of Alzheimer s Disease & Other Dementias® · doi:10.1177/1533317518775033 · Cited by 23
Casanova, R., Espeland, M. A., Goveas, J. S., Davatzikos, C. A., Gaussoin, S. A., Maldjian, J. A., Brunner, R. L., Kuller, L. H., Johnson, K., Mysiw, W. J., et al. (2011) · Magnetic Resonance Imaging · doi:10.1016/j.mri.2010.12.001 · Cited by 22
Long, X., Jiang, C., & Zhang, L. (2018) · Behavioural Neurology · doi:10.1155/2018/3954101 · Cited by 22
Mapping cerebral atrophic trajectory from amnestic mild cognitive impairment to Alzheimer’s disease
Wei, X., Du, X., Xie, Y., Suo, X., He, X., Ding, H., Zhang, Y., Ji, Y., Chai, C., Liang, M., et al. (2022) · Cerebral Cortex · doi:10.1093/cercor/bhac137 · Cited by 22
Research Progress on the Pathogenesis, Diagnosis, and Drug Therapy of Alzheimer’s Disease
Yang, Y., & Qiu, L. (2024) · Brain Sciences · doi:10.3390/brainsci14060590 · Cited by 22
Transcriptomics of cortical gray matter thickness decline during normal aging
Kochunov, P., Charlesworth, J., Winkler, A. M., Hong, L. E., Nichols, T. E., Curran, J. E., Sprooten, E., Jahanshad, N., Thompson, P. M., Johnson, M. P., et al. (2013) · NeuroImage · doi:10.1016/j.neuroimage.2013.05.066 · Cited by 23
Promteangtrong, C., Kolber, M., Ramchandra, P., Moghbel, M. C., Houshmand, S., Schöll, M., Bai, H., Werner, T. J., Alavi, A. A., & Buchpiguel, C. A. (2015) · Dementia & Neuropsychologia · doi:10.1590/1980-57642015dn94000318 · Cited by 21
Ma, J., Initiative, A. D. N., Zhang, W., Tan, L., Wang, H.-F., Wan, Y., Sun, F.-R., Tan, C.-C., Yu, J.-T., & Tan, L. (2016) · Oncotarget · doi:10.18632/oncotarget.9563 · Cited by 23
Schneider, C. B., Donix, M., Linse, K., Werner, A., Fauser, M., Klingelhoefer, L., Löhle, M., von Kummer, R., Reichmann, H., & Storch, A. (2017) · American Journal of Alzheimer s Disease & Other Dementias® · doi:10.1177/1533317517698794 · Cited by 21
One-year Outcome of Shanghai Mild Cognitive Impairment Cohort Study
Zhou, B., Zhao, Q., Kojima, S., Ding, D., Higashide, S., Nagai, Y., Guo, Q., Kagimura, T., Fukushima, M., & Hong, Z. (2018) · Current Alzheimer Research · doi:10.2174/1567205016666181128151144 · Cited by 21
Kudoh, C., Hori, T., Yasaki, S., Ubagai, R., & Tabira, T. (2020) · Journal of Alzheimer s Disease Reports · doi:10.3233/adr-200211 · Cited by 21
Puga, A. M., Ruperto, M., Samaniego-Vaesken, M. D. L., Montero-Bravo, A., Partearroyo, T., & Varela‐Moreiras, G. (2021) · Nutrients · doi:10.3390/nu13092966 · Cited by 23
Differences in Medication Use in the Alzheimerʼs Disease Neuroimaging Initiative
Epstein, N. U., Saykin, A. J., Risacher, S. L., Gao, S., & Farlow, M. R. (2010) · Drugs & Aging · doi:10.2165/11538260-000000000-00000 · Cited by 21
Self-citationSpampinato, M. V., Langdon, B., Patrick, K., Parker, R., Collins, H., Pravatà, E., & Initiative, F. T. A. D. N. (2016) · Neuroradiology · doi:10.1007/s00234-016-1740-8 · Cited by 17
Uysal, G., & Öztürk, M. (2020) · Medical Technologies Congress (TIPTEKNO) · doi:10.1109/tiptekno50054.2020.9299217 · Cited by 21
Postmortem Dissections of the Papez Circuit and Nonmotor Targets for Functional Neurosurgery
Alcântara, T., Middlebrooks, E. H., Tzu, W. H., Neto, M. R., & Holanda, V. M. (2020) · World Neurosurgery · doi:10.1016/j.wneu.2020.09.088 · Cited by 20
Diagnosis of Alzheimer's Disease Based on Deeply-Fused Nets
Chen, C. Z., Wu, Q., Li, Z., Xiao, L., & Hu, Z. Y. (2020) · Combinatorial Chemistry & High Throughput Screening · doi:10.2174/1386207323666200825092649 · Cited by 19
Akram, A. S., Grezenko, H., Singh, P., Ahmed, M., Hassan, B. D., Anand, V. H., Elashry, A. R., Nazir, F., & Khan, R. (2024) · Cureus · doi:10.7759/cureus.61335 · Cited by 20
Alber, J., Arthur, E., Sinoff, S. E., DeBuc, D. C., Chew, E. Y., Douquette, L., Hatch, W. V., Hudson, C., Kashani, A. H., Lee, C. S., et al. (2020) · Alzheimer s & Dementia Diagnosis Assessment & Disease Monitoring · doi:10.1002/dad2.12119 · Cited by 19
Cognitive impairment and medial temporal lobe structure in young adults with a depressive episode
Donix, M., Haußmann, R., Helling, F., Zweiniger, A., Lange, J., Werner, A., Donix, K. L., Brandt, M., Linn, J., Bauer, M., et al. (2018) · Journal of Affective Disorders · doi:10.1016/j.jad.2018.05.015 · Cited by 20
GN-SCCA: GraphNet Based Sparse Canonical Correlation Analysis for Brain Imaging Genetics
Du, L., Yan, J., Kim, S., Risacher, S. L., Huang, H., Inlow, M. H., Moore, J. H., Saykin, A. J., Shen, L., & Initiative, A. D. N. (2015) · Lecture notes in computer science · doi:10.1007/978-3-319-23344-4_27 · Cited by 18
Self-citationMascalchi, M., Ginestroni, A., Bessi, V., Toschi, N., Padiglioni, S., Ciulli, S., Tessa, C., Giannelli, M., Bracco, L., & Diciotti, S. (2013) · American Journal of Neuroradiology · doi:10.3174/ajnr.a3568 · Cited by 18
Hori, T., Sanjo, N., Tomita, M., & Mizusawa, H. (2013) · Dementia and Geriatric Cognitive Disorders · doi:10.1159/000346738 · Cited by 18
Gordon, C. A., & Martin, D. J. (2013) · Expert Review of Neurotherapeutics · doi:10.1586/14737175.2013.856265 · Cited by 21
Fayed, N. M., Modrego, P. J., García‐Martí, G., Sanz‐Requena, R., & Martí‐Bonmatí, L. (2016) · Magnetic Resonance Imaging · doi:10.1016/j.mri.2016.12.010 · Cited by 19
Molecular Markers of Amnestic Mild Cognitive Impairment among Mexican Americans
Edwards, M., Hall, J. R., Williams, B. J., Johnson, L. A., & O’Bryant, S. E. (2015) · Journal of Alzheimer s Disease · doi:10.3233/jad-150553 · Cited by 17
Precuneus Structure Changes in Amnestic Mild Cognitive Impairment
Haußmann, R., Werner, A., Gruschwitz, A., Osterrath, A., Lange, J., Donix, K. L., Linn, J., & Donix, M. (2016) · American Journal of Alzheimer s Disease & Other Dementias® · doi:10.1177/1533317516678087 · Cited by 17
An attention-based context-informed deep framework for infant brain subcortical segmentation
Chen, L., Wu, Z., Zhao, F., Wang, Y., Lin, W., Wang, L., & Li, G. (2023) · NeuroImage · doi:10.1016/j.neuroimage.2023.119931 · Cited by 16
Chen, L., Wang, Y., Wu, Z., Shan, Y., Li, T., Hung, S., Xing, L., Hongtu Zhu, B., Wang, L., Lin, W., et al. (2023) · Nature Communications · doi:10.1038/s41467-023-38974-9 · Cited by 17
Persson, K., Barca, M. L., Eldholm, R. S., Cavallin, L., Benth, J. Š., Selbæk, G., Brækhus, A., Saltvedt, I. T., & Engedal, K. (2017) · Dementia and Geriatric Cognitive Disorders · doi:10.1159/000477342 · Cited by 17
Cross-View Neuroimage Pattern Analysis in Alzheimer's Disease Staging
Liu, S., Cai, W., Pujol, S., Kikinis, R., & Feng, D. D. (2016) · Frontiers in Aging Neuroscience · doi:10.3389/fnagi.2016.00023 · Cited by 17
Hippocampal sclerosis of aging at post‐mortem is evident on MRI more than a decade prior
Ortega‐Cruz, D., Iglesias, J. E., Rábano, A., & Strange, B. A. (2023) · Alzheimer s & Dementia · doi:10.1002/alz.13352 · Cited by 16
Uysal, G., & Öztürk, M. (2023) · Multimedia Tools and Applications · doi:10.1007/s11042-023-16413-7 · Cited by 16
Increasing the Diagnostic Accuracy of Medial Temporal Lobe Atrophy in Alzheimer's Disease
Jacobs, H. I. L., van Boxtel, M. P. J., der Elst, W. V., Burgmans, S., Smeets, F., Gronenschild, E. H. B. M., Verhey, F. R. J., Uylings, H. B. M., & Jolles, J. (2011) · Journal of Alzheimer s Disease · doi:10.3233/jad-2011-102043 · Cited by 15
Espinosa, A., for the AB255 Study Group, Initiative, A. D. N., Alegret, M., Pesini, P., Valero, S., Lafuente, A., Buendía, M., José, I. S., Ibarria, M., et al. (2017) · Journal of Alzheimer s Disease · doi:10.3233/jad-161223 · Cited by 16
Pei, Z., Gou, Y., Ma, M., Guo, M., Leng, C., Chen, Y.-L., & Li, J. (2021) · Multimedia Tools and Applications · doi:10.1007/s11042-021-11279-z · Cited by 17
ROC analysis for multiple markers with tree-based classification
Wang, M., & Li, S. (2012) · Lifetime Data Analysis · doi:10.1007/s10985-012-9233-5 · Cited by 15
Metadata
- Authors
- Risacher, S., Saykin, A., Wes, J., Shen, L., Firpi, H., & McDonald, B.
- Affiliations
- Indiana University School of Medicine (US)
- Indiana University Bloomington (US)
- Corresponding author
- Saykin, Andrew
- Venue
- Current Alzheimer Research
- Publisher
- Bentham Science Publishers Ltd.
- Published
- 2009-08-01
- Volume
- 6
- Issue
- 4
- Pages
- 347-361
- ISSN
- 1567-2050 (ISSN-L)
- PMC
- PMC2764863
- OpenAlex
- W2128422359
- Cited by
- 538
- References
- 90
- Citations by year
- 2026: 18 · 2025: 11 · 2024: 21 · 2023: 23 · 2022: 20 · 2021: 29 · 2020: 39 · 2019: 36 · 2018: 44 · 2017: 38 · 2016: 41 · 2015: 29 · 2014: 31 · 2013: 46 · 2012: 33
- FWCI
- 22.68
- Type
- journal article
- Language
- en
- Open access
- bronze
- doi.org
- Locations
- Current Alzheimer Research (publishedVersion)
- PubMed Central (publishedVersion, cc-by)
- PubMed (publishedVersion)
- IUScholarWorks (Indiana University) (submittedVersion, cc-by)
- Funders
- Brigham Young University
- National Institutes of Health (5u01ag024904-10)
- School of Medicine, Indiana University
- National Institute on Aging (U01-AG-024904, P30AG010133, R01 AG19771, R01AG019771, U19AG010483, P30 AG-10133)
- National Institute of Biomedical Imaging and Bioengineering (R03EB008674)
- Topics
- Health Sciences › Medicine › Psychiatry and Mental health › Dementia and Cognitive Impairment Research
- Life Sciences › Neuroscience › Cellular and Molecular Neuroscience › Alzheimer's disease research and treatments
- Health Sciences › Medicine › Oncology › Cancer-related cognitive impairment studies
- Keywords
- Alzheimer's disease, amnestic mild cognitive impairment, neuroimaging biomarkers, hippocampal volume, gray matter density, amygdala, entorhinal cortex, cortical thickness, medial temporal lobe atrophy, structural MRI, voxel-based morphometry, MPRAGE, disease progression prediction
- MeSH terms
- Aged, Aged, 80 and over, Alzheimer Disease, Analysis of Variance, Atrophy, Brain Mapping, Cerebral Cortex, Cognition Disorders, Female, Hippocampus, Humans, Image Interpretation, Computer-Assisted, Image Processing, Computer-Assisted, Magnetic Resonance Imaging, Male, Middle Aged, Neuropsychological Tests, Organ Size, Predictive Value of Tests, Multivariate Analysis, Disease Progression
About these checks
Registry, retraction, Cites and statistics results are computed, not judged, with one exception: a printed reference that no index lists is read once by a model before it counts as a citation error. Claims are extracted by a model and kept only when their quote appears verbatim in the text; each cited source is then checked, with a model’s help, for whether it says what the claim relies on. Those verdicts can be wrong — read the claim’s quote and the cited source before relying on one.
Statistics and arithmetic are recomputed, not judged.
Confidence bands are shown only for fields calibrated on our annotated test set. None is calibrated yet, so no band is shown.
What counts as a claim ›How we measure confidence ›How we check this ›
Are you an author, or do you see a problem with this page? Request a review
