

The DOI matches its Crossref record; 28 of the 28 references it cites were found in a registry or an index.
Inflammation Is Necessary for Long-Term but Not Short-Term High-Fat Diet–Induced Insulin Resistance
Open accessAbstract
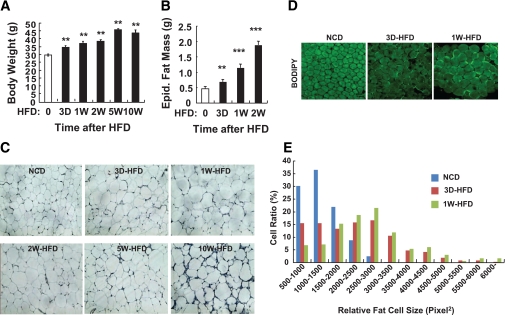
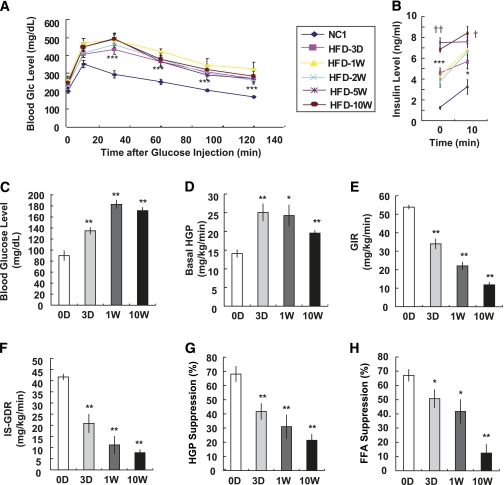
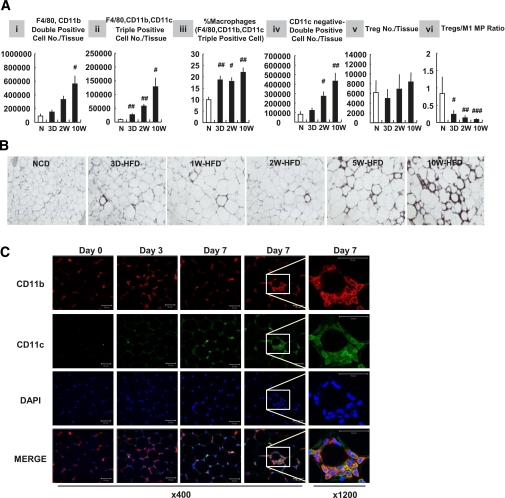
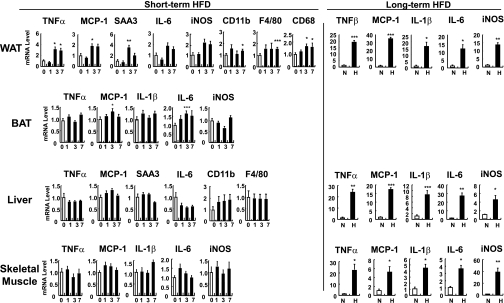
OBJECTIVE: Tissue inflammation is a key factor underlying insulin resistance in established obesity. Several models of immuno-compromised mice are protected from obesity-induced insulin resistance. However, it is unanswered whether inflammation triggers systemic insulin resistance or vice versa in obesity. The purpose of this study was to assess these questions. RESEARCH DESIGN AND METHODS: We fed a high-fat diet (HFD) to wild-type mice and three different immuno-compromised mouse models (lymphocyte-deficient Rag1 knockout, macrophage-depleted, and hematopoietic cell-specific Jun NH2-terminal kinase–deficient mice) and measured the time course of changes in macrophage content, inflammatory markers, and lipid accumulation in adipose tissue, liver, and skeletal muscle along with systemic insulin sensitivity. RESULTS: In wild-type mice, body weight and adipose tissue mass, as well as insulin resistance, were clearly increased by 3 days of HFD. Concurrently, in the short-term HFD period inflammation was selectively elevated in adipose tissue. Interestingly, however, all three immuno-compromised mouse models were not protected from insulin resistance induced by the short-term HFD. On the other hand, lipid content was markedly increased in liver and skeletal muscle at day 3 of HFD. CONCLUSIONS: These data suggest that the initial stage of HFD-induced insulin resistance is independent of inflammation, whereas the more chronic state of insulin resistance in established obesity is largely mediated by macrophage-induced proinflammatory actions. The early-onset insulin resistance during HFD feeding is more likely related to acute tissue lipid overload.
Overview
The claims and statistics of this paper haven’t been checked yet.
Run the check — free, no account needed. It reads the open-access text and checks the sources it cites.
Integrity signals
Registry
Cites
Statistics
Figures
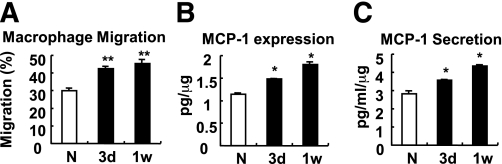
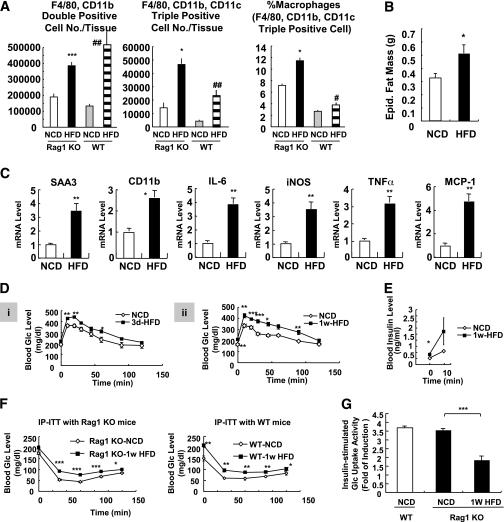
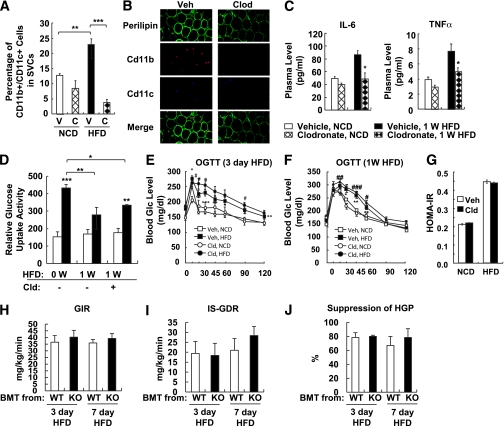
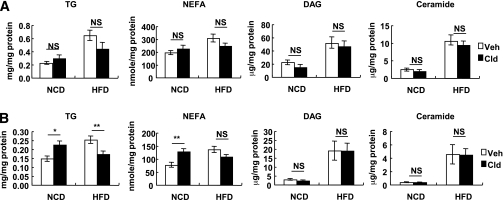
Verification
Claims the paper makes
The claims and statistics of this paper haven’t been checked yet.
Run the check — free, no account needed. It reads the open-access text and checks the sources it cites.
Claims other papers make about this one
Each is checked against this paper’s own text: does it say what the citing paper says it does?
In the citing paper
“Lee et al. demonstrated a mild proinflammatory response in the epididymal adipose depot of mice fed a HFD for three days (16), and the proinflammatory polarization of macrophages was of particular importance in this response.”
From The ominous triad of adipose tissue dysfunction: inflammation, fibrosis, and impaired angiogenesis. (2017) · cites this paper as [16]
Self-check
Percentages, sums and reported differences re-computed from the paper’s own numbers.
The self-check needs the paper’s full text.
Citations
Cites
Obesity is associated with macrophage accumulation in adipose tissue
Weisberg, S. P., McCann, D., Desai, M., Rosenbaum, M., Leibel, R. L., & Ferrante, A. W. (2003) · Journal of Clinical Investigation · doi:10.1172/jci200319246 · Cited by 10,041
Xu, H., Barnes, G. T., Yang, Q., Tan, G., Yang, D., Chou, C. J., Sole, J., Nichols, A., Ross, J. S., Tartaglia, L. A., et al. (2003) · Journal of Clinical Investigation · doi:10.1172/jci200319451 · Cited by 6,760
Obesity induces a phenotypic switch in adipose tissue macrophage polarization
Lumeng, C. N., Bodzin, J. L., & Saltiel, A. R. (2007) · Journal of Clinical Investigation · doi:10.1172/jci29881 · Cited by 4,664
TLR4 links innate immunity and fatty acid-induced insulin resistance
Shi, H., Kokoeva, M. V., Inouye, K., Tzameli, I., Yin, H., & Flier, J. S. (2006) · Journal of Clinical Investigation · doi:10.1172/jci28898 · Cited by 3,690
Oh, D. Y., Talukdar, S., Bae, E. J., Imamura, T., Morinaga, H., Fan, W., Li, P., Lu, W. J., Watkins, S. M., & Olefsky, J. M. (2010) · Cell · doi:10.1016/j.cell.2010.07.041 · Cited by 2,428
Self-citationNishimura, S., Manabe, I., Nagasaki, M., Eto, K., Yamashita, H., Ohsugi, M., Otsu, M., Hara, K., Ueki, K., Sugiura, S., et al. (2009) · Nature Medicine · doi:10.1038/nm.1964 · Cited by 2,230
Feuerer, M., Herrero, L., Cipolletta, D., Naaz, A., Wong, J., Nayer, A., Lee, J., Goldfine, A. B., Benoist, C., Shoelson, S., et al. (2009) · Nature Medicine · doi:10.1038/nm.2002 · Cited by 2,145
Mechanism of free fatty acid-induced insulin resistance in humans.
Roden, M., Price, T. B., Perseghin, G., Petersen, K. F., Rothman, D. L., Cline, G. W., & Shulman, G. I. (1996) · Journal of Clinical Investigation · doi:10.1172/jci118742 · Cited by 1,539
Normalization of obesity-associated insulin resistance through immunotherapy
Winer, S., Chan, Y., Paltser, G., Truong, D., Tsui, H., Bahrami, J., Dorfman, R., Wang, Y., Zielenski, J., Mastronardi, F., et al. (2009) · Nature Medicine · doi:10.1038/nm.2001 · Cited by 1,370
Holland, W. L., Brozinick, J. T., Wang, L.-P., Hawkins, E. D., Sargent, K. M., Liu, Y., Narra, K., Hoehn, K. L., Knotts, T. A., Siesky, A., et al. (2007) · Cell Metabolism · doi:10.1016/j.cmet.2007.01.002 · Cited by 1,232
Cited by
Sorted by citations
Items 401–500 of 564
Short-term HFD does not alter lipolytic function of adipocytes
Wiedemann, M. S. F., Wueest, S., Grob, A., Item, F., Schoenle, E. J., & Konrad, D. (2014) · Adipocyte · doi:10.4161/adip.27575 · Cited by 9
Immunocytochemical Localization of Olfactory-signaling Molecules in Human and Rat Spermatozoa
Makeyeva, Y., Nicol, C., Ledger, W. J., & Ryugo, D. K. (2020) · Journal of Histochemistry & Cytochemistry · doi:10.1369/0022155420939833 · Cited by 9
Stewart, E. J., Dye, J. A., Schladweiler, M. C. J., Phillips, P. M., McDaniel, K. L., Richards, J. H., Grindstaff, R. D., Padgett, W. T., Moore, M. L., Hill, D., et al. (2022) · The FASEB Journal · doi:10.1096/fj.202201514r · Cited by 9
Zhang, X., Wang, L., Wang, Y., He, L., Xu, D., Yan, E., Guo, J., Ma, C., Zhang, P., & Yin, J. (2023) · Cell Death Discovery · doi:10.1038/s41420-023-01389-y · Cited by 9
Muller, C. H. D. L., Schroeder, H. T., Rodrigues-Krause, J. D. C., & Krause, M. D. S. (2023) · Cell Stress and Chaperones · doi:10.1007/s12192-023-01368-3 · Cited by 11
Gastric Bypass Surgery Reverses Diabetic Phenotypes in Bdnf-Deficient Mice
Jiang, S., Wang, Q., Huang, Z., Song, A., Peng, Y., Hou, S., Guo, S., Zhu, W., Yan, S., Lin, Z., et al. (2016) · American Journal Of Pathology · doi:10.1016/j.ajpath.2016.04.009 · Cited by 9
Adipoz doku ve adipoz dokudan salgılanan bazı proteinler
DEMİRCİ, Ş., & Gün, C. (2017) · Mehmet Akif Ersoy Üniversitesi Sağlık Bilimleri Enstitüsü Dergisi · doi:10.24998/maeusabed.338105 · Cited by 9
Emond, C., DeVito, M. J., Diliberto, J. J., & Birnbaum, L. S. (2018) · Toxicological Sciences · doi:10.1093/toxsci/kfy078 · Cited by 9
Analysis of the Associations between Obesity Indices and Left Ventricular Mass
Feng, P., Huang, Y., Wang, S., Yu, G., Li, G., Lei, H., Qin, S., & Huang, W. (2018) · Cardiology · doi:10.1159/000496177 · Cited by 8
Li, R., Li, K., Zhang, L., Wang, L., Chen, N., Deng, X., Luo, M., & Wu, J. (2019) · Journal of Tissue Engineering and Regenerative Medicine · doi:10.1002/term.2913 · Cited by 9
Brain Control of Plasma Cholesterol Involves Polysialic Acid Molecules in the Hypothalamus
Brénachot, X., Gautier, T., Nédélec, E., Deckert, V., Laderrière, A., Nuzzaci, D., Rigault, C., Lemoine, A., Pénicaud, L., Lagrost, L., et al. (2017) · Frontiers in Neuroscience · doi:10.3389/fnins.2017.00245 · Cited by 9
Gut Peptide Agonism in the Treatment of Obesity and Diabetes
Grandl, G., Novikoff, A., DiMarchi, R. D., Tschöp, M. H., & Müller, T. D. (2019) · Comprehensive physiology · doi:10.1002/cphy.c180044 · Cited by 10
Brayner, B., Keske, M. A., Roberts‐Thomson, K. M., Parker, L., Betik, A. C., Thomas, H. J., Mason, S. A., Way, K. L., Livingstone, K. M., Hamilton, D. L., et al. (2024) · American Journal of Physiology-Endocrinology and Metabolism · doi:10.1152/ajpendo.00070.2024 · Cited by 8
Immunometabolism in obesity: Understanding the beneficial and detrimental roles of inflammation
Lee, Y. S. (2026) · PLoS Biology · doi:10.1371/journal.pbio.3003620 · Cited by 11
Self-citationSomalou, P., Ieronymaki, E., Feidaki, K., Prapa, I., Stylianopoulou, E., Spyridopoulou, K., Skavdis, G., Grigoriou, M. E., Panas, P., Argiriou, A., et al. (2024) · Microorganisms · doi:10.3390/microorganisms12020231 · Cited by 7
Paul, A., Chanclón, B., Brännmark, C., Wittung-Stafshede, P. E., Olofsson, C. S., Asterholm, I. W., & Parekh, S. H. (2023) · Journal of Cellular Biochemistry · doi:10.1002/jcb.30372 · Cited by 8
Król, E., Okulicz, M., & Kupsz, J. (2020) · Biological Trace Element Research · doi:10.1007/s12011-020-02100-3 · Cited by 8
A pref-1-controlled non-inflammatory mechanism of insulin resistance
Huang, Y., Cui, D., Chen, L., Tong, H., Wu, H., Muller, G. K., Qi, Y., Wang, S., Xu, J., Gao, X., et al. (2023) · iScience · doi:10.1016/j.isci.2023.106923 · Cited by 7
Adipose Tissue Stromal Cells: Rheostats for Adipose Tissue Function and Metabolic Disease Risk
Scheidl, T. B., Wager, J. L., & Thompson, J. A. (2025) · Canadian Journal of Cardiology · doi:10.1016/j.cjca.2025.02.025 · Cited by 8
Extracellular vesicles released by steatotic hepatocytes alter adipocyte metabolism
Mleczko, J., Royo, F., Samuelson, I., Clos‐Garcia, M., Williams, C., Cabrera, D., Azparren‐Angulo, M., González, E., Garcia‐Vallicrosa, C., Carobbio, S., et al. (2022) · Journal of Extracellular Biology · doi:10.1002/jex2.32 · Cited by 7
Adipocyte gene expression in obesity — insights gained and challenges ahead
Markussen, L. K., & Mandrup, S. (2023) · Current Opinion in Genetics & Development · doi:10.1016/j.gde.2023.102060 · Cited by 7
Immunologic and metabolic effects of high-refined carbohydrate-containing diet in food allergic mice
Yamada, L. T. P., Oliveira, M. C., Batista, N. V., Fonseca, R. C., Pereira, R. V. S., Perez, D., Teixeira, M. M., Cara, D. C., & Ferreira, A. V. M. (2015) · Nutrition · doi:10.1016/j.nut.2015.08.011 · Cited by 7
Neuro-immune Interactions in Metabolic Regulation: Brain and Adipose Tissue Crosstalk
Lee, C. H. (2025) · Journal of Obesity & Metabolic Syndrome · doi:10.7570/jomes25050 · Cited by 6
Dewhurst-Trigg, R., Wadley, A. J., Woods, R. M., Sherar, L. B., BISHOP, N. C., Hulston, C. J., & Markey, O. (2020) · The Journal of Clinical Endocrinology & Metabolism · doi:10.1210/clinem/dgaa158 · Cited by 6
Pan, T., Yang, B., Yao, S., Wang, R., & Zhu, Y. (2024) · Life Sciences · doi:10.1016/j.lfs.2024.122802 · Cited by 5
Anti-inflammatory effect of Angiotensin 1-7 in white adipose tissue
Nishida, N., Sugimoto, S., Miyagaki, S., Cho, C., Konishi, M., Goda, T., Yamaguchi, M., Kawabe, Y., Morimoto, H., Kusuyama, J., et al. (2025) · Adipocyte · doi:10.1080/21623945.2024.2449027 · Cited by 6
Antidiabetic Effects of Bisamide Derivative of Dicarboxylic Acid in Metabolic Disorders
Pakhomova, A. V., Nebolsin, V. E., Pershina, О. V., Krupin, V. A., Sandrikina, L. A., Pan, E. S., Ermakova, N. N., Ваизова, О. Е., Widera, D., Grimm, W., et al. (2020) · International Journal of Molecular Sciences · doi:10.3390/ijms21030991 · Cited by 6
Brown, M., & Matveyenko, A. V. (2022) · Frontiers in Endocrinology · doi:10.3389/fendo.2022.842603 · Cited by 7
Molecular Mechanisms Involved in Insulin Resistance: Recent Updates and Future Challenges
Singh, A., Ghai, N., & Bedi, P. M. S. (2022) · IntechOpen eBooks · doi:10.5772/intechopen.104806 · Cited by 9
Yu, H., Raza, S. H. A., Pan, Y., Cheng, G., Mei, C., & Zan, L. (2023) · Animals · doi:10.3390/ani13061060 · Cited by 8
The Pivotal Role of Macrophages in Metabolic Distress
Roberts, J., Fallon, P. G., & Hams, E. (2019) · IntechOpen eBooks · doi:10.5772/intechopen.86474 · Cited by 8
Targeting white adipose tissue to combat insulin resistance
Huang, Y., Gao, P., Young, L. H., & Qi, D. (2024) · Trends in Pharmacological Sciences · doi:10.1016/j.tips.2024.06.008 · Cited by 5
Impact of Short-Term Lipid Overload on Whole-Body Physiology
Keles, U., Kalem-Yapar, N. E., Hultén, H., Zhao, L. N., & Kaldis, P. (2024) · Molecular and Cellular Biology · doi:10.1080/10985549.2024.2438814 · Cited by 7
Țaranu, I., Răcătăianu, N., Drugan, C., Cătană, C.-S., Mirea, A.-M., Miclea, D., & Bolboaca, S. D. (2023) · Children · doi:10.3390/children10010124 · Cited by 5
CD40 signaling and hepatic steatosis: Unanticipated links
Lepreux, S., Villeneuve, J., Dewitte, A., Bérard, A. M., Desmoulière, A., & Ripoche, J. (2016) · Clinics and Research in Hepatology and Gastroenterology · doi:10.1016/j.clinre.2016.11.002 · Cited by 6
The Roles of Adipose Tissue and Inflammation in Gestational Diabetes Mellitus
Simas, T. A. M., & Corvera, S. (2014) · Internal Medicine Open Access · doi:10.4172/2165-8048.s6-010 · Cited by 5
[Study on relationship between human ABO blood groups and type A behavior pattern].
Mao, X., Xu, M., Mu, S., Ma, Y., & He, M. (1991) · PubMed · Cited by 5
Gao, H., Luo, Z., Jin, Z., Ji, Y., & Ying, W. (2020) · bioRxiv (Cold Spring Harbor Laboratory) · doi:10.1101/2020.06.12.148809 · Cited by 5
Kotowska, D., Neuhaus, M., Heyman‐Lindén, L., Morén, B., Li, S., Kryvokhyzha, D., Berger, K., & Stenkula, K. G. (2022) · Journal of Functional Foods · doi:10.1016/j.jff.2022.105125 · Cited by 4
Effect of high-refined carbohydrate diet on intestinal integrity
Costa, K. A., Oliveira, M. C., Cordeiro, L. M. D. S., Val, C. H., Machado, F. S., Fernandes, S. O. A., Cardoso, V. N., Teixeira, M. M., Silveira, A. L. M., & Ferreira, A. V. M. (2023) · Nutrition · doi:10.1016/j.nut.2023.112084 · Cited by 5
Unraveling the mysteries of hepatic insulin signaling: deconvoluting the nuclear targets of insulin
Kitamoto, T., & Accili, D. (2023) · Endocrine Journal · doi:10.1507/endocrj.ej23-0150 · Cited by 4
An, C., Wang, L., Liu, Y., Makinde, E. A., Li, H., & Olatunji, O. J. (2020) · Natural Product Communications · doi:10.1177/1934578x20937203 · Cited by 4
Finite verbs in Ngarla (Pama-Nyungan, Ngayarta)
Westerlund, T. (2013) · Cited by 4
Ludzki, A. C., Krueger, E. M., Gillen, J. B., Taylor, N., Middlebrook, D. O., Baldwin, T. C., Karabetsos, K. C., Schleh, M. W., & Horowitz, J. F. (2022) · Applied Physiology, Nutrition, and Metabolism · doi:10.1139/apnm-2022-0078 · Cited by 5
Alqallaf, J., Orange, S. T., Matu, J., Griffiths, A., Johnson, K. O., Stavropoulos‐Kalinoglou, A., Holliday, A., & Wilson, O. J. (2024) · Journal of Nutrition · doi:10.1016/j.tjnut.2024.02.026 · Cited by 5
Obesity, Insulin Resistance, and Inflammaging
Itariu, B. K., & Stulnig, T. M. (2013) · Elsevier eBooks · doi:10.1016/b978-0-12-397803-5.00013-7 · Cited by 5
Emerging Concepts on the Pathogenesis of Non‐Alcoholic Steatohepatitis (NASH)
Leclercq, I. A. (2013) · Wiley eBooks · doi:10.1002/9781118556153.ch5 · Cited by 5
Deng, Y., Chen, X., Guo, W., Chen, Y., Xu, L., Suo, W., Liu, W., Dai, J., Wang, K., Li, Q., et al. (2025) · Frontiers in Pharmacology · doi:10.3389/fphar.2025.1602280 · Cited by 3
CCL26 and CXCL12 preserve insulin-sensitizing macrophages in subcutaneous adipose tissue in obesity
Jeelani, I., da Cunha, F. F., Rohm, T. V., Nasamran, C. A., Wang, L., Moon, J.-S., Prakash, S., Oswari, J., Isaac, R., Murphy, C., et al. (2025) · Cell Reports · doi:10.1016/j.celrep.2025.116450 · Cited by 3
Self-citationTwo Roads Converging: Mitochondria and Inflammatory Signaling
Materon, L. A. (2014) · Clinical Immunolgy & Immunotherapy · doi:10.24966/ciit-8844/100004 · Cited by 3
Guo, C.-H., Chen, W., Liao, C.-H., Huang, K., Chen, P.-Y., & Yang, C. (2018) · International Journal of Medical Sciences · doi:10.7150/ijms.26941 · Cited by 3
Schneider, S. C. S., de Andrade, B. Z., Paz, E. D. R., Amaral, A. C., Bronczek, G. A., Lubaczeuski, C., Grassiolli, S., Koehler‐Santos, P., de Oliveira, J. R., Donadio, M. V. F., et al. (2018) · Experimental Physiology · doi:10.1113/ep087171 · Cited by 3
Kim, H., You, M., Go, G., Kim, H.-J., & Rhyu, J. (2020) · Asian Pacific Journal of Tropical Biomedicine · doi:10.4103/2221-1691.281464 · Cited by 3
Bovolini, A., Garcia, J., Andrade, M. A., & Duarte, J. A. (2020) · Physiology & Behavior · doi:10.1016/j.physbeh.2020.113040 · Cited by 5
Miralles‐Pérez, B., Nogués, M. R., Sánchez‐Martos, V., Taltavull, N., Méndez, L., Medina, I., Ramos‐Romero, S., Torres, J. L., & Romeu, M. (2021) · Foods · doi:10.3390/foods10020332 · Cited by 3
Kodela, E., Moysidou, M., Karaliota, S., Koutmani, Y., Tsakanikas, P., Kodella, K. R., Karavia, E. A., Kypreos, K. E., Kostomitsopoulos, N. G., & Karalis, K. P. (2018) · Europe PMC (PubMed Central) · Cited by 3
Knaack, D. A., Chang, J., Thomas, M. J., Sorci‐Thomas, M. G., Chen, Y., & Sahoo, D. (2023) · bioRxiv (Cold Spring Harbor Laboratory) · doi:10.1101/2023.08.21.554190 · Cited by 3
Sun, Q., Tang, H., Zhu, H., Liu, Y., Zhang, M., Che, C., Xiang, B., & Wang, S. (2024) · Endocrine · doi:10.1007/s12020-024-03883-4 · Cited by 2
Nitrogen‐Doped Multiwalled Carbon Nanotubes Trigger Immune Responses and Inhibit Fat Deposition
He, D., Xiao, X., Hu, G., Zhang, W., Yu, G., Liu, Y., Lin, Y., Lin, H., Li, X., Diao, Y., et al. (2024) · Advanced Materials Interfaces · doi:10.1002/admi.202400007 · Cited by 2
Jeong, M., McColl, T. J., & Clarke, D. C. (2025) · Applied Physiology, Nutrition, and Metabolism · doi:10.1139/apnm-2025-0017 · Cited by 4
A novel therapeutic strategy of obesity from the perspective of SPMs
Zhao, Z. (2026) · Exploration of Endocrine and Metabolic Diseases · doi:10.37349/eemd.2026.101453 · Cited by 2
A Sensitive Reporter Mouse Model to Study Adipocyte‐Derived Extracellular Vesicles In Vivo
Hansen, D. R., Sabaratnam, R., Steffensen, L. B., & Svenningsen, P. (2026) · Journal of Extracellular Vesicles · doi:10.1002/jev2.70243 · Cited by 2
Uberti, F., Galla, R., Mulè, S., Parini, F., & Molinari, C. (2026) · Nutrients · doi:10.3390/nu18091393 · Cited by 2
Sun, P., Bouwman, L. M. S., de Deugd, J.-L., van der Stelt, I., Oosting, A., Keijer, J., & van Schothorst, E. M. (2022) · International Journal of Molecular Sciences · doi:10.3390/ijms231810207 · Cited by 2
3M-Brazzein as a natural sugar substitute rescued obesity in maternal and offspring mice
Hong, S., Kim, H., Kong, K., & Hong, S. (2024) · Journal of Functional Foods · doi:10.1016/j.jff.2024.106104 · Cited by 2
Sengupta, S., & Avtanski, D. B. (2023) · Contemporary Endocrinology · doi:10.1007/978-3-031-39721-9_2 · Cited by 3
Al-Badarein, B. O., & Ahmad, M. N. (2021) · Jordan Journal of Agricultural Sciences · doi:10.35516/jjas.v17i1.64 · Cited by 2
Foley, K. P., Denou, E., Duggan, B. M., Chan, R. W., Stearns, J. C., & Schertzer, J. D. (2017) · bioRxiv (Cold Spring Harbor Laboratory) · doi:10.1101/116095 · Cited by 2
Mapping Macrophage-Fibroblast Interactions in Adipose Tissue Fibrosis
Nahmgoong, H., & Kim, J. B. (2025) · Diabetes · doi:10.2337/dbi25-0017 · Cited by 2
Self-citationHagarty-Waite, K. A., Totten, M. S., Pierce, M., Armah, S. M., & Erikson, K. M. (2022) · International Journal of Molecular Sciences · doi:10.3390/ijms232213778 · Cited by 1
Lee, E., Wang, L., Liu, J. A., & Cheung, C. (2025) · International Journal of Molecular Sciences · doi:10.3390/ijms26115422 · Cited by 1
Li, Z., Jiang, S., Chen, R., Zhang, Z., Zheng, L., He, H., Feng, R., Du, S., Qiu, W., & Ye, W. (2025) · Lipids in Health and Disease · doi:10.1186/s12944-025-02704-5 · Cited by 1
Modeling the spectrum of type 2 diabetes in mice
Grieco-St-Pierre, L., Hoyeck, M. P., Estall, J. L., & Bruin, J. E. (2026) · Endocrinology · doi:10.1210/endocr/bqag005 · Cited by 1
Matamoros-Domínguez, A., Sinausia, L., Perez-Muñoz, G., Espinosa-Cabello, J. M., García‐González, A., Rodríguez-Rodríguez, A., Castellano, J. M., Yubero‐Serrano, E. M., Montero, E., & Perona, J. S. (2026) · Nutrients · doi:10.3390/nu18040672 · Cited by 1
He, M., Liu, L., Chen, Z., Liu, Y.-T., Liu, C., Ma, M.-Y., Li, J.-R., Dong, B., Gong, J., Shen, L., et al. (2026) · Cancer Immunology and Immunotherapy · doi:10.1007/s00262-026-04341-y · Cited by 2
Duan, X., Davis, L. M., Patel, S., Bidault, G., Long, L., Jenkins, B., Yi, Y., Pushpa, P., Wesseling, J. R., Koulman, A., et al. (2026) · Science Advances · doi:10.1126/sciadv.aed0535 · Cited by 1
Kim, K., Lee, C.-H., Kim, C.-E., Park, E.-Y., Hwang, J.-S., & Oh, Y. S. (2026) · Antioxidants · doi:10.3390/antiox15060755 · Cited by 1
Skibniewska, J., Desai, S., Casell-Kelley, L., Maung, J. N., Sastry, A., McMillin, J., Day, H., Singer, K., & Varghese, M. (2026) · Frontiers in Endocrinology · doi:10.3389/fendo.2026.1814026 · Cited by 1
Enos, R. T. (2013) · Scholar Commons (University of South Carolina) · Cited by 1
Matsumoto, K., Kanazawa, A., Ikeda, F., Ohmura, C., Shimizu, T., Tamura, Y., Fujitani, Y., Kawamori, R., & Watada, H. (2013) · Diabetology International · doi:10.1007/s13340-013-0123-1 · Cited by 1
Yoshimura, S., Tomiga, Y., Nakashima, S., Ito, A., Kawakami, S., Tanaka, H., Uehara, Y., & Higaki, Y. (2017) · 体力科學 · doi:10.7600/jspfsm.66.283 · Cited by 1
Zamarron, B. F. (2017) · Deep Blue (University of Michigan) · Cited by 1
Historical perspective of matrix metalloproteases
Pulkoski‐Gross, A. (2011) · Frontiers in Bioscience-Scholar · doi:10.2741/429 · Cited by 1
Reijne, A. C., Talarovičová, A., Coolen, A., Bruggink, J. E., Čiapaitė, J., Bleeker, A., Groen, A. K., Reijngoud, D., Bakker, B. M., & van Dijk, G. (2022) · Nutrition and Healthy Aging · doi:10.3233/nha-220163 · Cited by 2
Sagñay-Novillo, A. F., Vermudez-Pirela, V. J., & Patricia-Elizabeth, V. I. (2024) · MQRInvestigar · doi:10.56048/mqr20225.8.1.2024.1343-1359
Pierre-Jerome, C. (2024) · Elsevier eBooks · doi:10.1016/b978-0-443-13328-2.00008-8 · Cited by 1
Influence of High-fat and High-cholesterol Diet on Major CYP Activities in the Liver
Suzuki, S., Sato, Y., Umegaki, K., & Chiba, T. (2016) · YAKUGAKU ZASSHI · doi:10.1248/yakushi.16-00034 · Cited by 1
Misra, B. B., Upadhayay, R. P., Mattern, V. L., Parks, J. S., Cox, L. A., Comuzzie, A. G., & Olivier, M. (2019) · bioRxiv (Cold Spring Harbor Laboratory) · doi:10.1101/554980 · Cited by 1
Terrien, J., Seugnet, I., Seffou, B., Herrero, M. J., Bowers, J., Chamas, L., Decherf, S., Duvernois‐Berthet, E., Djédiat, C., Ducos, B., et al. (2018) · bioRxiv (Cold Spring Harbor Laboratory) · doi:10.1101/504308 · Cited by 1
CD8+ Memory T Cells Encode Obesogenic Memory in White Adipose Tissue
Han, S. M., & Kim, J. B. (2026) · Diabetes · doi:10.2337/dbi26-0008 · Cited by 1
Self-citationRobb, J.-L. (2015) · UWSpace (University of Waterloo)
A genetikai diabeteskockázat hatása a csontanyagcsere–energia-háztartás kapcsolatokra
Fék, A., Buday, B., Kovács, G., Vitai, M., Vecsei, Z., Pauer, J., Literáti-Nagy, B., Bezzegh, K., Péterfai, É., & Koranyi, L. I. (2015) · Orvosi Hetilap · doi:10.1556/650.2015.30185
Stefanson, A. L. (2013) · The Atrium (University of Guelph)
Liddle, D. M. (2015) · The Atrium (University of Guelph)
PGC-1 alfa como regulador inflamatório na esteato-hepatite não-alcoólica
Barroso, W. A. (2016) · Digital Library of Theses and Dissertations (Universidade de São Paulo) · doi:10.11606/d.5.2016.tde-06062016-125337
Rajan, M. R. (2016) · Linköping University medical dissertations · doi:10.3384/doss.diva-131421
Sales, C. H. (2013) · Digital Library of Theses and Dissertations (Universidade de São Paulo) · doi:10.11606/t.9.2013.tde-26082013-232313
Metadata
- Authors
- Lee, Y. S., Li, P., Huh, J. Y., Hwang, I. J., Lu, M., Kim, J. I., Ham, M., Talukdar, S., Chen, A., Lu, W. J., Bandyopadhyay, G. K., Schwendener, R., Olefsky, J., & Kim, J. B.
- Affiliations
- Seoul National University (KR)
- University of California San Diego (US)
- Institute of Molecular Biology and Genetics, Seoul National University, Seoul, Korea
- University of Zurich (CH)
- Corresponding author
- Kim, Jae Bum
- ORCID
- Venue
- Diabetes
- Publisher
- American Diabetes Association
- Published
- 2011-09-16
- Volume
- 60
- Issue
- 10
- Pages
- 2474-2483
- ISSN
- 0012-1797 (ISSN-L)
- 1939-327X
- PMC
- PMC3178297
- OpenAlex
- W2095717717
- Cited by
- 566
- References
- 28
- Citations by year
- 2026: 24 · 2025: 23 · 2024: 26 · 2023: 33 · 2022: 40 · 2021: 41 · 2020: 44 · 2019: 47 · 2018: 53 · 2017: 50 · 2016: 37 · 2015: 46 · 2014: 24 · 2013: 49 · 2012: 23
- FWCI
- 24.10
- Type
- journal article
- Language
- en
- Open access
- hybrid
- doi.org
- Licence
- Locations
- Diabetes (publishedVersion, cc-by-nc-nd)
- PubMed Central (publishedVersion, cc-by-nc-nd)
- PubMed (publishedVersion)
- Zurich Open Repository and Archive (University of Zurich) (acceptedVersion, cc-by)
- Zurich Open Repository and Archive (University of Zurich) (submittedVersion, cc-by)
- Zurich Open Repository and Archive (University of Zurich)
- Funders
- National Institute of Diabetes and Digestive and Kidney Diseases (DK063491, DK 074868, DK 033651, T32DK007494, R37DK033651, P01DK074868, R01DK033651, P30DK063491)
- Eunice Kennedy Shriver National Institute of Child Health and Human Development (P50HD012303, U54HD012303)
- Topics
- Health Sciences › Medicine › Endocrinology, Diabetes and Metabolism › Adipokines, Inflammation, and Metabolic Diseases
- Health Sciences › Medicine › Physiology (medical) › Adipose Tissue and Metabolism
- Health Sciences › Medicine › Endocrinology, Diabetes and Metabolism › Diet, Metabolism, and Disease
- Keywords
- insulin resistance, high-fat diet, inflammation, obesity, macrophages, adipose tissue, Rag1 knockout mice, macrophage depletion, lipid accumulation, hepatic lipid accumulation, skeletal muscle lipid accumulation
- MeSH terms
- Adipose Tissue, Animals, Blood Glucose, Ceramides, Dietary Fats, Drug Administration Schedule, Epididymis, Glucose, Glucose Tolerance Test, Inflammation, Insulin Resistance, Liver, Male, Mice, Inbred C57BL, Muscle, Skeletal, Mice
About these checks
Registry, retraction, Cites and statistics results are computed, not judged, with one exception: a printed reference that no index lists is read once by a model before it counts as a citation error. Claims are extracted by a model and kept only when their quote appears verbatim in the text; each cited source is then checked, with a model’s help, for whether it says what the claim relies on. Those verdicts can be wrong — read the claim’s quote and the cited source before relying on one.
Statistics and arithmetic are recomputed, not judged.
Confidence bands are shown only for fields calibrated on our annotated test set. None is calibrated yet, so no band is shown.
What counts as a claim ›How we measure confidence ›How we check this ›
Are you an author, or do you see a problem with this page? Request a review
