

The DOI matches its Crossref record; 102 of the 104 references it cites were found in a registry or an index.
Type 2 Diabetes
Open accessAbstract
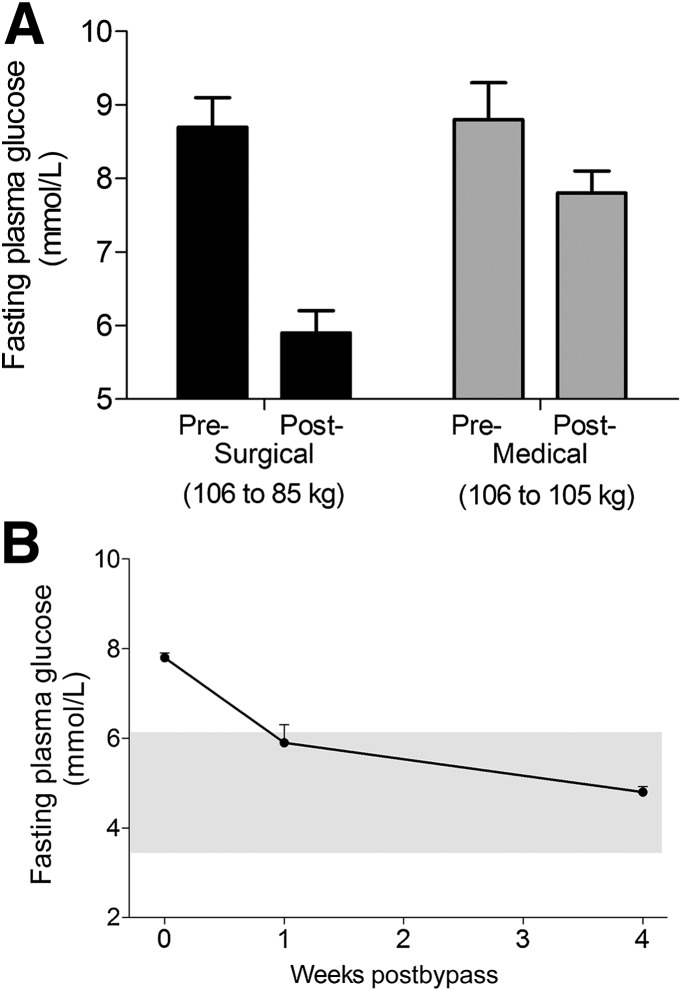
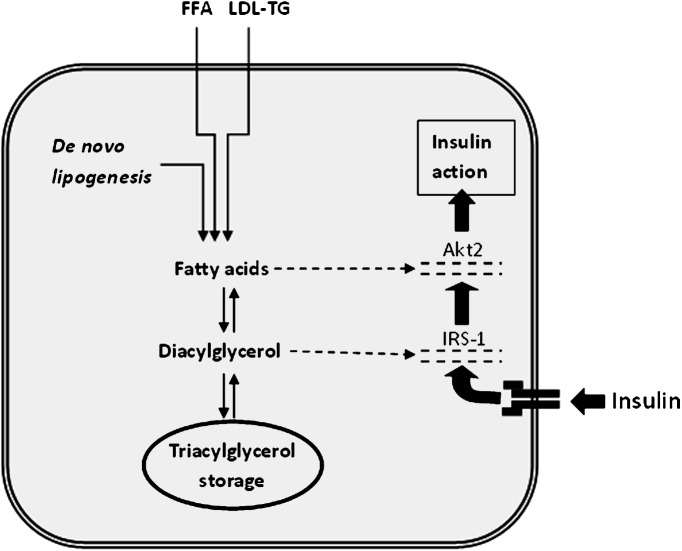
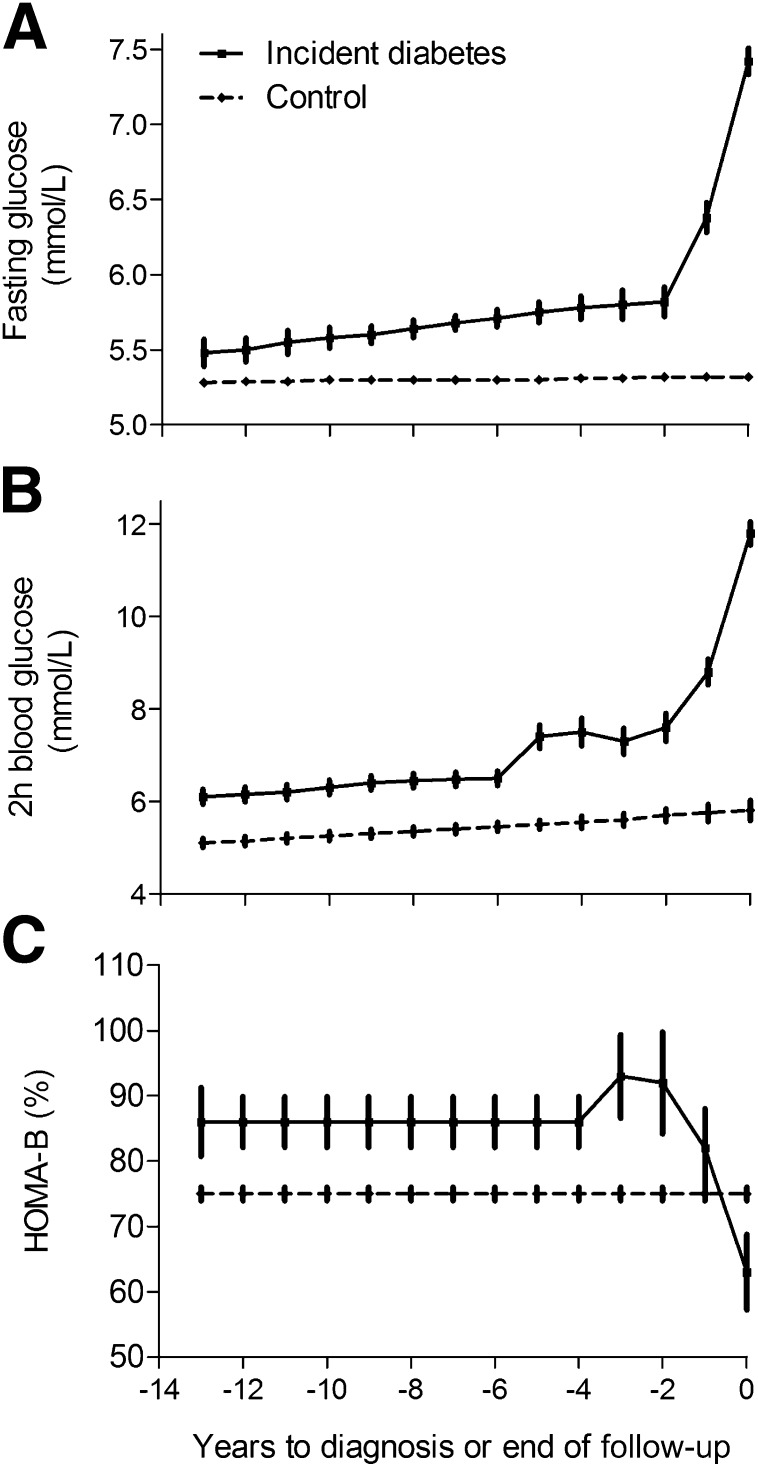
Reversal of type 2 diabetes to normal metabolic control by either bariatric surgery or hypocaloric diet allows for the time sequence of underlying pathophysiologic mechanisms to be observed. In reverse order, the same mechanisms are likely to determine the events leading to the onset of hyperglycemia and permit insight into the etiology of type 2 diabetes. Within 7 days of instituting a substantial negative calorie balance by either dietary intervention or bariatric surgery, fasting plasma glucose levels can normalize. This rapid change relates to a substantial fall in liver fat content and return of normal hepatic insulin sensitivity. Over 8 weeks, first phase and maximal rates of insulin secretion steadily return to normal, and this change is in step with steadily decreasing pancreatic fat content. The difference in time course of these two processes is striking. Recent information on the intracellular effects of excess lipid intermediaries explains the likely biochemical basis, which simplifies both the basic understanding of the condition and the concepts used to determine appropriate management. Recent large, long-duration population studies on time course of plasma glucose and insulin secretion before the diagnosis of diabetes are consistent with this new understanding. Type 2 diabetes has long been regarded as inevitably progressive, requiring increasing numbers of oral hypoglycemic agents and eventually insulin, but it is now certain that the disease process can be halted with restoration of normal carbohydrate and fat metabolism. Type 2 diabetes can be understood as a potentially reversible metabolic state precipitated by the single cause of chronic excess intraorgan fat. Type 2 diabetes has long been known to progress despite glucose-lowering treatment, with 50% of individuals requiring insulin therapy within 10 years (1). This seemingly inexorable deterioration in control has been interpreted to mean that the condition is treatable but not curable. Clinical guidelines recognize …
Overview
The claims and statistics of this paper haven’t been checked yet.
Free: it reads the open-access text and checks the first 5 claims that cite a source we can check. Create a free account to check every claim.
Integrity signals
Registry
Cites
Statistics
Figures



Verification
Claims the paper makes
The claims and statistics of this paper haven’t been checked yet.
Free: it reads the open-access text and checks the first 5 claims that cite a source we can check. Create a free account to check every claim.
Claims other papers make about this one
Each is checked against this paper’s own text: does it say what the citing paper says it does?
The source backs part of the claim, not all of it — or backs it for a different population, condition or comparison.
In the citing paper
“The three approaches show a similar time-course with glycemic control preceding weight loss by weeks or months, suggesting potential overlap of mechanisms (11, 12).”
From Long-Term Effects of a Novel Continuous Remote Care Intervention Including Nutritional Ketosis for the Management of Type 2 Diabetes: A 2-Year Non-randomized Clinical Trial (2019) · cites this paper as [12]
Experimental — accuracy not yet measuredThe source backs part of the claim, not all of it — or backs it for a different population, condition or comparison.
In the citing paper
“In controlled clinical trials, each approach has demonstrated improved glycemic control and CVD risk factors, reduced pharmaceutical dependence, and weight loss.”
From Long-Term Effects of a Novel Continuous Remote Care Intervention Including Nutritional Ketosis for the Management of Type 2 Diabetes: A 2-Year Non-randomized Clinical Trial (2019) · cites this paper as [12]
Experimental — accuracy not yet measuredIn the citing paper
“It has been estimated that 50% of patients require insulin therapy within 10 years of T2D diagnosis.245”
From A review of current trends with type 2 diabetes epidemiology, aetiology, pathogenesis, treatments and future perspectives (2021) · cites this paper as [245]
Self-check
Percentages, sums and reported differences re-computed from the paper’s own numbers.
The self-check needs the paper’s full text.
Citations
Cites
Lifestyle, diabetes, and cardiovascular risk factors 10 years after bariatric surgery
Sjöström, L., Lindroos, A.-K., Peltonen, M., Torgerson, J., Bouchard, C., Carlsson, B., Dahlgren, S., Larsson, B., Narbro, K., Sjöström, C. D., et al. (2004) · New England Journal of Medicine · doi:10.1056/nejmoa035622 · Cited by 4,457
Economic Costs of Diabetes in the U.S. in 2002
American Diabetes Association (2003) · Diabetes Care · doi:10.2337/diacare.26.3.917 · Cited by 4,147
β-Cell Deficit and Increased β-Cell Apoptosis in Humans With Type 2 Diabetes
Butler, A. E., Janson, J., Bonner-Weir, S., Ritzel, R., Rizza, R. A., & Butler, P. C. (2003) · Diabetes · doi:10.2337/diabetes.52.1.102 · Cited by 4,011
Genetic variation in PNPLA3 confers susceptibility to nonalcoholic fatty liver disease
Romeo, S., Kozlitina, J., Xing, C., Pertsemlidis, A., Cox, D., Pennacchio, L. A., Boerwinkle, E., Cohen, J. C., & Hobbs, H. H. (2008) · Nature Genetics · doi:10.1038/ng.257 · Cited by 3,416 · cited 1×
“When a variant of PNPLA3was described as determining increased hepatic fat levels, it appeared that a major factor underlying nonalcoholic fatty liver disease and insulin resistance was identified (55).”
Mechanisms for Insulin Resistance: Common Threads and Missing Links
Samuel, V. T., & Shulman, G. I. (2012) · Cell · doi:10.1016/j.cell.2012.02.017 · Cited by 2,294
Impaired Mitochondrial Activity in the Insulin-Resistant Offspring of Patients with Type 2 Diabetes
Petersen, K. F., Dufour, S., Befroy, D., Garcia, R., & Shulman, G. I. (2004) · New England Journal of Medicine · doi:10.1056/nejmoa031314 · Cited by 2,193 · cited 1×
“Although a defect in mitochondrial function is associated with extremes of insulin resistance in skeletal muscle (30), this does not appear to be relevant to the etiology of type 2 diabetes.”
Colberg, S. R., Sigal, R. J., Fernhall, B., Regensteiner, J. G., Blissmer, B. J., Rubin, R. R., Chasan-Taber, L., Albright, A. L., & Braun, B. (2010) · Diabetes Care · doi:10.2337/dc10-9990 · Cited by 1,955
Long-term weight loss maintenance
Wing, R. R., & Phelan, S. (2005) · The American Journal of Clinical Nutrition · doi:10.1093/ajcn/82.1.222s · Cited by 1,941
A placebo-controlled trial of pioglitazone in subjects with nonalcoholic steatohepatitis
Belfort, R., Harrison, S. A., Brown, K., Darland, C., Finch, J., Hardies, J., Balas, B., Gastaldelli, A., Tio, F., Pulcini, J., et al. (2006) · New England Journal of Medicine · doi:10.1056/nejmoa060326 · Cited by 1,827 · cited 1×
“Hypocaloric diet (42), physical activity (43), or thiazolidinedione use (23,44) each reduces insulin secretion and decreases liver fat content.”
Cited by
Xue, A., Wu, Y., Zhu, Z., Zhang, F., Kemper, K. E., Zheng, Z., Yengo, L., Lloyd-Jones, L. R., Sidorenko, J., Wu, Y., et al. (2018) · Nature Communications · doi:10.1038/s41467-018-04951-w · Cited by 901
Type 2 diabetes mellitus in adults: pathogenesis, prevention and therapy
Lu, X., Xie, Q., Pan, X., Zhang, R., Zhang, X., Peng, G., Zhang, Y., Shen, S., & Tong, N. (2024) · Signal Transduction and Targeted Therapy · doi:10.1038/s41392-024-01951-9 · Cited by 665
Taylor, R., Al-Mrabeh, A., Zhyzhneuskaya, S., Peters, C., Barnes, A. C., Aribisala, B. S., Hollingsworth, K. G., Mathers, J. C., Sattar, N., & Lean, M. E. J. (2018) · Cell Metabolism · doi:10.1016/j.cmet.2018.07.003 · Cited by 450
Self-citationReed, J., Bain, S., & Kanamarlapudi, V. (2021) · Diabetes, Metabolic Syndrome and Obesity: Targets and Therapy · doi:10.2147/dmso.s319895 · Cited by 441
Liu, X., Tan, Z., Huang, Y., Zhao, H., Liu, M., Yu, P., Ma, J., Zhao, Y., Zhu, W., & Wang, J. (2022) · Cardiovascular Diabetology · doi:10.1186/s12933-022-01546-0 · Cited by 409
Metadata
- Authors
- Taylor, R.
- Affiliations
- Newcastle University (GB)
- Corresponding author
- Taylor, Roy
- ORCID
- Taylor, Roy
- Venue
- Diabetes Care
- Publisher
- American Diabetes Association
- Published
- 2013-03-14
- Volume
- 36
- Issue
- 4
- Pages
- 1047-1055
- ISSN
- 0149-5992 (ISSN-L)
- 1935-5548
- PMC
- PMC3609491
- OpenAlex
- W2051587831
- Cited by
- 485
- References
- 104
- Citations by year
- 2026: 39 · 2025: 63 · 2024: 67 · 2023: 35 · 2022: 35 · 2021: 65 · 2020: 33 · 2019: 28 · 2018: 25 · 2017: 24 · 2016: 26 · 2015: 16 · 2014: 22 · 2013: 4
- FWCI
- 4.01
- Type
- journal article
- Language
- en
- Open access
- hybrid
- doi.org
- Licence
- Locations
- Diabetes Care (publishedVersion, cc-by-nc-nd)
- Europe PMC (PubMed Central) (publishedVersion, cc-by-nc-nd)
- PubMed Central (publishedVersion, cc-by-nc-nd)
- PubMed (publishedVersion)
- Newcastle University ePrints (Newcastle Univesity)
- Topics
- Health Sciences › Medicine › Endocrinology, Diabetes and Metabolism › Pancreatic function and diabetes
- Health Sciences › Medicine › Endocrinology, Diabetes and Metabolism › Diabetes Treatment and Management
- Health Sciences › Medicine › Endocrinology, Diabetes and Metabolism › Diabetes, Cardiovascular Risks, and Lipoproteins
- Keywords
- type 2 diabetes, diabetes remission, bariatric surgery, hypocaloric diet, hepatic insulin sensitivity, liver fat, pancreatic fat content, insulin secretion, disease progression, insulin resistance
- MeSH terms
- Diabetes Mellitus, Type 2, Humans, Insulin Resistance, Bariatric Surgery
About these checks
Registry, retraction, Cites and statistics results are computed, not judged, with one exception: a printed reference that no index lists is read once by a model before it counts as a citation error. Claims are extracted by a model and kept only when their quote appears verbatim in the text; each cited source is then checked, with a model’s help, for whether it says what the claim relies on. Those verdicts can be wrong — read the claim’s quote and the cited source before relying on one.
Statistics and arithmetic are recomputed, not judged.
Confidence bands are shown only for fields calibrated on our annotated test set. None is calibrated yet, so no band is shown.
What counts as a claim ›How we measure confidence ›How we check this ›
Are you an author, or do you see a problem with this page? Request a review
How to cite
Cite CoChat for the checks on this page, and the paper for its own findings.
- This page
- CoChat. (2026). Citation check: Type 2 Diabetes. https://app.cochat.ai/papers/10.2337/dc12-1805
- The paper
- Taylor, R. (2013). Type 2 Diabetes. Diabetes Care. https://doi.org/10.2337/dc12-1805
Data sources
Bibliographic data: Semantic Scholar, OpenAlex, Crossref.
Contains information from the Semantic Scholar Academic Graph Datasets, made available under the ODC Attribution License (ODC-BY 1.0).
Semantic Scholar’s data is described in: Kinney, R., et al. (2023). The Semantic Scholar Open Data Platform. arXiv:2301.10140.
