

The DOI matches its Crossref record; 12 of the 16 references it cites were found in a registry or an index, and 2 are not checked yet; none of the 26 sources its claims cite is checked for support yet.
Real-time bus arrival prediction and bus bunching prevention using a multi-agent LSTM approach
Open accessAbstract
Introduction: Bus bunching is a major challenge in urban public transportation because it reduces operational efficiency and increases passenger waiting times. Although transit agencies increasingly use real-time passenger information (RTPI) systems, existing predictive approaches often face limitations caused by sparse historical GPS data, particularly when data are collected at long polling intervals such as 10 minutes. In addition, conventional reactive control strategies frequently depend on a central dispatcher. This study addresses these limitations by proposing a scalable, proactive transit-control framework that integrates deep learning with cooperative multi-agent systems (MASs). Methods: The proposed framework uses Metropolitan Transportation Authority (MTA) Service Interface for Real-time Information (SIRI) data and introduces a forward-looking target-imputation mechanism to address data sparsity while retaining more than 90% of the original telemetry. A long short-term memory (LSTM) neural network with categorical route embeddings was developed to simultaneously predict estimated times of arrival (ETAs) at stops across New York City’s 20 highest-frequency bus routes. The predictive model was then embedded directly into autonomous bus agents within an MAS simulation. Through localized communication, the agents could cooperatively implement decentralized stop-skipping, referred to as “EXPRESS” mode, without relying on a central dispatcher. The operational effectiveness of the framework was evaluated through 120-step simulations on routes B82 and Bx9. Results: The LSTM model achieved an overall mean absolute error (MAE) of 2.02 minutes, representing a 28.5% improvement over historical baseline models. The forward-looking imputation mechanism preserved more than 90% of the raw telemetry, demonstrating its effectiveness in mitigating data sparsity. In the MAS simulations, complete bus-bunching collapse, defined as a headway gap approaching zero, did not occur. EXPRESS mode was activated during 19.2% of simulation steps on route B82 and 25.8% on route Bx9. Following every intervention, bus headways recovered above the predefined safe threshold. Discussion: The findings demonstrate that combining local deep-learning-based ETA prediction with cooperative multi-agent control can provide an effective decentralized solution to bus bunching. The proposed approach enables autonomous buses to anticipate operational disruptions and coordinate corrective actions without human intervention or centralized dispatching. Its low ETA prediction error and consistent recovery of safe headways indicate that the framework can improve both predictive accuracy and operational stability. More broadly, the study provides a scalable example of how decentralized artificial intelligence and multi-agent coordination could support proactive transit management and contribute to the development of smart-city transportation systems.
Checked 2026-11-11 · 2 references not checked yet
Overview
CoChat Summary
TL;DR
This paper combines a multi-route LSTM ETA predictor with a decentralized multi-agent stop-skipping protocol to prevent bus bunching using sparse MTA SIRI data. It reports a 2.02-minute MAE, 28.5% improvement over a route-aware baseline, and no full bunching collapse in 120-step simulations on routes B82 and Bx9.
Key findings
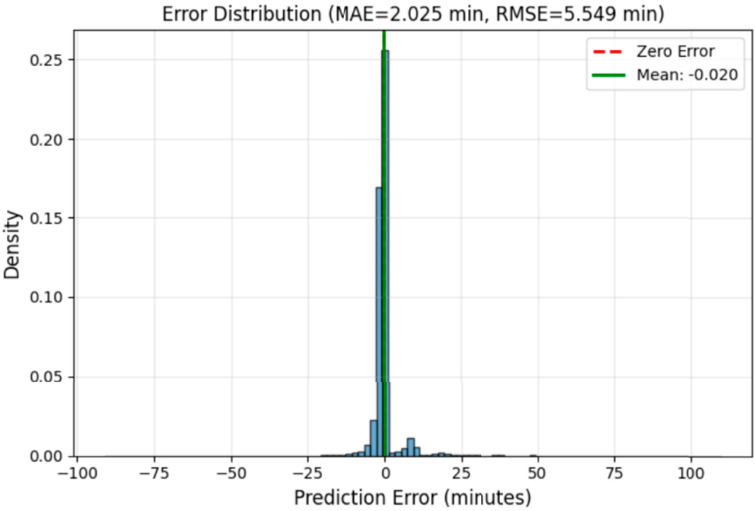
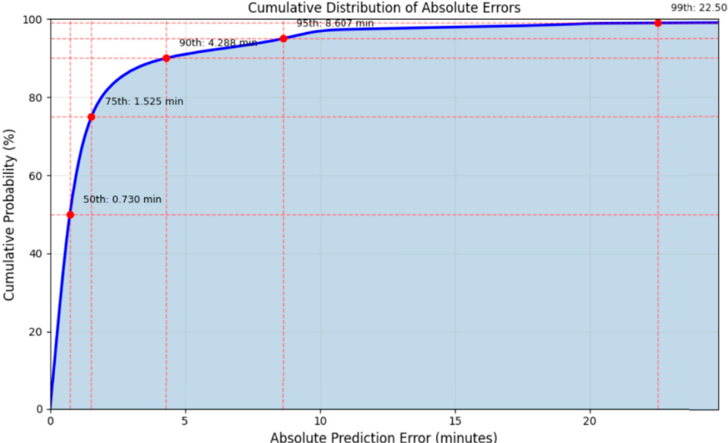
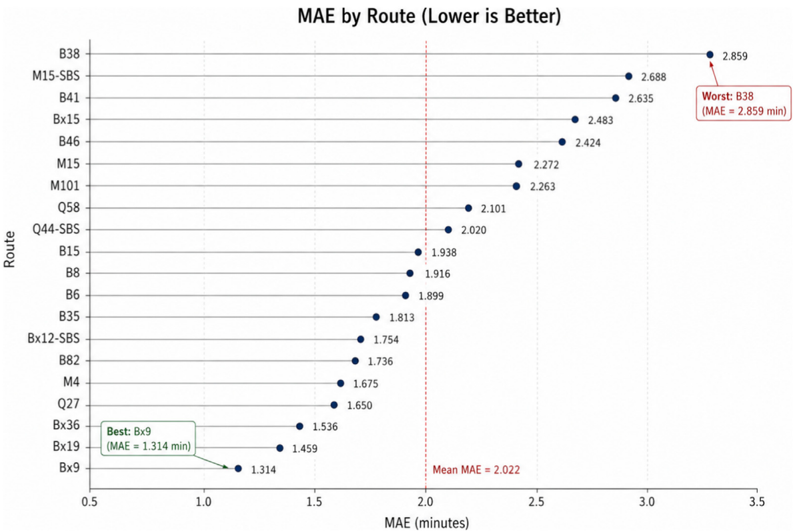
- The LSTM achieved test MAE 2.0247 min (95% CI [2.017, 2.033]), RMSE 5.5486 min, median absolute error 0.73 min, and a 28.5% MAE improvement over the route-aware historical baseline (2.8331 min; Wilcoxon p < 0.001, n = 802,085 test sequences).
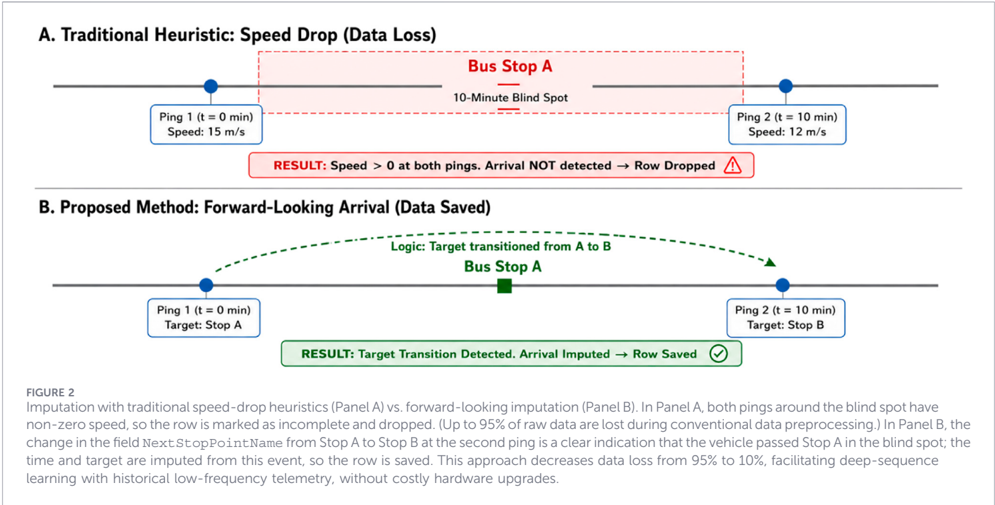
- Forward-looking imputation preserved >90% of raw telemetry versus about 5% under conventional speed-drop preprocessing, yielding 3,743,062 training sequences.
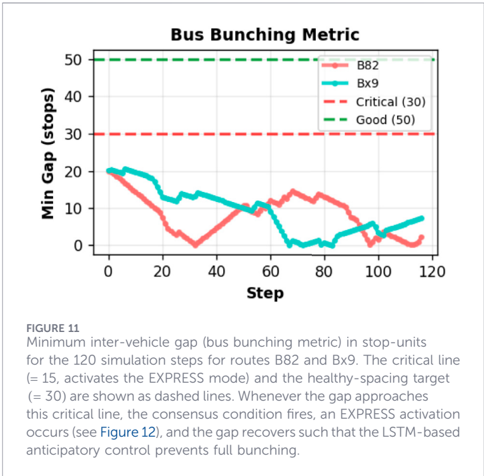
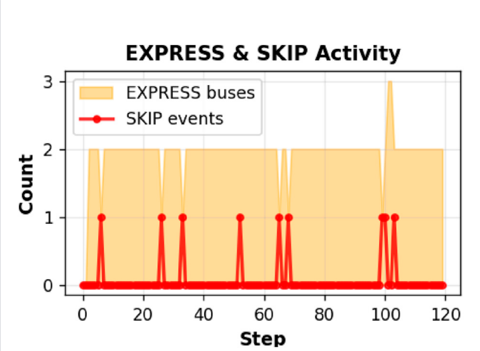
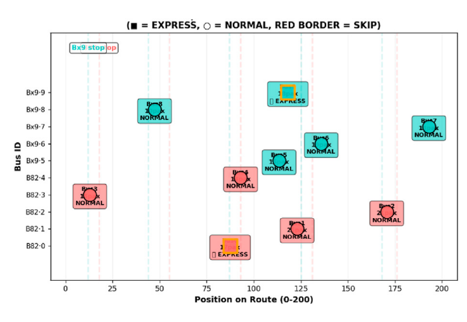
- In 120-step MAS simulations, the minimum inter-vehicle gap was 3 stop-units on B82 and 4 on Bx9, with zero full-collapse events (gap = 0); EXPRESS mode activated in 23/120 steps (19.2%) on B82 and 31/120 steps (25.8%) on Bx9, with 100% gap recovery above the 30 stop-unit safe threshold after EXPRESS episodes.
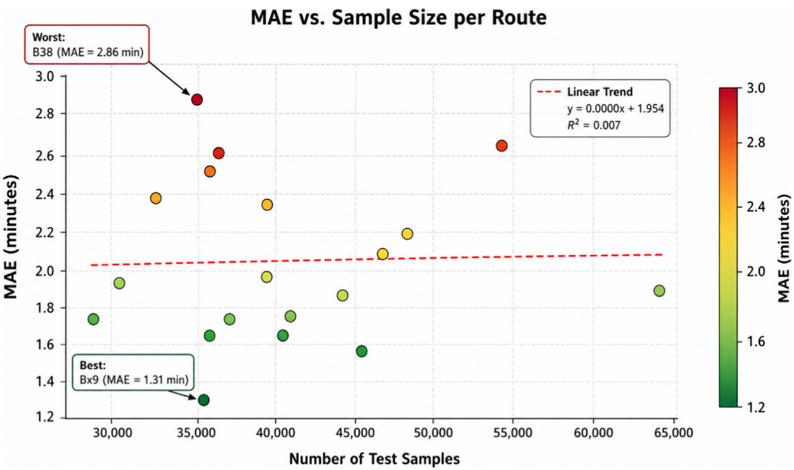
- All 20 routes improved over their individual baselines by 16.6%–39.7%, and per-route accuracy was essentially independent of route data volume (R² = 0.007).
Methods
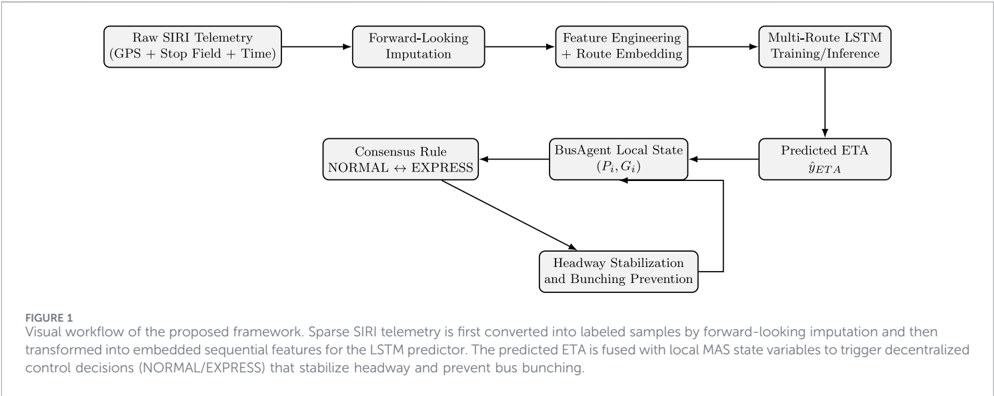
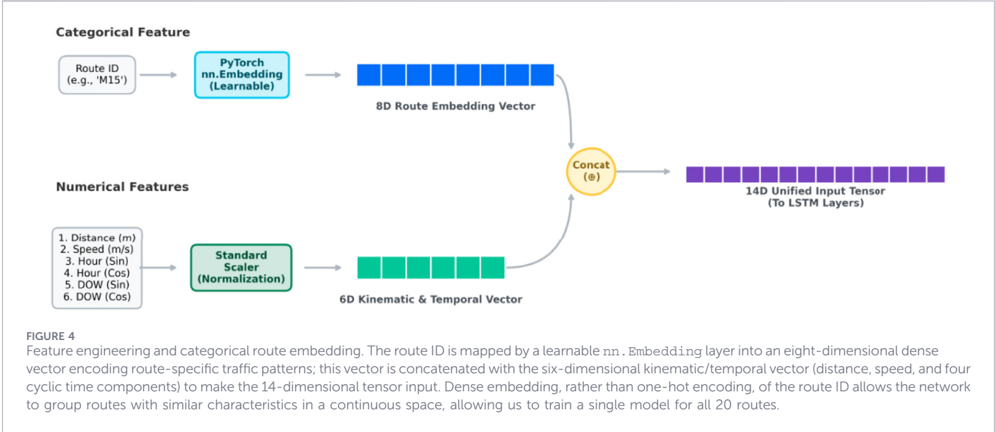
- Used >5.5 GB of NYC MTA SIRI GPS telemetry, subset to the 20 busiest routes with roughly 227,000–483,000 observations per route; applied forward-looking target imputation based on changes in `NextStopPointName`, plus Haversine distance, speed, cyclic hour/day features, and learnable 8-dimensional route embeddings.
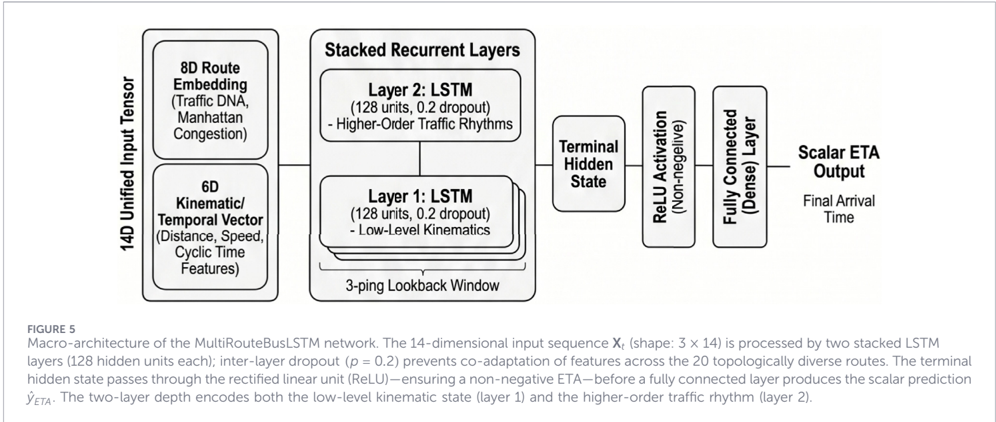
- Trained a two-layer LSTM (hidden size 128, dropout 0.2, sequence length 3, 14-dimensional input, 206,113 parameters) in PyTorch with Adam, learning rate 10⁻³, batch size 512, MSE loss, and early stopping; evaluated with route-stratified 70/15/15 splits, MAE/RMSE, bootstrap CI, and Wilcoxon signed-rank tests.
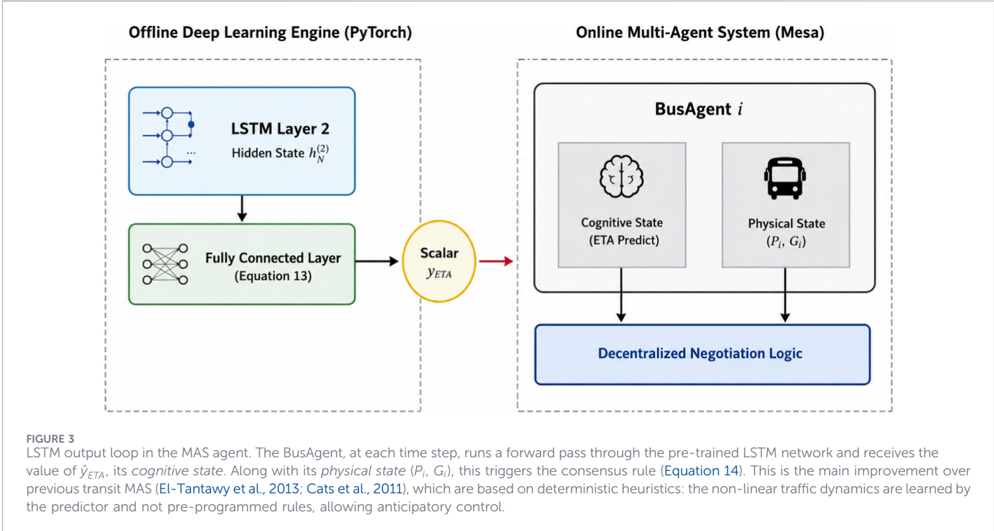
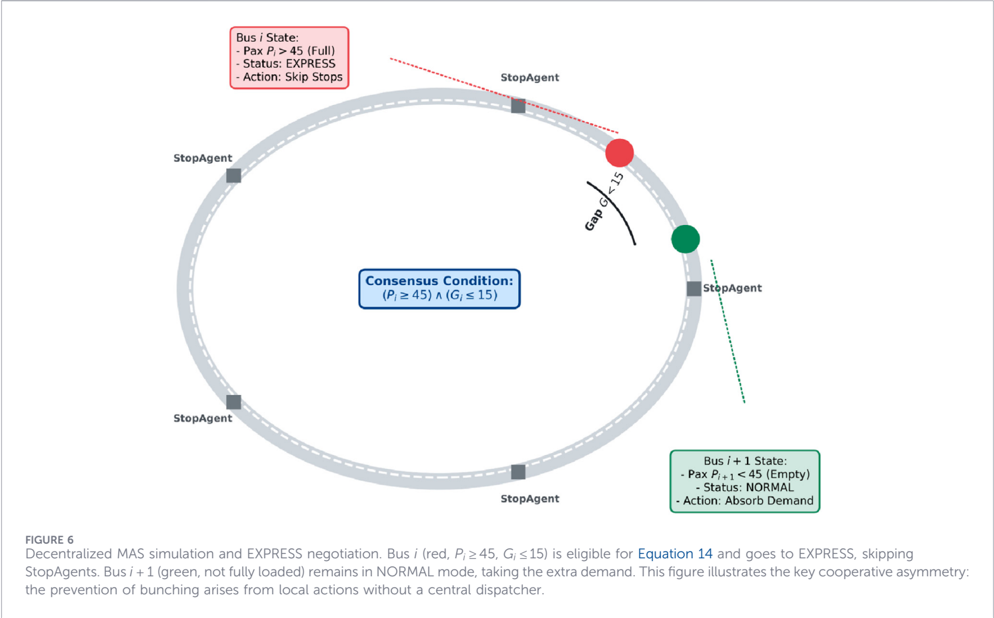
- Embedded the frozen LSTM into a Python Mesa cooperative MAS with a 1D circular route, static StopAgents, dynamic BusAgents, and a local consensus rule: EXPRESS when passengers ≥ 45 and headway gap ≤ 15 stop-units, returning to NORMAL when gap > 30; ran 120-step simulations on B82 and Bx9 with five BusAgents per route.
Limitations
- Stated: simulation time features are partly hardcoded; ETA estimates may be less accurate during initial sequence warm-up; route generalization is limited to trained routes unless retraining occurs; stop-skipping may increase waiting for passengers at skipped stops under extreme demand.
- Stated as future work: fairness constraints, transfer penalties, weather/incident feeds, and online learning across seasons.
- Evident from the text: validation is simulation-only on two routes over 120 steps, with fixed thresholds and no real-world deployment or quantified passenger wait-time outcomes; cross-study MAE comparisons are also limited by different cities, datasets, and route selections.
Model-written summary. Check it against the paper before relying on it.
Integrity signals
Registry
Cites
Statistics
Figures
Verification
Claims the paper makes
0 Valid · 3 Not valid · 19 Not checked · 104 Own results and interpretations
A result the paper states — it cites no source for it, so there is none to check. The quote shows it is in the paper.
In the paper
“The forward-looking imputation mechanism preserved more than 90% of the raw telemetry”
- Also stated in: § 1.2 Contributions and novelty · plain
“preserves >90% of the raw telemetry”
- Also stated in: § 3.4 Preprocessing steps · plain
“This approach keeps >90% of the original telemetry by using the change in the target stop as a clear indicator of physical movement.”
§ Real-time bus arrival prediction and bus bunching prevention using a multi-agent LSTM approach > Abstract
plainstates a cause- Asserted: passes — The authors put it forward as true.
- Checkable: passes — It can be checked against evidence.
- Load-bearing: passes — The paper’s conclusions depend on it.
- Based: passes — The paper gives a reason why it holds.
- Also stated in: § 1.2 Contributions and novelty · plain
A result the paper states — it cites no source for it, so there is none to check. The quote shows it is in the paper.
In the paper
“speed-drop heuristics discard up to 95% of the observations”
- Also stated in: § 3.4 Preprocessing steps · plain
“Old-fashioned techniques discard 95% of the data”
§ Real-time bus arrival prediction and bus bunching prevention using a multi-agent LSTM approach > 1.2 Contributions and novelty
plainstates a cause- Asserted: passes — The authors put it forward as true.
- Checkable: passes — It can be checked against evidence.
- Load-bearing: passes — The paper’s conclusions depend on it.
- Based: passes — The paper gives a reason why it holds.
- Also stated in: § 3.4 Preprocessing steps · plain
A result the paper reports from its own data — it cites no other source for it, so there is none to check. The quote shows it is in the paper.
In the paper
“Following every intervention, bus headways recovered above the predefined safe threshold.”
- Also stated in: § 1.2 Contributions and novelty · plain
“the headway consistently recovers above the safe-spacing target of 30 stop-units after each intervention”
§ Real-time bus arrival prediction and bus bunching prevention using a multi-agent LSTM approach > Abstract
plainstates a cause- Asserted: passes — The authors put it forward as true.
- Checkable: passes — It can be checked against evidence.
- Load-bearing: passes — The paper’s conclusions depend on it.
- Based: passes — The paper gives a reason why it holds.
- Also stated in: § 1.2 Contributions and novelty · plain
A result the paper reports from its own data — it cites no other source for it, so there is none to check. The quote shows it is in the paper.
In the paper
“recovering an order-of-magnitude more training sequences (n � 3, 743, 062 vs. fewer than 200,000 under conventional heuristics)”
§ Real-time bus arrival prediction and bus bunching prevention using a multi-agent LSTM approach > 1.2 Contributions and novelty
plainstates a cause- Asserted: passes — The authors put it forward as true.
- Checkable: passes — It can be checked against evidence.
- Load-bearing: passes — The paper’s conclusions depend on it.
- Based: passes — The paper gives a reason why it holds.
A result the paper reports from its own data — it cites no other source for it, so there is none to check. The quote shows it is in the paper.
In the paper
“The LSTM model achieved an overall mean absolute error (MAE) of 2.02 minutes”
§ Real-time bus arrival prediction and bus bunching prevention using a multi-agent LSTM approach > Abstract
plain- Asserted: passes — The authors put it forward as true.
- Checkable: passes — It can be checked against evidence.
- Load-bearing: passes — The paper’s conclusions depend on it.
- Based: passes — The paper gives a reason why it holds.
49 more claims
Create a free account to see all 126 claims and to verify the 1 reference still open.
- It may state two separate claims as one. 51
- The quote only partly states this claim. 4
- Probably not a substantial claim. 31
Self-check
Percentages, sums and reported differences re-computed from the paper’s own numbers.
Each contradiction between two passages listed here was confirmed by an independent check.
Rated major: it would touch a result — a value a result rests on, reported and recomputed p-values on opposite sides of the significance level, two passages that conflict with no sign which is right, or a cited work retracted before this paper was published.
In the paper
§ Real-time bus arrival prediction and bus bunching prevention using a multi-agent LSTM approach > 4.3.1 Coordination via simultaneous arrival prediction
“The LSTM's forecast of two buses converging at a downstream stop within a short window of time allows the lead bus to enter EXPRESS status and skip stops, breaking temporal symmetry.”
§ Real-time bus arrival prediction and bus bunching prevention using a multi-agent LSTM approach > 3.9 Bunching prevention scenario
“if P i (t) ≥ C thr and G i (t) ≤ G thr then ⊳ Consensus condition, Equation 14”
Rated major: it would touch a result — a value a result rests on, reported and recomputed p-values on opposite sides of the significance level, two passages that conflict with no sign which is right, or a cited work retracted before this paper was published.
In the paper
§ Real-time bus arrival prediction and bus bunching prevention using a multi-agent LSTM approach > 3.4 Preprocessing steps
“the actual arrival time (t arr ) and target coordinates (lat end , lon end ) are extracted from the time and location of the first next observation j where the NextStopPointName becomes Stop B.”
§ Real-time bus arrival prediction and bus bunching prevention using a multi-agent LSTM approach > 3.4 Preprocessing steps
“3: j ← i + 1 4: if p j .NextStopPointName ≠ p i .NextStopPointName then ⊳ Stop transition: vehicle crossed a stop inside the blind-spot interval”
Rated minor: it would not touch a result — a value no result rests on, a p-value that stays on the same side of the significance level, or a conflict that is clerical, resolved elsewhere in the paper, or outside its own findings.
In the paper
§ Real-time bus arrival prediction and bus bunching prevention using a multi-agent LSTM approach > 4.3 Simulation outcomes in the cooperative MAS
“The graph compares the B82 and Bx9 bus routes, with reference thresholds of 30 stops and 50 stops indicating critical and good operating conditions, respectively.”
§ Real-time bus arrival prediction and bus bunching prevention using a multi-agent LSTM approach > FIGURE 11
“The critical line (� 15, activates the EXPRESS mode) and the healthy-spacing target (� 30) are shown as dashed lines.”
Rated minor: it would not touch a result — a value no result rests on, a p-value that stays on the same side of the significance level, or a conflict that is clerical, resolved elsewhere in the paper, or outside its own findings.
In the paper
§ Real-time bus arrival prediction and bus bunching prevention using a multi-agent LSTM approach > 5.4 Training and convergence
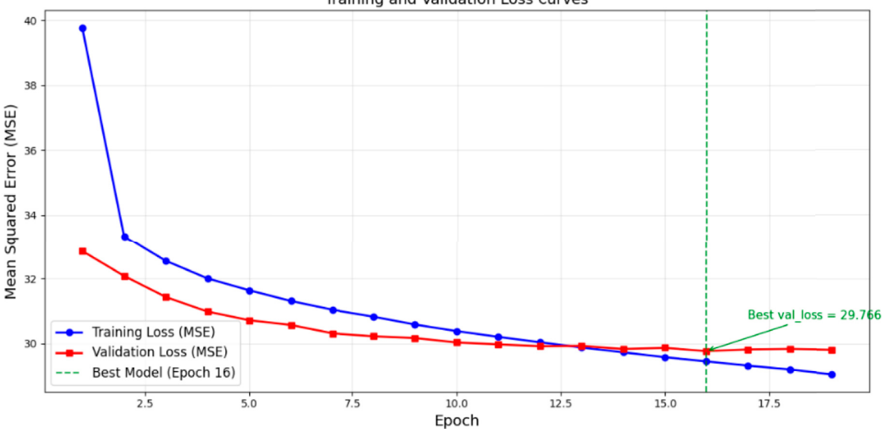
“The model trained for 18 epochs, and the best validation loss (MSE � 29.834) checkpoint was reached at epoch 16.”
§ Real-time bus arrival prediction and bus bunching prevention using a multi-agent LSTM approach > 5.4 Training and convergence
“A green dashed line indicates the lowest validation loss of 29.766, attained at epoch 16.”
Rated minor: it would not touch a result — a value no result rests on, a p-value that stays on the same side of the significance level, or a conflict that is clerical, resolved elsewhere in the paper, or outside its own findings.
In the paper
§ Real-time bus arrival prediction and bus bunching prevention using a multi-agent LSTM approach > 5.4 Training and convergence
“Figure 14 illustrates the progression of training (blue) and validation (red) MSE loss over 19 epochs.”
§ Real-time bus arrival prediction and bus bunching prevention using a multi-agent LSTM approach > 6 Conclusion
“Figure: 14 FIGURE 14 MSE FIGURE 14 MSE loss curves for training and validation over 18 epochs.”
1 more finding
Create a free account to see every finding of this check.
Citations
Cites
Vaswani, A., Shazeer, N., Parmar, N., Uszkoreit, J., Jones, L., Gomez, A. N., Kaiser, L., & Polosukhin, I. (2017) · arXiv · doi:10.48550/arxiv.1706.03762 · Cited by 120,404
Hochreiter, S., & Schmidhuber, J. (1997) · Neural Computation · doi:10.1162/neco.1997.9.8.1735 · Cited by 102,318
Individual Comparisons by Ranking Methods
Wilcoxon, F. (1945) · Biometrics Bulletin · doi:10.2307/3001968 · Cited by 15,354
Short-term traffic forecasting: where we are and where we’re going
Vlahogianni, E. I., Karlaftis, M. G., & Golias, J. C. (2014) · Transportation Research Part C: Emerging Technologies · doi:10.1016/j.trc.2014.01.005 · Cited by 1,132
A hybrid deep learning based traffic flow prediction method and its understanding
Wu, Y., Tan, H., Qin, L., Ran, B., & Jiang, Z. (2018) · Transportation Research Part C Emerging Technologies · doi:10.1016/j.trc.2018.03.001 · Cited by 809
Predicting Taxi–Passenger Demand Using Streaming Data
Moreira-Matias, L., da Gama, J. M. P., Ferreira, M., Mendes‐Moreira, J., & Damas, L. (2013) · IEEE Transactions on Intelligent Transportation Systems · doi:10.1109/tits.2013.2262376 · Cited by 723
El-Tantawy, S., Abdulhai, B., & Abdelgawad, H. (2013) · IEEE Transactions on Intelligent Transportation Systems · doi:10.1109/tits.2013.2255286 · Cited by 458
A headway-based approach to eliminate bus bunching: Systematic analysis and comparisons
Daganzo, C. F. (2009) · Transportation Research Part B: Methodological · doi:10.1016/j.trb.2009.04.002 · Cited by 406
Daganzo (2009) · doi:10.1016/j.trb.2009.03.001 · Cited by 205
The Real–Time Stop–Skipping Problem
Sun, A., & Hickman, M. D. (2005) · Journal of Intelligent Transportation Systems · doi:10.1080/15472450590934642 · Cited by 204
Impacts of Holding Control Strategies on Transit Performance: Bus Simulation Model Analysis
Cats, O., Larijani, A. N., Koutsopoulos, H. N., & Burghout, W. (2011) · Transportation Research Record: Journal of the Transportation Research Board · doi:10.3141/2216-06 · Cited by 122
Design and implementation of bus-holding control strategies with real-time information
Fu, L., & Yang, X. (2002) · Transportation Research Record: Journal of the Transportation Research Board · doi:10.3141/1791-02 · Cited by 116
Gal (2019) · doi:10.1016/j.is.2017.07.004 · Cited by 6
Chien (2002) · doi:10.1061/(asce)0733-947x(2002)128:5(429
Liu (2019) · doi:10.1109/mits.2019.2926540
Srivastava (2014) · doi:10.5555/2627435.2670313
Research works printed but not linked: 7
- Abkowitz, 1984, Methods for maintaining transit service regularity, Transp. Res. Rec., 1
- Alesiani, 2018, Reinforcement learning-based bus holding control: a case study, 2489
- Liu, 2007, Modelling Urban Bus Service and Passenger Reliability. In: The Third International Symposium on Transportation Network Reliability
- Ma, 2019, Processing raw GPS data from public transit systems: a framework for bus arrival time estimation, Transp. Res. Rec., 2673, 11, 10.1177/0361198119841145 · DOI
- Newell, 1964, Maintaining a bus schedule, Australian road research board (arrb) conference, 2nd, 1964, melbourne, 2
- Wall, 1999, An algorithm for predicting the arrival time of mass transit vehicles using automatic vehicle location data
- Wooldridge, 2009, An Introduction to MultiAgent Systems
Cited by
Still being checked.
Metadata
- Authors
- Rawat, S., Abaidullina, A., Alimbayeva, D., Kumar, D., & Kumar, P.
- Affiliations
- Amity University (IN)
- Astana IT University (KZ)
- Texas Tech University (US)
- Corresponding author
- Rawat, Seema
- Kumar, Deepak
- ORCID
- Rawat, Seema
- Venue
- Frontiers in Built Environment
- Publisher
- Frontiers Media SA
- Published
- 2026-09-22
- Volume
- 12
- ISSN
- 2297-3362 (ISSN-L)
- OpenAlex
- W7213969655
- Cited by
- 0
- References
- 12
- FWCI
- 0.00
- Type
- journal article
- Language
- en
- Open access
- gold
- doi.org
- Licence
- Locations
- Frontiers in Built Environment (publishedVersion, cc-by)
- DOAJ (DOAJ: Directory of Open Access Journals) (submittedVersion)
- Topics
- Social Sciences › Transportation › Transportation Planning and Optimization
- Social Sciences › Transportation › Traffic Prediction and Management Techniques
- Physical Sciences › Engineering › Control and Systems Engineering › Traffic control and management
- Keywords
- bus bunching, bus arrival prediction, estimated time of arrival, multi-agent systems, LSTM, real-time passenger information, missing data imputation, stop skipping, bus headway, autonomous buses, urban public transportation
About these checks
Registry, retraction, Cites and statistics results are computed, not judged, with one exception: a printed reference that no index lists is read once by a model before it counts as a citation error. Claims are extracted by a model and kept only when their quote appears verbatim in the text; each cited source is then checked, with a model’s help, for whether it says what the claim relies on. Those verdicts can be wrong — read the claim’s quote and the cited source before relying on one.
A language model drew the claims from the paper on 2026-11-11, under version 3 of the claim definition (model deepseek-v4.1-flash, prompt extract-v3).
A second model labelled each claim on 2026-11-11 (model jev-1.13-20260917, definition revision gold-guideline-v0.2).
Statistics and arithmetic are recomputed, not judged.
Confidence bands are shown only for fields calibrated on our annotated test set. None is calibrated yet, so no band is shown.
What counts as a claim ›How we measure confidence ›How we check this ›
Are you an author, or do you see a problem with this page? Request a review
Data sources
Bibliographic data: Semantic Scholar, OpenAlex, Crossref.
Contains information from the Semantic Scholar Academic Graph Datasets, made available under the ODC Attribution License (ODC-BY 1.0).
Semantic Scholar’s data is described in: Kinney, R., et al. (2023). The Semantic Scholar Open Data Platform. arXiv:2301.10140.
