

The DOI matches its Crossref record; 5 of the 5 references it cites were found in a registry or an index.
Mast Cell Repopulating Ability Is Lost During the Transition From Pre-HSC to FL HSC
Abstract
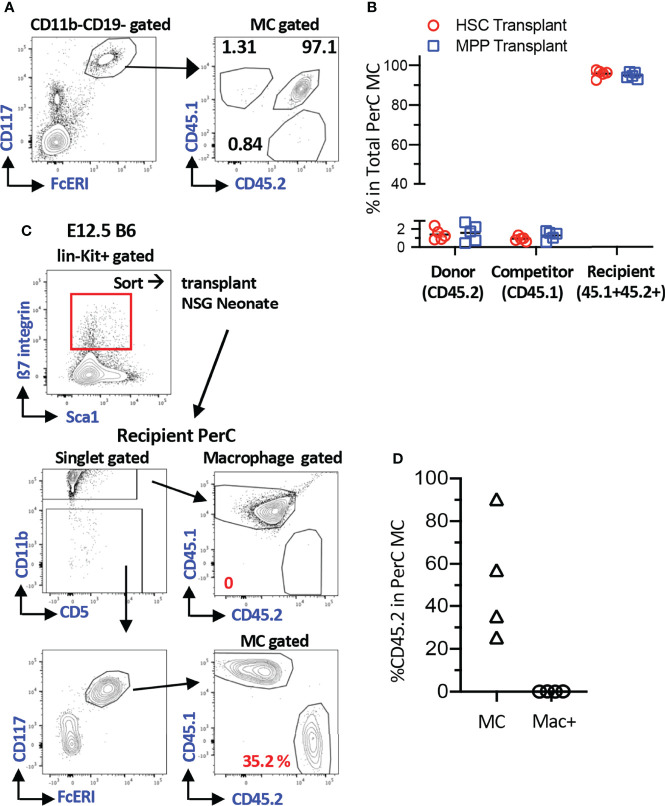
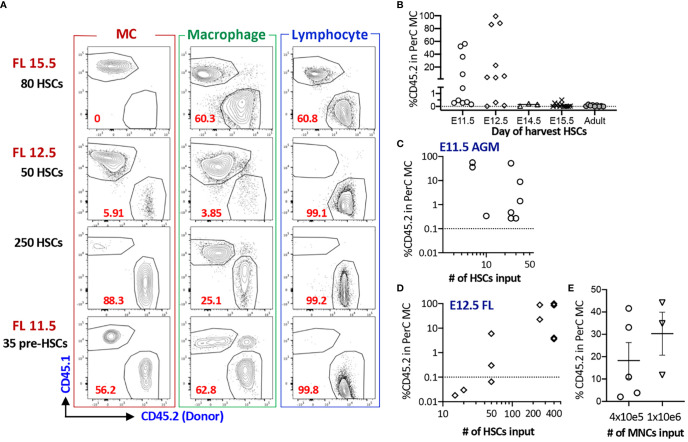
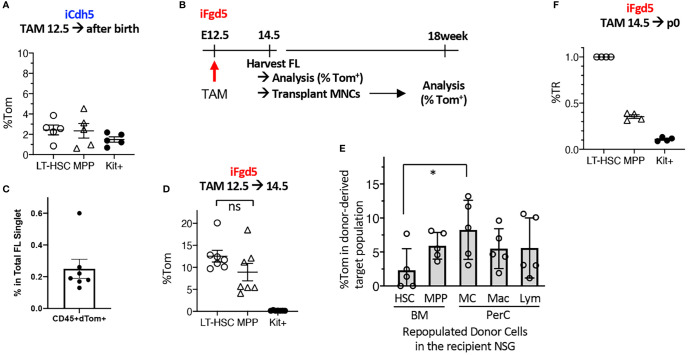
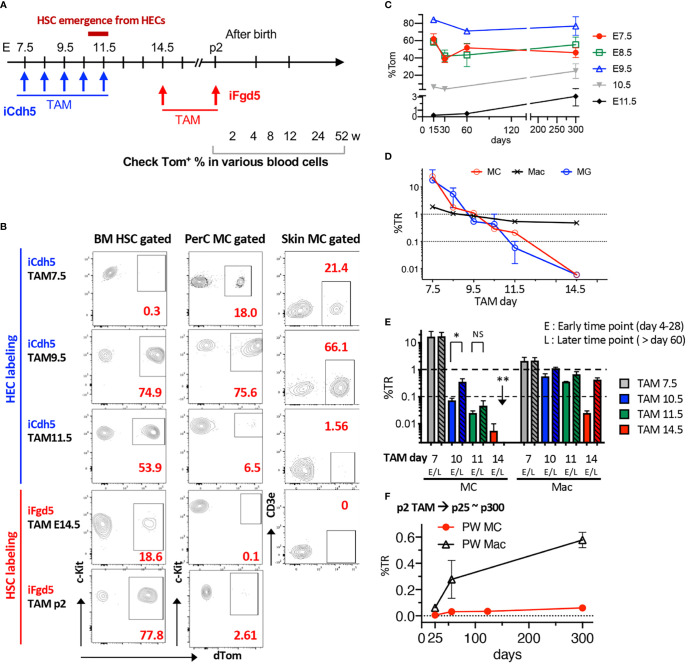
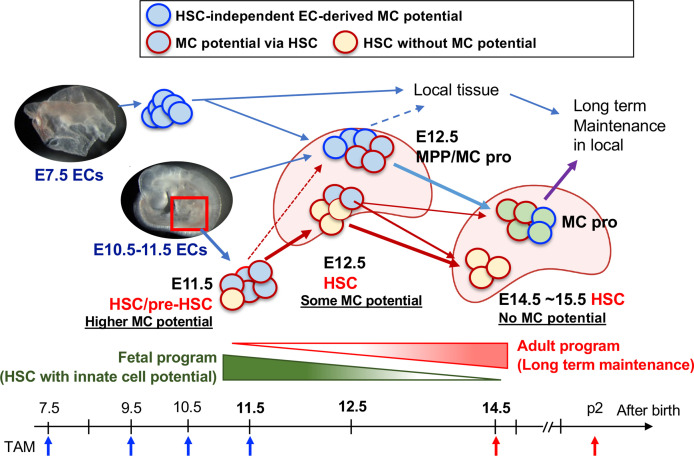
Recent advances in developmental immunology have revealed a hematopoietic stem cell (HSC)-independent origin for various innate immune lineages, including mast cells (MCs). It is now established that adult bone marrow (BM) long-term HSCs do not regenerate MCs but, instead, the physiological production of MCs starts before the emergence of HSCs in the aorta-gonad-mesonephros (AGM) region and is mostly completed before birth. However, while the AGM region represents a major site of MC generation during ontogeny, whether the first emerging HSCs in the AGM or fetal liver (FL) possess the potential to regenerate MCs is unknown. Here, we combined three fate-mapping mouse models with detailed HSC transplantation assays to determine the potential of AGM and FL HSCs to produce MCs. We show that HSCs from E11.5 AGM and E12.5 FL efficiently repopulated MCs in recipients. In stark contrast, HSCs from ≥E14.5 FL failed to reconstitute MCs. An Endothelial (EC) fate-mapping study confirmed the EC origin of the majority of MCs. Additionally, our HSC-labeling showed that HSCs do not produce MCs in a physiological setting. Hence, although most MCs are generated and maintained via an HSC-independent pathway, the earliest HSCs to emerge in the AGM and seed the early FL can produce MCs, but only during a minimal time window. Our results challenge the stem cell theory in hematology and EC-derived mast cells may contribute to the pathogenesis of postnatal mast cell disorders.
Overview
The claims and statistics of this paper haven’t been checked yet.
Run the check — free, no account needed. It reads the open-access text and checks the sources it cites.
Integrity signals
Registry
Cites
Statistics
Figures
Verification
Claims the paper makes
The claims and statistics of this paper haven’t been checked yet.
Run the check — free, no account needed. It reads the open-access text and checks the sources it cites.
Claims other papers make about this one
Each is checked against this paper’s own text: does it say what the citing paper says it does?
In the citing paper
“In support of this notion, progenitors with mast cell potential can be found in the fetal liver from E11.5 onwards, and these progenitors give rise to mast cells when transferred into fetal or newborn recipients. 54 , 69”
From Mast cell ontogeny: From fetal development to life‐long health and disease (2023) · cites this paper as [69]
In the citing paper
“A very recent study supports a model whereby fetal‐restricted HSCs are the main source of the second mast cell wave.”
From Mast cell ontogeny: From fetal development to life‐long health and disease (2023) · cites this paper as [69]
In the citing paper
“From a combination of genetic fate mapping, adoptive transfer, and in vitro differentiation assays, Yoshimoto and colleagues conclude that only the earliest HSCs found in the fetal liver give rise to mast cells, but not those present at a time when adult‐type HSCs dominate prior to BM colonization. 69”
From Mast cell ontogeny: From fetal development to life‐long health and disease (2023) · cites this paper as [69]
Self-check
Percentages, sums and reported differences re-computed from the paper’s own numbers.
The self-check needs the paper’s full text.
Citations
Cites
Hoeffel, G., Chen, J., Lavin, Y., Low, D., Almeida, F. F., See, P., Beaudin, A. E., Lum, J., Low, I., Forsberg, E. C., et al. (2015) · Immunity · doi:10.1016/j.immuni.2015.03.011 · Cited by 1,135
Fundamental properties of unperturbed haematopoiesis from stem cells in vivo
Busch, K., Klapproth, K., Barile, M., Flossdorf, M., Holland-Letz, T., Schlenner, S. M., Reth, M., Höfer, T., & Rodewald, H.-R. (2015) · Nature · doi:10.1038/nature14242 · Cited by 769
Hematopoietic Stem Cells Are the Major Source of Multilineage Hematopoiesis in Adult Animals
Sawai, C. M., Babovic, S., Upadhaya, S., Knapp, D. J. H. F., Lavin, Y., Lau, C. M., Goloborodko, A., Feng, J., Fujisaki, J., Ding, L., et al. (2016) · Immunity · doi:10.1016/j.immuni.2016.08.007 · Cited by 381 · cited 1×
“FL MPP subpopulations have not been characterized well, therefore, LSKCD150CD48 cells or KSL CD201(EPCR)CD48 cells were referred to as MPP in the FL (19).”
BackgroundWright, D. E., Cheshier, S. H., Wagers, A. J., Randall, T. D., Christensen, J. L., & Weissman, I. L. (2001) · Blood · doi:10.1182/blood.v97.8.2278 · Cited by 208
Säwen, P., Eldeeb, M., Erlandsson, E., Kristiansen, T. A., Laterza, C., Kokaia, Z., Karlsson, G., Yuan, J., Soneji, S., Mandal, P. K., et al. (2018) · eLife · doi:10.7554/elife.41258 · Cited by 120
Research works printed but not linked: 42
- Dwyer, 2016, Expression Profiling of Constitutive Mast Cells Reveals a Unique Identity Within the Immune System, Nat Immunol, 17, 10.1038/ni.3445 · DOI
- Gurish, 2012, Developmental Origin and Functional Specialization of Mast Cell Subsets, Immunity, 37, 10.1016/j.immuni.2012.07.003 · DOI
- Krystel-Whittemore, 2016, Mast Cell: A Multi-Functional Master Cell, Front Immunol, 6, 10.3389/fimmu.2015.00620 · DOI
- Méndez-Enríquez, 2019, Mast Cells and Their Progenitors in Allergic Asthma, Front Immunol, 10, 10.3389/fimmu.2019.00821 · DOI
- Marichal, 2013, Mast Cells: Potential Positive and Negative Roles in Tumor Biology, Cancer Immunol Res, 1, 10.1158/2326-6066.CIR-13-0119 · DOI
- Ribatti, 2014, Mast Cell Ontogeny: An Historical Overview, Immunol Lett, 159, 10.1016/j.imlet.2014.02.003 · DOI · Paper page
- Arinobu, 2005, Developmental Checkpoints of the Basophil/Mast Cell Lineages in Adult Murine Hematopoiesis, Proc Natl Acad Sci USA, 102, 10.1073/pnas.0509148102 · DOI · Paper page
- Franco, 2010, Distinguishing Mast Cell and Granulocyte Differentiation at the Single-Cell Level, Cell Stem Cell, 6, 10.1016/j.stem.2010.02.013 · DOI
- Grimbaldeston, 2005, Mast Cell-Deficient W-Sash C-Kit Mutant Kit W-Sh/W-Sh Mice as a Model for Investigating Mast Cell Biology In Vivo, Am J Pathol, 167, 10.1016/S0002-9440(10)62055-X · DOI · Paper page
- Li, 2018, Adult Connective Tissue-Resident Mast Cells Originate From Late Erythro-Myeloid Progenitors, Immunity, 49, 640, 10.1016/j.immuni.2018.09.023 · DOI · Paper page
- Gentek, 2018, Hemogenic Endothelial Fate Mapping Reveals Dual Developmental Origin of Mast Cells, Immunity, 48, 1160, 10.1016/j.immuni.2018.04.025 · DOI · Paper page
- McGrath, 2015, Early Hematopoiesis and Macrophage Development, Semin Immunol, 27, 10.1016/j.smim.2016.03.013 · DOI
- Ghosn, 2019, Hematopoietic Stem Cell-Independent Hematopoiesis and the Origins of Innate-Like B Lymphocytes, Dev (Cambridge), 146, 10.1242/dev.170571 · DOI
- Ueno, 2006, Clonal Analysis of Mouse Development Reveals a Polyclonal Origin for Yolk Sac Blood Islands, Dev Cell, 11, 10.1016/j.devcel.2006.08.001 · DOI
- Samokhvalov, 2007, Cell Tracing Shows the Contribution of the Yolk Sac to Adult Haematopoiesis, Nature, 446, 10.1038/nature05725 · DOI
- Challen, 2021, Simplified Murine Multipotent Progenitor Isolation Scheme: Establishing a Consensus Approach for Multipotent Progenitor Identification, Exp Hematol, 104, 10.1016/j.exphem.2021.09.007 · DOI
- Eddins, 2021, Hematopoietic Stem Cell Requirement for Macrophage Regeneration Is Tissue Specific, J Immunol, 207, 10.4049/jimmunol.2100344 · DOI
- Ghosn, 2016, Fetal Hematopoietic Stem Cell Transplantation Fails to Fully Regenerate the B-Lymphocyte Compartment, Stem Cell Rep, 6, 10.1016/j.stemcr.2015.11.011 · DOI
- Kobayashi, 2021, HSC-Independent Definitive Hematopoietic Cells Persist Into Adult Life, bioRxiv, 2012.2002.468909, 10.1101/2021.12.02.468909 · DOI
- Yoder, 1997, Engraftment of Embryonic Hematopoietic Cells in Conditioned Newborn Recipients, Blood, 89, 10.1182/blood.v89.6.2176 · DOI
- Kobayashi, 2019, Hemogenic Endothelial Cells Can Transition to Hematopoietic Stem Cells Through a B-1 Lymphocyte-Biased State During Maturation in the Mouse Embryo, Stem Cell Rep, 13, 10.1016/j.stemcr.2019.05.025 · DOI
- Yoder, 1997, Characterization of Definitive Lymphohematopoietic Stem Cells in the Day 9 Murine Yolk Sac, Immunity, 7, 10.1016/S1074-7613(00)80355-6 · DOI
- Rybtsov, 2011, Hierarchical Organization and Early Hematopoietic Specification of the Developing HSC Lineage in the AGM Region, J Exp Med, 208, 10.1084/jem.20102419 · DOI
- Gazit, 2014, Fgd5 Identifies Hematopoietic Stem Cells in the Murine Bone Marrow, J Exp Med, 211, 10.1084/jem.20130428 · DOI
- Sörensen, 2009, DLL1-Mediated Notch Activation Regulates Endothelial Identity in Mouse Fetal Arteries, Blood, 113, 10.1182/blood-2008-08-174508 · DOI
- Ginhoux, 2016, Tissue-Resident Macrophage Ontogeny and Homeostasis, Immunity, 44, 10.1016/j.immuni.2016.02.024 · DOI · Paper page
- Kitamura, 1977, Development of Mast Cells From Grafted Bone Marrow Cells in Irradiated Mice, Nature, 268, 10.1038/268442a0 · DOI
- Kitamura, 1979, Distribution of Mast-Cell Precursors in Hematopoietic and Lymphopoietic Tissues of Mice, J Exp Med, 150, 10.1084/jem.150.3.482 · DOI
- Kitamura, 1979, Presence of Mast Cell Precursors in Peripheral Blood of Mice Demonstrated by Parabiosis, Blood, 53, 10.1182/blood.v53.6.1085.bloodjournal5361085 · DOI
- Hatanaka, 1979, Local Development of Mast Cells From Bone Marrow-Derived Precursors in the Skin of Mice, Blood, 53, 10.1182/blood.v53.1.142.142 · DOI · Paper page
- Chen, 2005, Identification of Mast Cell Progenitors in Adult Mice, Proc Natl Acad Sci USA, 102, 10.1073/pnas.0504197102 · DOI · Paper page
- Dahlin, 2015, Mast Cell Progenitors: Origin, Development and Migration to Tissues, Mol Immunol, 63, 10.1016/j.molimm.2014.01.018 · DOI · Paper page
- Gomez Perdiguero, 2014, Tissue-Resident Macrophages Originate From Yolk-Sac-Derived Erythro-Myeloid Progenitors, Nature, 518, 10.1038/nature13989 · DOI · Paper page
- Yoshimoto, 2015, The First Wave of B Lymphopoiesis Develops Independently of Stem Cells in the Murine Embryo, Ann N Y Acad Sci, 1362, 16, 10.1111/nyas.12612 · DOI
- Gentek, 2018, Epidermal γδ T Cells Originate From Yolk Sac Hematopoiesis and Clonally Self-Renew in the Adult, J Exp Med, 215, 10.1084/jem.20181206 · DOI
- Chapple, 2018, Lineage Tracing of Murine Adult Hematopoietic Stem Cells Reveals Active Contribution to Steady-State Hematopoiesis, Blood Adv, 2, 10.1182/bloodadvances.2018016295 · DOI · Paper page
- Takahashi, 2021, Reconciling Flux Experiments for Quantitative Modeling of Normal and Malignant Hematopoietic Stem/Progenitor Dynamics, Stem Cell Rep, 16, 10.1016/j.stemcr.2021.02.020 · DOI
- Wüst, 2020, Confounding Factors From Inducible Systems for Spatiotemporal Gene Expression Regulation, J Cell Biol, 219, 10.1083/JCB.202003031 · DOI
- Arora, 2014, Effect of Developmental Stage of HSC and Recipient on Transplant Outcomes, Dev Cell, 29, 10.1016/j.devcel.2014.04.013 · DOI
- Yoshimoto, 2011, Embryonic Day 9 Yolk Sac and Intra-Embryonic Hemogenic Endothelium Independently Generate a B-1 and Marginal Zone Progenitor Lacking B-2 Potential, Proc Natl Acad Sci USA, 108, 10.1073/pnas.1015841108 · DOI
- Hadland, 2017, A Common Origin for B-1a and B-2 Lymphocytes in Clonal Pre- Hematopoietic Stem Cells, Stem Cell Rep, 8, 10.1016/j.stemcr.2017.04.007 · DOI
- Ding, 2021, The Earliest T-Precursors in the Mouse Embryo Are Susceptible to Leukemic Transformation, Front Cell Dev Biol, 9, 10.3389/fcell.2021.634151 · DOI
Cited by
Sorted by citations
Mast cell ontogeny: From fetal development to life‐long health and disease
Chia, S. L., Kapoor, S., Carvalho, C., Bajénoff, M., & Gentek, R. (2023) · Immunological Reviews · doi:10.1111/imr.13191 · Cited by 60
Metadata
- Authors
- Yoshimoto, M., Kosters, A., Cornelius, S., Valiente, N., Cheng, H., Latorre, A., Nishida, C., Ghosn, E. E. B., & Kobayashi, M.
- Venue
- Frontiers in Immunology
- Publisher
- Frontiers Media SA
- Published
- 2022-07-08
- Volume
- 13
- ISSN
- 1664-3224
- PMC
- PMC9309215
- Cited by
- 14
- References
- 5
- Funders
- National Institute of Allergy and Infectious Diseases (R01AI121197, R01AI123126)
About these checks
Registry, retraction, Cites and statistics results are computed, not judged, with one exception: a printed reference that no index lists is read once by a model before it counts as a citation error. Claims are extracted by a model and kept only when their quote appears verbatim in the text; each cited source is then checked, with a model’s help, for whether it says what the claim relies on. Those verdicts can be wrong — read the claim’s quote and the cited source before relying on one.
Statistics and arithmetic are recomputed, not judged.
Confidence bands are shown only for fields calibrated on our annotated test set. None is calibrated yet, so no band is shown.
What counts as a claim ›How we measure confidence ›How we check this ›
Are you an author, or do you see a problem with this page? Request a review
How to cite
Cite CoChat for the checks on this page, and the paper for its own findings.
- This page
- CoChat. (2026). Citation check: Mast Cell Repopulating Ability Is Lost During the Transition From Pre-HSC to FL HSC. https://app.cochat.ai/papers/10.3389/fimmu.2022.896396
- The paper
- Yoshimoto, M., Kosters, A., Cornelius, S., Valiente, N., Cheng, H., Latorre, A., Nishida, C., Ghosn, E. E. B., & Kobayashi, M. (2022). Mast Cell Repopulating Ability Is Lost During the Transition From Pre-HSC to FL HSC. Frontiers in Immunology. https://doi.org/10.3389/fimmu.2022.896396
