

The DOI matches its Crossref record; 110 of the 115 references it cites were found in a registry or an index.
Loss of IL-10 Promotes Differentiation of Microglia to a M1 Phenotype
Open accessAbstract
Microglia represent the primary resident immune cells of the central nervous system (CNS) and modulate local immune responses. Depending on their physiological functions, microglia can be classified into pro- (M1) and anti-inflammatory (M2) phenotype. Interleukin (IL)-10 is an important modulator of neuronal homeostasis, with anti-inflammatory and neuroprotective functions, and can be released by microglia. Here, we investigated how IL-10 deficiency affected the M1/2 polarization of primary microglia upon lipopolysaccharide (LPS) stimulation in vitro. Microglia phenotypes were analyzed via flow cytometry. Cytokine and chemokine secretion were examined by ELISA and bead-based multiplex LEGENDplex™. Our results showed that genetic depletion of IL-10 led to elevated M1 like phenotype (CD86+CD206-) under pro-inflammatory conditions associated with increased frequency of IL-6+, TNF-α+ cells and enhanced release of several pro-inflammatory chemokines. Absence of IL-10 led to an attenuated M2 like phenotype (CD86-CD206+) and a reduced secretion of TGF-β1 upon LPS stimulation. In conclusion, IL-10 deficiency may promote the polarisation of microglia into M1-prone phenotype under pro-inflammatory conditions.
Overview
The claims and statistics of this paper haven’t been checked yet.
Run the check — free, no account needed. It reads the open-access text and checks the sources it cites.
Integrity signals
Registry
Cites
Statistics
Figures
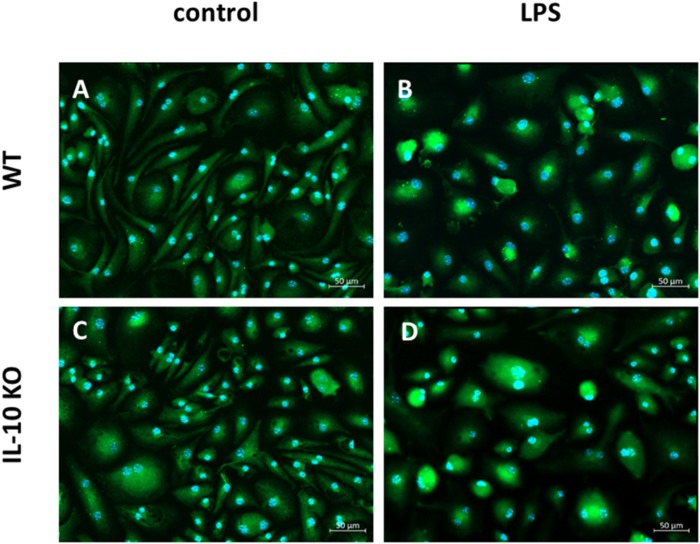
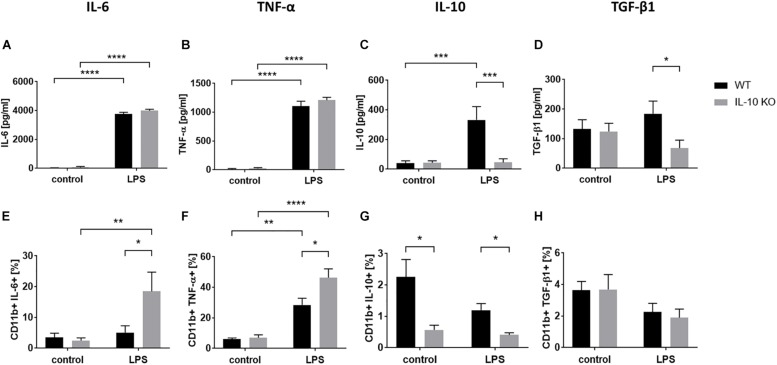
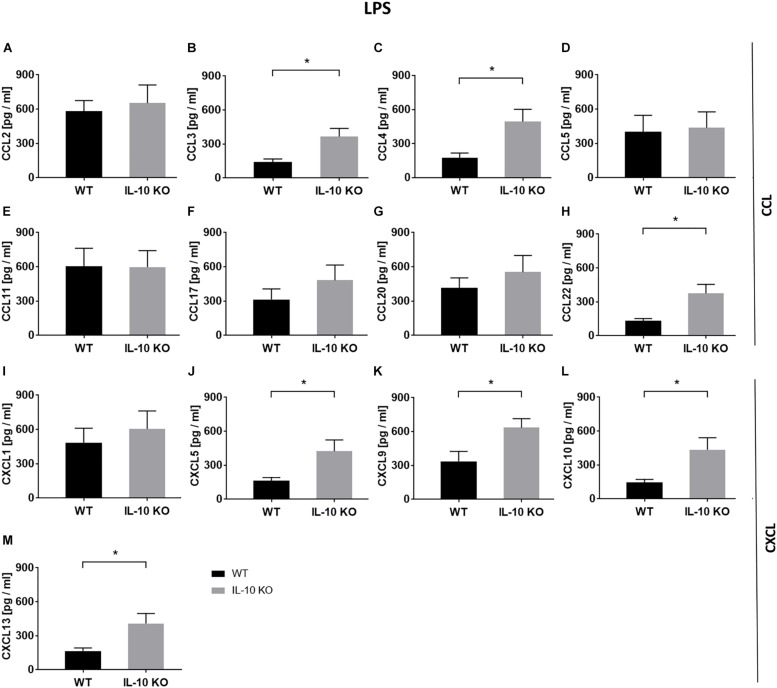
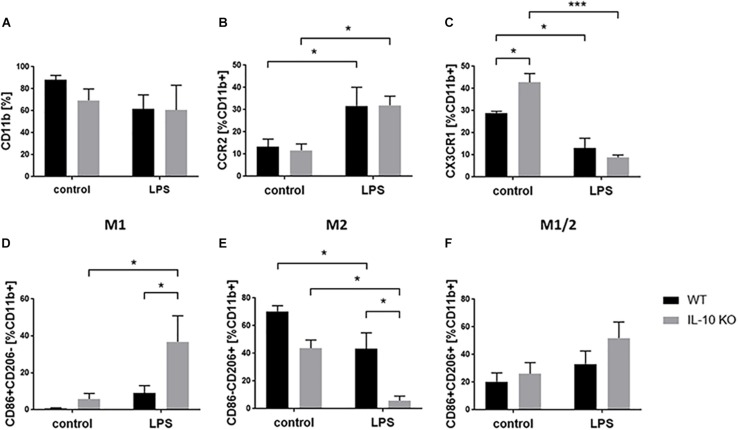
Verification
Claims the paper makes
The claims and statistics of this paper haven’t been checked yet.
Run the check — free, no account needed. It reads the open-access text and checks the sources it cites.
Claims other papers make about this one
Each is checked against this paper’s own text: does it say what the citing paper says it does?
The cited source says what the claim attributes to it.
In the citing paper
“which is known to inhibit the synthesis of pro-inflammatory cytokines, and may promote the differentiation of microglia into the anti-inflammatory state, classically known as M2 or homeostatic state [40].”
From Heterozygous expression of the Alzheimer’s disease-protective PLCγ2 P522R variant enhances Aβ clearance while preserving synapses (2022) · cites this paper as [40]
Self-check
Percentages, sums and reported differences re-computed from the paper’s own numbers.
The self-check needs the paper’s full text.
Citations
Cites
1 retracted
Yang, J., Jiang, Z., Fitzgerald, D. C., Ma, C., Yu, S., Li, H., Zhao, Z., Li, Y., Ćirić, B., Curtis, M. T., et al. (2009) · Journal of Clinical Investigation · doi:10.1172/jci37914 · Cited by 194
RetractedInterleukin-10 and the Interleukin-10 Receptor
Moore, K. W., de Waal Malefyt, R., Coffman, R. L., & O'Garra, A. (2001) · Annual Review of Immunology · doi:10.1146/annurev.immunol.19.1.683 · Cited by 6,737
Alternative activation of macrophages
Gordon, S. (2003) · Nature Reviews Immunology · doi:10.1038/nri978 · Cited by 6,189
Resting microglial cells are highly dynamic surveillants of brain parenchyma in vivo
Nimmerjahn, A., Kirchhoff, F., & Helmchen, F. (2005) · Science · doi:10.1126/science.1110647 · Cited by 5,827
Microglia: a sensor for pathological events in the CNS
Kreutzberg, G. W. (1996) · Trends in Neurosciences · doi:10.1016/0166-2236(96)10049-7 · Cited by 4,396
Interleukin-10-deficient mice develop chronic enterocolitis
Kühn, R., Löhler, J., Rennick, D. M., Rajewsky, K., & Müller, W. (1993) · Cell · doi:10.1016/0092-8674(93)80068-p · Cited by 4,248
ATP mediates rapid microglial response to local brain injury in vivo
Davalos, D., Grutzendler, J., Yang, G., Kim, J. V., Zuo, Y., Jung, S., Littman, D. R., Dustin, M. L., & Gan, W.-B. (2005) · Nature Neuroscience · doi:10.1038/nn1472 · Cited by 3,913
Macrophage activation and polarization
Martinez, F. O. (2008) · Frontiers in Bioscience · doi:10.2741/2692 · Cited by 3,160
Alternative Activation of Macrophages: An Immunologic Functional Perspective
Martinez, F. O., Helming, L., & Gordon, S. (2009) · Annual Review of Immunology · doi:10.1146/annurev.immunol.021908.132532 · Cited by 2,745
Identification of a unique TGF-β–dependent molecular and functional signature in microglia
Butovsky, O., Jedrychowski, M. P., Moore, C. S., Cialic, R., Lanser, A. J., Gabriely, G., Koeglsperger, T., Dake, B., Wu, P. M., Doykan, C. E., et al. (2014) · Nature Neuroscience · doi:10.1038/nn.3599 · Cited by 2,543
Cited by
Sorted by citations
Guidelines for the use of flow cytometry and cell sorting in immunological studies (third edition)
Cossarizza, A., Chang, H., Radbruch, A., Abrignani, S., Addo, R., Akdis, M., Andrä, I., Andreata, F., Annunziato, F., Arranz, E., et al. (2021) · European Journal of Immunology · doi:10.1002/eji.202170126 · Cited by 531
Exploring Sex-Related Differences in Microglia May Be a Game-Changer in Precision Medicine
Lynch, M. A. (2022) · Frontiers in Aging Neuroscience · doi:10.3389/fnagi.2022.868448 · Cited by 146
Patel, R. R., Wolfe, S. A., Bajo, M., Abeynaike, S. A., Pahng, A. R., Borgonetti, V., D’Ambrosio, S. R., Nikzad, R., Edwards, S., Paust, S., et al. (2020) · Progress in Neurobiology · doi:10.1016/j.pneurobio.2020.101952 · Cited by 71
Interleukin-10 deficiency exacerbates inflammation-induced tau pathology
Weston, L. L., Jiang, S., Chisholm, D., Jantzie, L. L., & Bhaskar, K. (2021) · Journal of Neuroinflammation · doi:10.1186/s12974-021-02211-1 · Cited by 69
Tao, W., Zhang, G., Liu, C., Jin, L., Li, X., & Yang, S. (2023) · Redox Biology · doi:10.1016/j.redox.2023.102863 · Cited by 64
Microglia dynamics in adolescent traumatic brain injury
Eyolfson, E., Khan, A. C., Mychasiuk, R., & Lohman, A. W. (2020) · Journal of Neuroinflammation · doi:10.1186/s12974-020-01994-z · Cited by 68
Izzy, S., Yahya, T., Albastaki, O., Abou‐El‐Hassan, H., Aronchik, M., Cao, T., de Oliveira, M. G., Lu, K.-J., Moreira, T. G., da Silva, P., et al. (2025) · Nature Neuroscience · doi:10.1038/s41593-025-01877-7 · Cited by 65
Kunz, N., & Kemper, C. (2021) · Frontiers in Immunology · doi:10.3389/fimmu.2021.629986 · Cited by 63
Pap, R., Pandur, E., Jánosa, G., Sipos, K., Agócs, A., & Deli, J. (2021) · Antioxidants · doi:10.3390/antiox10030363 · Cited by 64
CCL5 via GPX1 activation protects hippocampal memory function after mild traumatic brain injury
Ho, M.-H., Yen, C., Hsieh, T.-H., Kao, T., Chiu, J.-Y., Chiang, Y. H., Hoffer, B. J., Chang, W., & Chou, S. (2021) · Redox Biology · doi:10.1016/j.redox.2021.102067 · Cited by 57
An integrated cytokine and kynurenine network as the basis of neuroimmune communication
Stone, T. W., Clanchy, F. I. L., Huang, Y., Chiang, N., Darlington, L. G., & Williams, R. O. (2022) · Frontiers in Neuroscience · doi:10.3389/fnins.2022.1002004 · Cited by 57
Quintana, J. F., Chandrasegaran, P. R. G., Sinton, M. C., Briggs, E. M., Otto, T. D., Heslop, R., Bentley-Abbot, C., Loney, C., de Lecea, L., Mabbott, N. A., et al. (2022) · Nature Communications · doi:10.1038/s41467-022-33542-z · Cited by 49
Crosstalk between Microglia and Neurons in Neurotrauma: An Overview of the Underlying Mechanisms
Shaito, A. A., Kobeissy, F. H., Haidar, M. A., Ibeh, S., Shakkour, Z., Reslan, M. A., Nwaiwu, J. I., Moqidem, Y. A., Sader, G., Nickles, R. G., et al. (2021) · Current Neuropharmacology · doi:10.2174/1570159x19666211202123322 · Cited by 51
Complement peptide C3a receptor 1 promotes optic nerve degeneration in DBA/2J mice
Harder, J. M., Williams, P. A., Braine, C., Yang, H. S., Thomas, J. M., Foxworth, N. E., John, S. W. M., & Howell, G. R. (2020) · Journal of Neuroinflammation · doi:10.1186/s12974-020-02011-z · Cited by 49
Non-Coding RNA in Microglia Activation and Neuroinflammation in Alzheimer’s Disease
He, C., Li, Z., Yang, M., Yu, W., Luo, R., Zhou, J., He, J., Chen, Q., Song, Z., & Cheng, S. (2023) · Journal of Inflammation Research · doi:10.2147/jir.s422114 · Cited by 49
Zhang, L., Lu, X., Gong, L., Cui, L., Zhang, H., Zhao, W., Jiang, P., Hou, G., & Hou, Y. (2020) · Cellular and Molecular Neurobiology · doi:10.1007/s10571-020-00878-3 · Cited by 48
Immune Response in Traumatic Brain Injury
Cáceres, E. L., Olivella-Gómez, J., Napoli, M. D., Raihane, A. S., & Divani, A. A. (2024) · Current Neurology and Neuroscience Reports · doi:10.1007/s11910-024-01382-7 · Cited by 53
Incorporating microglia‐like cells in human induced pluripotent stem cell‐derived retinal organoids
Chichagova, V., Georgiou, M., Carter, M., Dorgau, B., Hilgen, G., Collin, J., Queen, R., Chung, G., Ajeian, J., Moya‐Molina, M., et al. (2023) · Journal of Cellular and Molecular Medicine · doi:10.1111/jcmm.17670 · Cited by 37
Radpour, M., Khoshkroodian, B., Asgari, T., Pourbadie, H. G., & Sayyah, M. (2023) · Inflammation · doi:10.1007/s10753-023-01843-0 · Cited by 37
Potential roles of branched-chain amino acids in neurodegeneration
Yoo, H.-S., Shanmugalingam, U., & Smith, P. D. (2022) · Nutrition · doi:10.1016/j.nut.2022.111762 · Cited by 37
Wang, T., Zhao, N., Li, P., Li, Y., Huang, X., Zhu, J., Chen, Y., Yu, S., & Zhao, Y. (2020) · Frontiers in Cell and Developmental Biology · doi:10.3389/fcell.2020.593890 · Cited by 32
Ihnatovych, I., Birkaya, B. G., Notari, E., & Szigeti, K. (2020) · International Journal of Molecular Sciences · doi:10.3390/ijms21249668 · Cited by 31
Roles of the Notch signaling pathway and microglia in autism
Zhang, Y., Wang, T., Li, Y., Deng, Y.-N., & Shen, F. (2022) · Behavioural Brain Research · doi:10.1016/j.bbr.2022.114131 · Cited by 31
Microglia–Neutrophil Interactions Drive Dry AMD-like Pathology in a Mouse Model
Boyce, M., Xin, Y., Chowdhury, O., Shang, P., Liu, H., Koontz, V., Strizhakova, A., Nemani, M., Hose, S., Zigler, J. S., et al. (2022) · Cells · doi:10.3390/cells11223535 · Cited by 31
Xu, P., Dong, S., Wu, L., Bai, Y., Bi, X., Li, Y., & Shu, C. (2022) · Nutrients · doi:10.3390/nu15010070 · Cited by 33
Rupareliya, V. P., Singh, A. A., Butt, A. M., A, H., & Kumar, H. (2023) · European Journal of Pharmacology · doi:10.1016/j.ejphar.2023.176048 · Cited by 29
Marefati, N., Beheshti, F., Vafaee, F., Barabadi, M., & Hosseini, M. (2021) · Neurochemical Research · doi:10.1007/s11064-021-03381-3 · Cited by 30
Rafiei, M., Shojaei, A., & Chau, Y. (2025) · Drug Delivery · doi:10.1080/10717544.2025.2465909 · Cited by 32
Christensen, J., Eyolfson, E., Salberg, S., & Mychasiuk, R. (2020) · Developmental Review · doi:10.1016/j.dr.2020.100943 · Cited by 28
Yang, F., Bi, Y., & Chen, H. (2021) · Frontiers in Pharmacology · doi:10.3389/fphar.2021.635762 · Cited by 27
Does Modern Lifestyle Favor Neuroimmunometabolic Changes? A Path to Obesity
Marques, C. G., Quaresma, M. V. L. D. S., Nakamoto, F. P., Magalhães, A. C. O., Lucin, G. A., & dos Santos, R. V. T. (2021) · Frontiers in Nutrition · doi:10.3389/fnut.2021.705545 · Cited by 30
Chua, X. Y., Chong, J. R., Cheng, A. L., Lee, J. H., Ballard, C. G., Aarsland, D., Francis, P. T., & Lai, M. K. P. (2021) · Neurochemistry International · doi:10.1016/j.neuint.2021.105251 · Cited by 26
Solomon, S., Sampathkumar, N. K., Carre, I., Mondal, M., Chennell, G., Vernon, A. C., Ruepp, M.-D., & Mitchell, J. C. (2022) · Cellular and Molecular Life Sciences · doi:10.1007/s00018-022-04473-1 · Cited by 23
“Our findings suggest a significant increase in the expression of the anti-inflammatory cytokine, interleukin-10 (IL-10), which is known to inhibit the synthesis of proinflammatory cytokines, and may promote the differentiation of microglia into the anti-inflammatory state, classically known as M2 or homeostatic state…”
BackgroundEffects of lead exposure on the activation of microglia in mice fed with high‐fat diets
Wu, L., Li, S., Pang, S., Zhang, B., Wang, J., He, B., Lv, L., Wang, W., Zhao, N., & Zhang, Y. (2021) · Environmental Toxicology · doi:10.1002/tox.23312 · Cited by 22
Humoral immunity at the brain borders in homeostasis
Posner, D. A., Lee, C. Y. C., Portet, A., & Clatworthy, M. R. (2022) · Current Opinion in Immunology · doi:10.1016/j.coi.2022.102188 · Cited by 21
Wei, Q., Chen, X., & Chen, H. (2020) · Genetic Testing and Molecular Biomarkers · doi:10.1089/gtmb.2020.0069 · Cited by 22
Lutein and inflammation: a comprehensive review of its mechanisms of action
Prathyusha, P., Viswanathan, G., Tomcy, A. T., Binitha, P. P., Bava, S. V., & Sindhu, E. R. (2025) · Exploration of Drug Science · doi:10.37349/eds.2025.100885 · Cited by 21
Oligodendrocytes in central nervous system diseases: the effect of cytokine regulation
Zhang, C., Qiu, M. S., & Fu, H. Q. (2024) · Neural Regeneration Research · doi:10.4103/1673-5374.392854 · Cited by 21
de Oliveira, T. C. G., Paulo, D. C., de Lima, C. M., de Oliveira, R. B., Filho, C. S., Diniz, D. G., Bento‐Torres, J., & Diniz, C. W. P. (2020) · European Journal of Neuroscience · doi:10.1111/ejn.14920 · Cited by 21
Tsukahara, T., Haniu, H., Uemura, T., & Matsuda, Y. (2020) · Biomedicines · doi:10.3390/biomedicines8110446 · Cited by 20
Microglial activation and over pruning involved in developmental epilepsy
Wu, Q., Wang, H., Liu, X., Zhao, Y., & Peng, S. (2022) · Journal of Neuropathology & Experimental Neurology · doi:10.1093/jnen/nlac111 · Cited by 21
Chim, S. M., Howell, K., Kokkosis, A. G., Zambrowicz, B., Karalis, K. P., & Pavlopoulos, E. (2024) · Pharmaceutics · doi:10.3390/pharmaceutics16101314 · Cited by 22
Reyes-Mendoza, J., & Morales, T. (2020) · Brain Research · doi:10.1016/j.brainres.2020.147014 · Cited by 17
Gao, W., Du, J., Chi, Y., Zhu, R., Gao, X., & Yang, L. (2020) · Experimental Eye Research · doi:10.1016/j.exer.2020.108403 · Cited by 17
Kunevičius, A., Vijaya, A. K., Atzeni, A., Mingaila, J., Šimoliūnė, I., Jamontas, R., Kezeviciute, E., Gueimonde, M., Meškys, R., Baltriukienė, D., et al. (2025) · Frontiers in Aging Neuroscience · doi:10.3389/fnagi.2025.1617980 · Cited by 17
Xia, C., Xu, J., Li, L., Lian, W., Yan, Y., Ma, B.-Z., He, J., & Zhang, W. (2021) · Journal of Ethnopharmacology · doi:10.1016/j.jep.2021.114526 · Cited by 17
Cen, Q., Cui, Y., Feng, J., Li, Z., Wei, J., Wang, L., Chang, C., Pang, R., Wang, J., & Zhang, A. (2025) · Probiotics and Antimicrobial Proteins · doi:10.1007/s12602-025-10545-y · Cited by 17
Rojas, P., Ramirez, A. I., Cadena, M., Fernández‐Albarral, J. A., Salobrar‐García, E., López‐Cuenca, I., Santos‐García, I., de Lago, E., Urcelay-Segura, J. L., Ramirez, J. M., et al. (2021) · International Journal of Molecular Sciences · doi:10.3390/ijms22041663 · Cited by 17
Cakmak, B., Saglam‐Metiner, P., Beceren, G., Zhang, Y. S., & Yeşil-Çeliktaş, Ö. (2022) · Bio-Design and Manufacturing · doi:10.1007/s42242-022-00198-z · Cited by 15
Wang, B., Kasper, M., Laffer, B., zu Hörste, G. M., Wasmuth, S., Busch, M., Jalilvand, T. V., Thanos, S., Heiligenhaus, A., Bauer, D., et al. (2020) · Frontiers in Immunology · doi:10.3389/fimmu.2020.573955 · Cited by 14
Self-citationSteinberg, N., Galleguillos, D., Zaidi, A. K., Horkey, M., & Sipione, S. (2023) · Journal of Neuroinflammation · doi:10.1186/s12974-023-02963-y · Cited by 14
Lee, S., Kim, J., You, J.-S., Hyun, Y.-M., Kim, J. Y., & Lee, J. E. (2024) · Scientific Reports · doi:10.1038/s41598-024-60358-2 · Cited by 16
Role of Regulatory T Cells in Intracerebral Hemorrhage
Shang, Y., Zheng, L., Du, Y., Shang, T., Liu, X., & Zou, W. (2024) · Molecular Neurobiology · doi:10.1007/s12035-024-04281-7 · Cited by 14
Tantingco, G., & Ryou, M. (2020) · Experimental Biology and Medicine · doi:10.1177/1535370220919361 · Cited by 13
Mazzeo, A., Porta, M., & Beltramo, E. (2022) · International Journal of Molecular Sciences · doi:10.3390/ijms23105745 · Cited by 12
Jackson, L., Cole, E. F., Arbiser, J. L., Silverberg, J. I., & Lawley, L. P. (2021) · Pediatric Dermatology · doi:10.1111/pde.14657 · Cited by 13
Yu, W., Che, C., Yang, Y., Zhao, Y., Liu, J., Chen, A., & Shi, J. (2024) · Advanced Science · doi:10.1002/advs.202408647 · Cited by 12
Zheng, P., Bai, Q., Feng, J., Zhao, B., Duan, J., Zhao, L., Liu, N., Ren, D., Zou, S., & Chen, W. (2021) · Bioengineering & Translational Medicine · doi:10.1002/btm2.10249 · Cited by 10
Combination Gene Delivery Reduces Spinal Cord Pathology in Rats With Peripheral Neuropathic Pain
Ji, H., Kim, K.-R., Park, J.-J., Lee, J. Y., Sim, Y., Choi, H., & Kim, S. (2023) · Journal of Pain · doi:10.1016/j.jpain.2023.07.007 · Cited by 11
Zhou, J., Yang, F., Li, H., Xu, P., Wang, Z., Shao, F., Shao, A., & Zhang, J. (2023) · Medicina · doi:10.3390/medicina59071317 · Cited by 10
Hetze, S., Barthel, L., Lückemann, L., Günther, H. S., Wülfing, C., Salem, Y., Jakobs, M., Hörbelt, T., Petschulat, J., Bendix, I., et al. (2022) · Brain Behavior and Immunity · doi:10.1016/j.bbi.2022.09.006 · Cited by 13
Takahashi, K., Nakagawasai, O., Kurokawa, K., Miyagawa, K., Mochida-Saito, A., Takeda, H., & Tsuji, M. (2025) · Journal of Neuroimmune Pharmacology · doi:10.1007/s11481-025-10232-3 · Cited by 9
Stem cell-mediated recovery in stroke: partnering with the immune system
McMillan, N., McMillan, A., Kiliaan, P. C. J., Yahya, T., Thakkar, R., Weiner, H. L., Smirnakis, S. M., Yavagal, D. R., & Izzy, S. (2025) · Nature reviews. Neuroscience · doi:10.1038/s41583-025-00985-4 · Cited by 9
Silwal, A., House, A., Sandoval, K. E., Vijeth, S., Umbaugh, D. S., Crider, A. M., Mobayen, S., Neumann, W. L., & WITT, K. A. (2021) · Neurochemical Research · doi:10.1007/s11064-021-03482-z · Cited by 8
Sun, Q., Cui, Z., Li, J., Zhang, Q., Zheng, J., Lu, F., & Liu, F. (2024) · Aging advances. · doi:10.4103/agingadv.agingadv-d-24-00017 · Cited by 8
Neuro-immune interactions in coronary microvascular disease: mechanisms and therapeutic prospect
Zhao, G., Wu, G., Ma, J., Ren, S., Liu, T., Wu, X., & Wang, X. (2025) · Frontiers in Immunology · doi:10.3389/fimmu.2025.1631083 · Cited by 8
Exploring the Connectivity of Neurodegenerative Diseases: Microglia as the Center
Wang, Y., Cui, L., Zhao, H., He, H., Chen, L., Song, X., Liu, D., Qiu, J., & Sun, Y. (2023) · Journal of Inflammation Research · doi:10.2147/jir.s440377 · Cited by 7
From the different pathogenesis of epileptogenesis: vitamins as an adjunctive treatment for epilepsy
Sun, W., Wang, Y., Xiao, B., & Luo, Z. (2025) · Acta Epileptologica · doi:10.1186/s42494-025-00228-0 · Cited by 7
Comparative profiling of immune genes improves the prognoses of lower grade gliomas
Wang, Z., Cheng, W., Zhao, Z., Wang, Z., Zhang, C., Li, G., Wu, A., & Jiang, T. (2021) · Cancer Biology and Medicine · doi:10.20892/j.issn.2095-3941.2021.0173 · Cited by 7
Wang, Y., Yang, X., Li, S., Wu, Q., Guo, H., Wang, H., Su, P., & Wang, J. (2023) · Poultry Science · doi:10.1016/j.psj.2023.102814 · Cited by 7
Zhang, Y., Zhao, Y., Wang, Y., Li, J., Huang, Y., Lyu, F., Wang, Y., Wei, P., Yuan, Y., Fu, Y., et al. (2023) · Journal of Cerebral Blood Flow & Metabolism · doi:10.1177/0271678x231197173 · Cited by 7
Phenotypic Differences in Primary Murine Microglia Treated with NOD1, NOD2, and NOD1/2 Agonists
Wasmuth, S., Jalilvand, T. V., Laffer, B., Busch, M., Bauer, D., Langmann, T., Thanos, S., Kasper, M., & Heiligenhaus, A. (2020) · Journal of Molecular Neuroscience · doi:10.1007/s12031-019-01466-x · Cited by 8
Self-citationPossible involvement of microglial P2RY12 and peripheral IL-10 in postpartum depression
Kim, H.-J., You, M., Sung, S., Rim, C., & Kwon, M. (2023) · Frontiers in Cellular Neuroscience · doi:10.3389/fncel.2023.1162966 · Cited by 7
Ikutame, D., Urata, K., Oto, T., Fujiwara, S., Iinuma, T., Shibuta, I., Hayashi, Y., Hitomi, S., Iwata, K., & Shinoda, M. (2020) · International Journal of Molecular Sciences · doi:10.3390/ijms21217871 · Cited by 7
Çelik, Z. B., & Günaydın, C. (2022) · Cureus · doi:10.7759/cureus.32428 · Cited by 6
α-Gal Nanoparticles in CNS Trauma: I. In Vitro Activation of Microglia Towards a Pro-Healing State
Gopalakrishnan, B., Galili, U., Dunbar, A., Solorio, L., Shi, R., & Li, J. (2023) · Tissue Engineering and Regenerative Medicine · doi:10.1007/s13770-023-00613-1 · Cited by 6
Regulatory T cells in stroke inflammation: Therapeutic perspectives
Sun, Z., Zhou, H., Wang, Y., & Li, Z. (2025) · Neural Regeneration Research · doi:10.4103/nrr.nrr-d-24-01424 · Cited by 6
Wegener, A. J., Hyer, M. M., Targett, I. L., Kloster, A., Shaw, G. A., Rodriguez, A. M. M., Dyer, S. K., & Neigh, G. N. (2024) · Stress · doi:10.1080/10253890.2023.2299971 · Cited by 6
Nakisli, S., Fanelli, K., LaComb, J., Arnold, L. J., & Nielsen, C. M. (2025) · Scientific Reports · doi:10.1038/s41598-025-86150-4 · Cited by 4
Harnessing the innate immune system for glioblastoma therapeutics
McLean, H., Drill, M., Sequeira, R. P., Jayakrishnan, P. C., Jeffree, R. L., Hunn, M., O'Brien, T. J., Hamilton, J., & Monif, M. (2025) · Journal of Neuroimmunology · doi:10.1016/j.jneuroim.2025.578713 · Cited by 3
Quipildor, G. F., Belfiore, R., Althobaiti, K., Najarzadeh, Z., Glabe, C. C., Readhead, B. P., Gandy, S., Salton, S. R., & Ehrlich, M. E. (2026) · Molecular Neurodegeneration Advances · doi:10.1186/s44477-025-00012-x · Cited by 6
Li, X., Gao, L., Li, C., Wang, B., & Che, Y. (2024) · Discovery Medicine · doi:10.24976/discov.med.202436184.87 · Cited by 3
Lu, H., Cai, Q., Li, L., Gu, J., Zhang, Y., Sun, H., Su, H., & Song, L. (2024) · Journal of Cellular and Molecular Medicine · doi:10.1111/jcmm.70228 · Cited by 3
Zelada, D., Saldivia, N., Samano, S., George, D., Chaudhari, K., Nguyen, D. A., Simchuk, D., van Breemen, R. B., & Givogri, M. I. (2025) · International Journal of Nanomedicine · doi:10.2147/ijn.s523938 · Cited by 3
A novel hybrid protein promotes Aβ clearance and reduces inflammatory response through MerTKPreprint
Samentar, L., Salazar, A., Pan, P., Etebar, K., Choy, K., Uddin, D., Eliseeff, P., Bugayong, A. M., Garrido, J. A. M. G., Emini, A., et al. (2021) · bioRxiv (Cold Spring Harbor Laboratory) · doi:10.1101/2021.11.03.467048 · Cited by 2
Kim, M. E., & Lee, J. S. (2026) · Biomedicines · doi:10.3390/biomedicines14040826 · Cited by 2
van Deijk, W. A., Blom, P. S., & van der Vijver, J. C. M. (1979) · PubMed · Cited by 2
Lack of cortistatin drives neuroimmune and vascular dysfunction in brain ischemiaPreprint
Castillo-González, J., Vargas-Rodríguez, P., Serrano-Martínez, I., Cuenca-Martagón, A., Forte-Lago, I., Price, M., Buscemi, L., Hirt, L., Ruiz, J. L., & González-Rey, E. (2024) · bioRxiv (Cold Spring Harbor Laboratory) · doi:10.1101/2024.09.11.611691 · Cited by 2
“Armed in-vitro retina”-generating microglial retinal organoids, where are we now?
Liu, Y., Gao, L., Chen, W., Yan, Y., Ye, Z., & Li, Z. (2025) · Frontiers in Cell and Developmental Biology · doi:10.3389/fcell.2025.1574283 · Cited by 2
Adrenergic signaling during parasitic infections
Gardias, P., & Bąska, P. (2026) · Frontiers in Immunology · doi:10.3389/fimmu.2025.1691005 · Cited by 1
Ravula, H., Yadav-Samudrala, B. J., Sawaqed, L. E., Arciniega, C., Hu, W., Jiang, W., & Fitting, S. (2026) · Brain Behavior and Immunity · doi:10.1016/j.bbi.2026.106476 · Cited by 1
Huang, Z., Lin, B., Li, C., Huang, X., Zhu, L., Xu, Y., & Yang, C. (2026) · Behavioural Brain Research · doi:10.1016/j.bbr.2026.116144 · Cited by 2
Adverse interactions of plastic nanoparticles with cultured primary microglial cells
Adamiak, K., & Strużyńska, L. (2026) · Toxicology · doi:10.1016/j.tox.2026.154527 · Cited by 1
Lack of cortistatin drives neuroimmune and vascular dysfunction in brain ischemia
Castillo-González, J., Vargas-Rodríguez, P., Serrano-Martínez, I., Cuenca-Martagón, A., Forte‐Lago, I., Price, M., Buscemi, L., Hirt, L., Ruiz, J. L., & González‐Rey, E. (2026) · Journal of Biomedical Science · doi:10.1186/s12929-026-01271-w · Cited by 3
Platelet-Rich Plasma Modulates Neuroinflammation in an iPSC Model of Sensory Neurons and Microglia
Mercader-Ruiz, J., Marijuán-Pinel, D., Delgado, D., Aguirre, D. L., Sansinanea, X., Guadilla, J., & Sánchez, M. (2026) · International Journal of Molecular Sciences · doi:10.3390/ijms27167127 · Cited by 1
Microglia regulate cognition and stress-related cognitive disorders
Zhou, M., Salinas, S., Cornell, J. L., & Bui, A. (2023) · Elsevier eBooks · doi:10.1016/b978-0-12-817558-3.00014-7 · Cited by 1
Microglia and Neuroinflammation
Mondal, H., & Mondal, S. (2023) · Advances in bioinformatics and biomedical engineering book series · doi:10.4018/978-1-6684-9675-6.ch006 · Cited by 1
Inagawa, H., Oda, M., Tjhin, V. T., Kohchi, C., & Soma, G. (2024) · In Vivo · doi:10.21873/invivo.13682 · Cited by 1
Viral vector-mediated interleukin 10 for gene therapy on chronic pain
Kanao-Kanda, M., Kanda, H., Liu, S., Kawamata, T., Candiotti, K. A., & Hao, S. (2025) · Molecular Pain · doi:10.1177/17448069251390266 · Cited by 1
Solomon, S., Sampathkumar, N. K., Carre, I., Mondal, M., Chennell, G., Vernon, A. C., Ruepp, M., & Mitchell, J. C. (2022) · Research Square · doi:10.21203/rs.3.rs-1420006/v2 · Cited by 1
Metadata
- Authors
- Laffer, B., Bauer, D., Wasmuth, S., Busch, M., Jalilvand, T. V., Thanos, S., Meyer zu Hörste, G., Loser, K., Langmann, T., Heiligenhaus, A., & Kasper, M.
- Affiliations
- St. Franziskus Hospital (DE)
- University of Münster (DE)
- University of Cologne (DE)
- Corresponding author
- Kasper, Maren
- ORCID
- Venue
- Frontiers in Cellular Neuroscience
- Publisher
- Frontiers Media SA
- Published
- 2019-10-09
- Volume
- 13
- Pages
- 430-430
- ISSN
- 1662-5102 (ISSN-L)
- PMC
- PMC6794388
- OpenAlex
- W2979963107
- Cited by
- 120
- References
- 115
- Citations by year
- 2026: 21 · 2025: 16 · 2024: 14 · 2023: 16 · 2022: 16 · 2021: 20 · 2020: 16
- FWCI
- 5.72
- Type
- journal article
- Language
- en
- Open access
- gold
- doi.org
- Licence
- Locations
- Frontiers in Cellular Neuroscience (publishedVersion, cc-by)
- Europe PMC (PubMed Central) (publishedVersion, cc-by)
- PubMed Central (publishedVersion, cc-by)
- PubMed (publishedVersion)
- Kölner Universitäts PublikationsServer (Universität zu Köln) (publishedVersion)
- DOAJ (DOAJ: Directory of Open Access Journals) (submittedVersion, cc-by-sa)
- Funders
- Deutsche Forschungsgemeinschaft
- Topics
- Life Sciences › Neuroscience › Neurology › Neuroinflammation and Neurodegeneration Mechanisms
- Life Sciences › Immunology and Microbiology › Immunology › Immune cells in cancer
- Life Sciences › Biochemistry, Genetics and Molecular Biology › Molecular Biology › Inflammasome and immune disorders
- Keywords
- IL-10, microglia, M1 macrophage phenotype, M2 phenotype, microglial polarization, lipopolysaccharide, IL-10 deficiency, CD86, CD206, inflammatory cytokines, TNF-α, interleukin-6, TGF-β1, chemokines, neuroinflammation
About these checks
Registry, retraction, Cites and statistics results are computed, not judged, with one exception: a printed reference that no index lists is read once by a model before it counts as a citation error. Claims are extracted by a model and kept only when their quote appears verbatim in the text; each cited source is then checked, with a model’s help, for whether it says what the claim relies on. Those verdicts can be wrong — read the claim’s quote and the cited source before relying on one.
Statistics and arithmetic are recomputed, not judged.
Confidence bands are shown only for fields calibrated on our annotated test set. None is calibrated yet, so no band is shown.
What counts as a claim ›How we measure confidence ›How we check this ›
Are you an author, or do you see a problem with this page? Request a review
