

The DOI matches its Crossref record; 164 of the 165 references it cites were found in a registry or an index.
On the relationship between anxiety and error monitoring: a meta-analysis and conceptual framework
Open accessAbstract
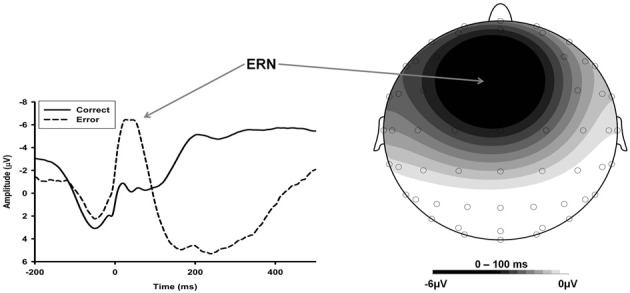
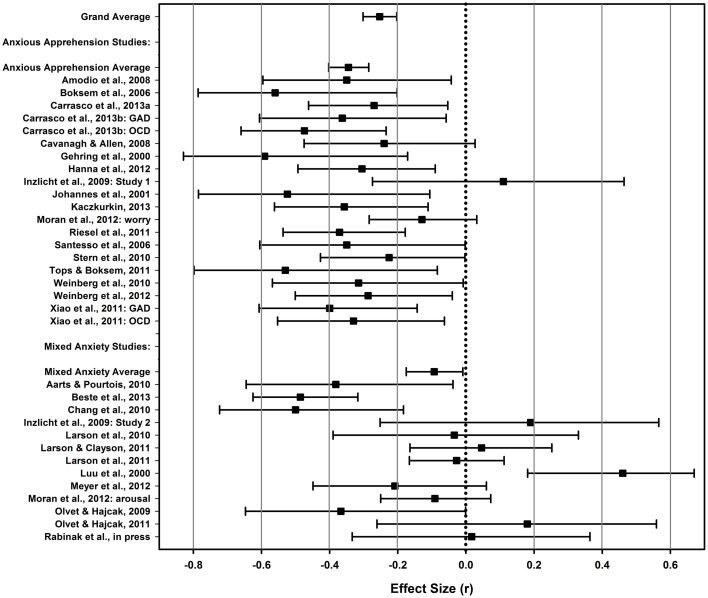
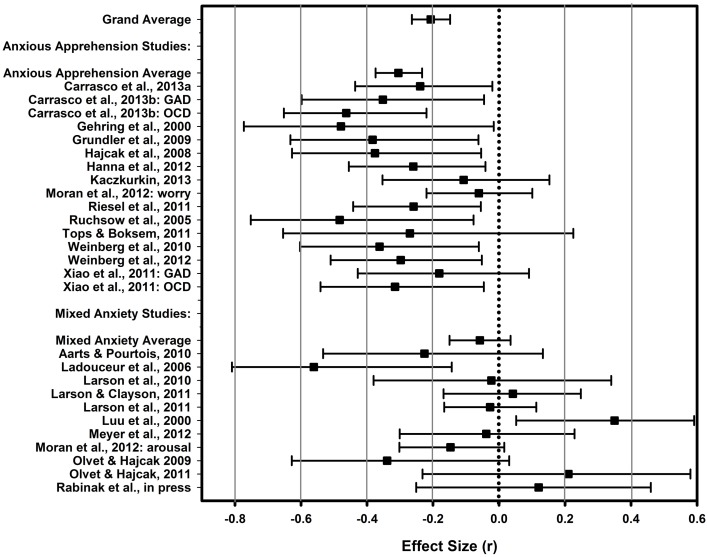
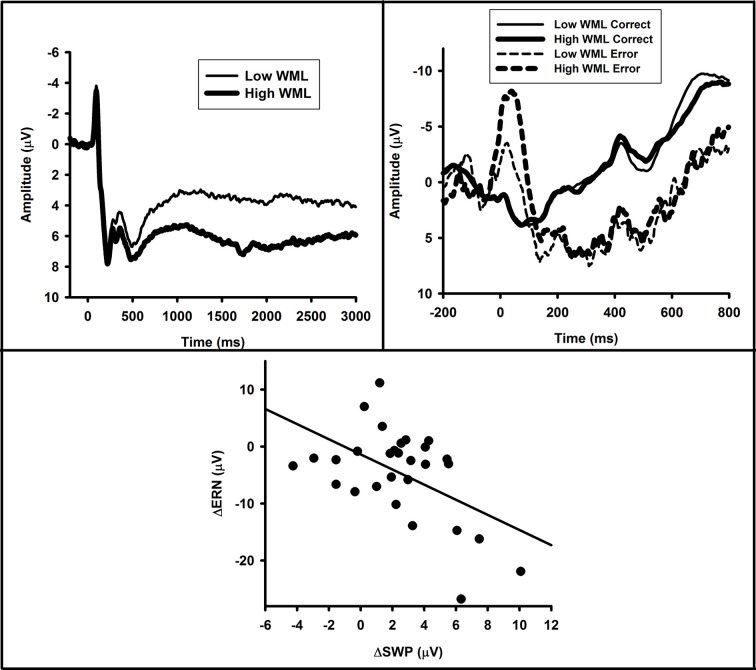
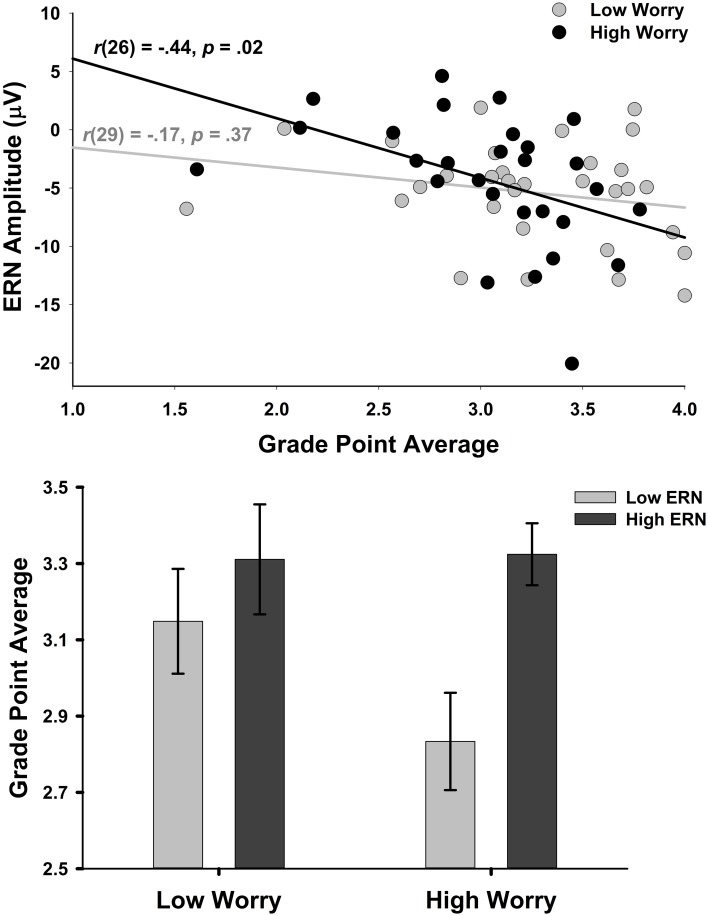
Research involving event-related brain potentials has revealed that anxiety is associated with enhanced error monitoring, as reflected in increased amplitude of the error-related negativity (ERN). The nature of the relationship between anxiety and error monitoring is unclear, however. Through meta-analysis and a critical review of the literature, we argue that anxious apprehension/worry is the dimension of anxiety most closely associated with error monitoring. Although, overall, anxiety demonstrated a robust, "small-to-medium" relationship with enhanced ERN (r = -0.25), studies employing measures of anxious apprehension show a threefold greater effect size estimate (r = -0.35) than those utilizing other measures of anxiety (r = -0.09). Our conceptual framework helps explain this more specific relationship between anxiety and enhanced ERN and delineates the unique roles of worry, conflict processing, and modes of cognitive control. Collectively, our analysis suggests that enhanced ERN in anxiety results from the interplay of a decrease in processes supporting active goal maintenance and a compensatory increase in processes dedicated to transient reactivation of task goals on an as-needed basis when salient events (i.e., errors) occur.
Overview
The claims and statistics of this paper haven’t been checked yet.
Run the check — free, no account needed. It reads the open-access text and checks the sources it cites.
Integrity signals
Registry
Cites
Statistics
Figures
Verification
Claims the paper makes
The claims and statistics of this paper haven’t been checked yet.
Run the check — free, no account needed. It reads the open-access text and checks the sources it cites.
Claims other papers make about this one
Each is checked against this paper’s own text: does it say what the citing paper says it does?
The source backs part of the claim, not all of it — or backs it for a different population, condition or comparison.
In the citing paper
“From the perspective of Attentional Control Theory, it is possible that persistent obsessions and severe anxiety in pediatric OCD interfere with the efficient functioning of the goal‐directed attentional system that may not be as well compensated for by an enhanced ERN in youths as in adults (Eysenck et al. 2007; Moser et al. 2013).”
From Reaction Time Variability and Electrophysiological Indices of Performance Monitoring in Youths With Attention-Deficit/Hyperactivity Disorder and Obsessive-Compulsive Disorder (2026) · cites this paper as Moser et al. 2013
Experimental — accuracy not yet measuredThe cited source says what the claim attributes to it.
In the citing paper
“Meta-analytic evidence supports the ERN as a potential biomarker for psychopathology, with anxiety symptoms associated with larger (more negative) amplitudes (Moser et al., 2013) and externalizing symptoms associated with smaller (less negative) amplitudes (Lutz et al., 2021).”
From Foster care intervention protects cognitive control skills in young adults exposed to institutional rearing (2026) · cites this paper as Moser et al., 2013
Self-check
Percentages, sums and reported differences re-computed from the paper’s own numbers.
The self-check needs the paper’s full text.
Citations
Cites
Diagnostic and Statistical Manual of Mental Disorders
Williams, J. B. W., & First, M. B. (2013) · Oxford University Press eBooks · doi:10.1093/acrefore/9780199975839.013.104 · Cited by 109,845
Statistical Power Analysis for the Behavioral Sciences
Muller, K. E., & Cohen, J. (1989) · Technometrics · doi:10.2307/1270020 · Cited by 99,603
Kessler, R. C., Berglund, P., Demler, O., Jin, R., Merikangas, K. R., & Walters, E. E. (2005) · Archives of General Psychiatry · doi:10.1001/archpsyc.62.6.593 · Cited by 20,391
Studies of interference in serial verbal reactions
Stroop, J. R. (1935) · Journal of Experimental Psychology · doi:10.1037/h0054651 · Cited by 18,622
(2010) · Intellectum (Universidad de La Sabana) · doi:10.1111/j.1467- · Cited by 16,131
Conflict monitoring and cognitive control
Botvinick, M. M., Braver, T. S., Barch, D. M., Carter, C. S., & Cohen, J. D. (2001) · Psychological Review · doi:10.1037/0033-295x.108.3.624 · Cited by 7,351
Carver, C. S., & White, T. L. (1994) · Journal of Personality and Social Psychology · doi:10.1037/0022-3514.67.2.319 · Cited by 7,306
Effects of noise letters upon the identification of a target letter in a nonsearch task
Eriksen, B. A., & Eriksen, C. W. (1974) · Perception & Psychophysics · doi:10.3758/bf03203267 · Cited by 7,230
Cognitive and emotional influences in anterior cingulate cortex
Bush, G., Luu, P., & Posner, M. I. (2000) · Trends in Cognitive Sciences · doi:10.1016/s1364-6613(00)01483-2 · Cited by 6,259
(2023) · doi:10.1126/science · Cited by 6,063
Research works printed but not linked: 3
- Barlow D. H. (2002). Anxiety and Its Disorders, 2nd Edn. New York, NY: Guilford Press
- Matthews G. Joyner J. Gililand K. Campbell S. E. Faulconner S. (1999). Validation of a comprehensive stress state questionnaire: towards a state “Big three”? in Handbook of Coping: Theory, Research, and Applications, eds Mervielde I. Deary I. J. De Fruyt F. Ostendorf F. (Tilburg, NL: Tilburg University Press), 333– 350
- Moran T. P. Moser J. S. (2012). Working memory load enhances action monitoring: implications for the study of anxiety, in Poster presented at the 52nd Annual Conference for the Society for Psychophysiological Research, (New Orleans, LA).
Cited by
Sorted by citations
Items 101–200 of 444
Golonka, K., Mojsa‐Kaja, J., Gawłowska, M., & Popiel, K. (2017) · Frontiers in Psychology · doi:10.3389/fpsyg.2017.00676 · Cited by 43
A dimensional investigation of error-related negativity (ERN) and self-reported psychiatric symptoms
Seow, T. X. F., Benoit, E., Dempsey, C., Jennings, M., Maxwell, A., McDonough, M., & Gillan, C. M. (2020) · International Journal of Psychophysiology · doi:10.1016/j.ijpsycho.2020.09.019 · Cited by 43
Marzuki, A. A., Pereira de Souza, A. M. F. L., Sahakian, B. J., & Robbins, T. W. (2020) · Neuroscience & Biobehavioral Reviews · doi:10.1016/j.neubiorev.2019.12.010 · Cited by 39
Error monitoring is related to processing internal affective states
Maier, M. E., Scarpazza, C., Starita, F., Filogamo, R., & Làdavas, E. (2016) · Cognitive Affective & Behavioral Neuroscience · doi:10.3758/s13415-016-0452-1 · Cited by 38
Derakhshan, N. (2020) · Elsevier eBooks · doi:10.1016/b978-0-12-816660-4.00012-x · Cited by 36
Szekely, A., Silton, R. L., Heller, W., Miller, G. A., & Mohanty, A. (2016) · Social Cognitive and Affective Neuroscience · doi:10.1093/scan/nsw137 · Cited by 40
Anxiety increases sensitivity to errors and negative feedback over time
Tobias, M. R., & Ito, T. A. (2021) · Biological Psychology · doi:10.1016/j.biopsycho.2021.108092 · Cited by 40
Troller‐Renfree, S. V., Buzzell, G. A., Pine, D. S., Henderson, H. A., & Fox, N. A. (2019) · Journal of the American Academy of Child & Adolescent Psychiatry · doi:10.1016/j.jaac.2018.06.040 · Cited by 38
Berger, A., Mitschke, V., Dignath, D., Eder, A. B., & van Steenbergen, H. (2020) · Psychophysiology · doi:10.1111/psyp.13524 · Cited by 41
Effects of positive mood on probabilistic learning: Behavioral and electrophysiological correlates
Bakic, J., Jepma, M., Raedt, R. D., & Pourtois, G. (2014) · Biological Psychology · doi:10.1016/j.biopsycho.2014.09.012 · Cited by 41
Psychological pressure and compounded errors during elite-level tennis
Harris, D., Vine, S. J., Eysenck, M. W., & Wilson, M. (2021) · Psychology of sport and exercise · doi:10.1016/j.psychsport.2021.101987 · Cited by 35
Social influences of error monitoring in adolescent girls
Barker, T. V., Troller‐Renfree, S. V., Bowman, L. C., Pine, D. S., & Fox, N. A. (2018) · Psychophysiology · doi:10.1111/psyp.13089 · Cited by 37
Arbitrary Rituals Mute the Neural Response to Performance Failure
Hobson, N. M., Bonk, D., & Inzlicht, M. (2016) · PeerJ · doi:10.7717/peerj.3363 · Cited by 37
Ip, K. I., Liu, Y., Moser, J. S., Mannella, K. A., Hruschak, J. L., Bilek, E. L., Muzik, M., Rosenblum, K. L., & Fitzgerald, K. D. (2019) · Developmental Cognitive Neuroscience · doi:10.1016/j.dcn.2019.100702 · Cited by 33
Self-citationA brief, computerized intervention targeting error sensitivity reduces the error-related negativity
Meyer, A., Gibby, B. A., Wissemann, K., Klawohn, J., Hajcak, G., & Schmidt, N. B. (2019) · Cognitive Affective & Behavioral Neuroscience · doi:10.3758/s13415-019-00760-w · Cited by 40
Meyer, A., Mehra, L. M., & Hajcak, G. (2021) · Journal of Psychiatry and Neuroscience · doi:10.1503/jpn.200128 · Cited by 36
Meyer, A., & Klein, D. N. (2018) · Comprehensive Psychiatry · doi:10.1016/j.comppsych.2018.09.009 · Cited by 36
A systematic review of event‐related potentials as outcome measures of attention bias modification
Carlson, J. M. (2021) · Psychophysiology · doi:10.1111/psyp.13801 · Cited by 34
Meyer, A. (2022) · Psychophysiology · doi:10.1111/psyp.14050 · Cited by 31
Meyer, A., Hajcak, G., Glenn, C. R., Kujawa, A., & Klein, D. N. (2016) · Emotion · doi:10.1037/emo0000243 · Cited by 35
Attention bias modification reduces neural correlates of response monitoring
Nelson, B. D., Jackson, F. L., Amir, N., & Hajcak, G. (2017) · Biological Psychology · doi:10.1016/j.biopsycho.2017.08.059 · Cited by 32
Fairbairn, C. E., Kang, D., & Federmeier, K. D. (2020) · Biological Psychiatry · doi:10.1016/j.biopsych.2020.11.024 · Cited by 34
Keep calm and be patient: The influence of anxiety and time on post-error adaptations
der Borght, L. V., Braem, S., Stevens, M., & Notebaert, W. (2015) · Acta Psychologica · doi:10.1016/j.actpsy.2015.12.007 · Cited by 33
To err is (perfectly) human: behavioural and neural correlates of error processing and perfectionism
Barke, A., Bode, S., Dechent, P., Schmidt‐Samoa, C., Heer, C. V., & Stähl, J. (2017) · Social Cognitive and Affective Neuroscience · doi:10.1093/scan/nsx082 · Cited by 33
Voegler, R., Peterburs, J., Lemke, H., Ocklenburg, S., Liepelt, R., & Straube, T. (2017) · Biological Psychology · doi:10.1016/j.biopsycho.2017.11.003 · Cited by 32
Inhibitory control and emotion dysregulation: A framework for research on anxiety
Cardinale, E. M., Subar, A. R., Brotman, M. A., Leibenluft, E., Kircanski, K., & Pine, D. S. (2019) · Development and Psychopathology · doi:10.1017/s0954579419000300 · Cited by 35
Developmental pathways to social anxiety and irritability: The role of the ERN
Filippi, C. A., Subar, A. R., Sachs, J. F., Kircanski, K., Buzzell, G. A., Pagliaccio, D., Abend, R., Fox, N. A., Leibenluft, E., & Pine, D. S. (2019) · Development and Psychopathology · doi:10.1017/s0954579419001329 · Cited by 34
Rumination is associated with diminished performance monitoring.
Tanovic, E., Hajcak, G., & Sanislow, C. A. (2017) · Emotion · doi:10.1037/emo0000290 · Cited by 31
Early temperamental fearfulness and the developmental trajectory of error‐related brain activity
Meyer, A., Hajcak, G., Torpey, D. C., Kujawa, A., Olino, T. M., Dyson, M. W., & Klein, D. N. (2018) · Developmental Psychobiology · doi:10.1002/dev.21605 · Cited by 30
Beyond single paradigms, pipelines, and outcomes: Embracing multiverse analyses in psychophysiology
Clayson, P. E. (2024) · International Journal of Psychophysiology · doi:10.1016/j.ijpsycho.2024.112311 · Cited by 29
Barker, H., Munro, J., Orlov, N. D., Morgenroth, E., Moser, J. S., Eysenck, M. W., & Allen, P. (2018) · Brain and Behavior · doi:10.1002/brb3.1137 · Cited by 26
Self-citationBotelho, C., Pasion, R., Prata, C., & Barbosa, F. (2022) · Biological Psychology · doi:10.1016/j.biopsycho.2022.108475 · Cited by 29
Demertzis, K. H., & Craske, M. G. (2006) · Springer eBooks · doi:10.1007/978-0-387-28370-8_30 · Cited by 27
Impacts of motivational valence on the error-related negativity elicited by full and partial errors
Maruo, Y., Schacht, A., Sommer, W., & Masaki, H. (2015) · Biological Psychology · doi:10.1016/j.biopsycho.2015.12.004 · Cited by 26
Gorka, S. M., Burkhouse, K. L., Klumpp, H., Kennedy, A. E., Afshar, K., Francis, J., Ajilore, O., Mariouw, S., Craske, M. G., Langenecker, S. A., et al. (2017) · Neuropsychopharmacology · doi:10.1038/npp.2017.289 · Cited by 29
Effects of reward context on feedback processing as indexed by time‐frequency analysis
Watts, A. T. M., & Bernat, E. M. (2018) · Psychophysiology · doi:10.1111/psyp.13195 · Cited by 32
Riesel, A., Kathmann, N., Wuellhorst, V., Banica, I., & Weinberg, A. (2019) · International Journal of Psychophysiology · doi:10.1016/j.ijpsycho.2019.09.014 · Cited by 30
Paul, K., Walentowska, W., Bakic, J., Dondaine, T., & Pourtois, G. (2016) · Cognitive Affective & Behavioral Neuroscience · doi:10.3758/s13415-016-0466-8 · Cited by 31
Banica, I., Sandre, A., & Weinberg, A. (2019) · International Journal of Psychophysiology · doi:10.1016/j.ijpsycho.2018.12.013 · Cited by 33
Meyer, A., & Wissemann, K. (2020) · Social Cognitive and Affective Neuroscience · doi:10.1093/scan/nsaa018 · Cited by 31
A Diagnostic Biomarker for Pediatric Generalized Anxiety Disorder Using the Error-Related Negativity
Hanna, G. L., Liu, Y., Rough, H. E., Surapaneni, M., Hanna, B. S., Arnold, P. D., & Gehring, W. J. (2020) · Child Psychiatry & Human Development · doi:10.1007/s10578-020-01021-5 · Cited by 24
Trait anxiety modulates the temporal dynamics of Stroop task switching: An ERP study
Wu, Y.-F. B., Ma, S., He, X., Xiang, S., & Qi, S. (2021) · Biological Psychology · doi:10.1016/j.biopsycho.2021.108144 · Cited by 25
Clayson, P. E., Rocha, H. A., Baldwin, S. A., Rast, P., & Larson, M. J. (2021) · Biological Psychiatry Cognitive Neuroscience and Neuroimaging · doi:10.1016/j.bpsc.2021.10.016 · Cited by 26
Saunders, B., Milyavskaya, M., & Inzlicht, M. (2022) · Nature Communications · doi:10.1038/s41467-022-30786-7 · Cited by 28
Moser, J. S., Moran, T. P., Schroder, H. S., Donnellan, M. B., & Yeung, N. (2014) · Frontiers in Human Neuroscience · doi:10.3389/fnhum.2014.00064 · Cited by 27
Self-citationElectrocortical Evidence of Enhanced Performance Monitoring in Social Anxiety
Judah, M. R., Grant, D. M., Frosio, K. E., White, E. J., Taylor, D. L., & Mills, A. C. (2015) · Behavior Therapy · doi:10.1016/j.beth.2015.12.002 · Cited by 24
Lo, S. L., Schroder, H. S., Fisher, M. E., Durbin, C. E., Fitzgerald, K. D., Danovitch, J. H., & Moser, J. S. (2016) · Research on Child and Adolescent Psychopathology · doi:10.1007/s10802-016-0247-4 · Cited by 27
Self-citationOlson, R. L., Brush, C. J., Ehmann, P. J., Buckman, J. F., & Alderman, B. L. (2018) · International Journal of Psychophysiology · doi:10.1016/j.ijpsycho.2018.01.006 · Cited by 25
Jenkins, L. M., Stange, J. P., Bessette, K. L., Chang, Y.-S., Corwin, S. D., Skerrett, K. A., Patrón, V. G., Zubieta, J., Crane, N. A., Passarotti, A. M., et al. (2018) · Journal of Affective Disorders · doi:10.1016/j.jad.2018.07.082 · Cited by 24
Mathematics Anxiety and Metacognitive Processes
Morsanyi, K., Cheallaigh, N. N., & Ackerman, R. (2019) · Psihologijske teme · doi:10.31820/pt.28.1.8 · Cited by 26
Banica, I., Sandre, A., Shields, G. S., Slavich, G. M., & Weinberg, A. (2021) · Cognitive Affective & Behavioral Neuroscience · doi:10.3758/s13415-021-00883-z · Cited by 31
Meyer, A., Bress, J. N., Hajcak, G., & Gibb, B. E. (2016) · Journal of Clinical Child & Adolescent Psychology · doi:10.1080/15374416.2016.1138405 · Cited by 25
Osinsky, R., Karl, C., & Hewig, J. S. (2016) · Journal of Personality · doi:10.1111/jopy.12241 · Cited by 26
Moser, J. S., Fisher, M. E., Hicks, B. M., Zucker, R. A., & Durbin, C. E. (2018) · International Journal of Psychophysiology · doi:10.1016/j.ijpsycho.2018.08.015 · Cited by 25
Self-citationFajkowska, M., Domaradzka, E., & Wytykowska, A. (2018) · Frontiers in Psychology · doi:10.3389/fpsyg.2017.02376 · Cited by 31
Error-related neural activity and alcohol use disorder: Differences from risk to remission
Gorka, S. M., Lieberman, L., Kreutzer, K. A., Carrillo, V. L., Weinberg, A., & Shankman, S. A. (2019) · Progress in Neuro-Psychopharmacology and Biological Psychiatry · doi:10.1016/j.pnpbp.2019.01.011 · Cited by 24
Lin, Y., Eckerle, W. D., Peng, L. W., & Moser, J. S. (2019) · Brain Sciences · doi:10.3390/brainsci9090226 · Cited by 25
Self-citationMonroe, D. C., Blumenfeld, R. S., Keator, D. B., Solodkin, A., & Small, S. L. (2020) · NeuroImage · doi:10.1016/j.neuroimage.2020.117306 · Cited by 24
Meyer, A., Carlton, C. N., Crisler, S., & Kallen, A. M. (2018) · Biological Psychology · doi:10.1016/j.biopsycho.2018.09.003 · Cited by 24
Performance Monitoring and Correct Response Significance in Conscientious Individuals
Imhof, M. F., & Rüsseler, J. (2019) · Frontiers in Human Neuroscience · doi:10.3389/fnhum.2019.00239 · Cited by 21
Lin, Y., Moran, T. P., Schroder, H. S., & Moser, J. S. (2015) · Psychophysiology · doi:10.1111/psyp.12470 · Cited by 21
Self-citationCofresí, R. U., Piasecki, T. M., Hajcak, G., & Bartholow, B. D. (2021) · Psychophysiology · doi:10.1111/psyp.13967 · Cited by 23
Frontal Midline Theta as a Model Specimen of Cortical Theta
Cavanagh, J. F., & Cohen, M. X. (2022) · Oxford University Press eBooks · doi:10.1093/oxfordhb/9780192898340.013.9 · Cited by 26
Electrophysiological correlates of oxytocin-induced enhancement of social performance monitoring
de Bruijn, E. R. A., Ruissen, M. I., & Radke, S. (2017) · Social Cognitive and Affective Neuroscience · doi:10.1093/scan/nsx094 · Cited by 21
Error-related brain activity and internalizing disorder symptom dimensions in depression and anxiety
Gorka, S. M., Burkhouse, K. L., Afshar, K., & Phan, K. L. (2017) · Depression and Anxiety · doi:10.1002/da.22648 · Cited by 22
Development of Posterior Medial Frontal Cortex Function in Pediatric Obsessive-Compulsive Disorder
Fitzgerald, K. D., Liu, Y., Johnson, T. D., Moser, J. S., Marsh, R., Hanna, G. L., & Taylor, S. F. (2018) · Journal of the American Academy of Child & Adolescent Psychiatry · doi:10.1016/j.jaac.2018.02.016 · Cited by 22
Self-citationHitokoto, H., Glazer, J. E., & Kitayama, S. (2015) · Psychophysiology · doi:10.1111/psyp.12554 · Cited by 21
Suzuki, T., Gu, P., Grove, T. B., Hammond, T., Collins, K. M., Pamidighantam, P., Arnold, P. D., Taylor, S. F., Liu, Y., Gehring, W. J., et al. (2023) · Biological Psychiatry · doi:10.1016/j.biopsych.2022.10.020 · Cited by 20
Liu, Y., Hanna, G. L., Hanna, B. S., Rough, H. E., Arnold, P. D., & Gehring, W. J. (2020) · Brain Sciences · doi:10.3390/brainsci10020079 · Cited by 22
Четвериков, А. А., Jóhannesson, Ó. I., & Kristjansson, A. K. (2014) · Cognition & Emotion · doi:10.1080/02699931.2014.968097 · Cited by 22
Post-error slowing in anxiety and obsessive-compulsive disorders
Rueppel, M., Mannella, K. A., Fitzgerald, K. D., & Schroder, H. S. (2021) · Cognitive Affective & Behavioral Neuroscience · doi:10.3758/s13415-021-00976-9 · Cited by 20
Self-citationError-processing abnormalities in pediatric anxiety and obsessive compulsive disorders
Fitzgerald, K. D., & Taylor, S. F. (2015) · CNS Spectrums · doi:10.1017/s1092852915000036 · Cited by 20
Gorday, J. Y., & Meyer, A. (2018) · Developmental Psychobiology · doi:10.1002/dev.21625 · Cited by 22
Muir, A. M., Hedges‐Muncy, A., Clawson, A., Carbine, K. A., & Larson, M. J. (2020) · Psychophysiology · doi:10.1111/psyp.13595 · Cited by 19
Wu, J., Liu, Y., Fang, H., Qin, S., Kohn, N., & Duan, H. (2021) · Social Cognitive and Affective Neuroscience · doi:10.1093/scan/nsab041 · Cited by 23
Strand, N., Fang, L., & Carlson, J. M. (2021) · Frontiers in Human Neuroscience · doi:10.3389/fnhum.2021.627589 · Cited by 21
Leue, A., Weber, B., & Beauducel, A. (2014) · Frontiers in Human Neuroscience · doi:10.3389/fnhum.2014.00210 · Cited by 20
Amir, N., Kuckertz, J. M., & Strege, M. V. (2016) · Cognitive Therapy and Research · doi:10.1007/s10608-016-9781-1 · Cited by 19
Bellon, E., Fias, W., & Smedt, B. D. (2021) · Journal of Educational Psychology · doi:10.1037/edu0000704 · Cited by 22
Paul, K., Short, C. A., Beauducel, A., Carsten, H. P., Härpfer, K., Hennig, J., Hewig, J. S., Hildebrandt, A., Kührt, C., Mueller, E. M., et al. (2022) · Personality Science · doi:10.5964/ps.7177 · Cited by 19
Lo, S. L., Schroder, H. S., Moran, T. P., Durbin, C. E., & Moser, J. S. (2015) · Developmental Cognitive Neuroscience · doi:10.1016/j.dcn.2015.09.001 · Cited by 19
Self-citationCognitive Control Processes Underlying Individual Differences in Self-Control
Wilkowski, B. M., & Robinson, M. D. (2016) · Elsevier eBooks · doi:10.1016/b978-0-12-801850-7.00015-9 · Cited by 21
Open science in human electrophysiology
Clayson, P. E., Keil, A., & Larson, M. J. (2022) · International Journal of Psychophysiology · doi:10.1016/j.ijpsycho.2022.02.002 · Cited by 19
Riesel, A., Härpfer, K., Thoma, L., Kathmann, N., & Klawohn, J. (2023) · Psychophysiology · doi:10.1111/psyp.14164 · Cited by 15
Cardinale, E. M., Bezek, J. L., Morales, S., Filippi, C. A., Smith, A. R., Haller, S. P., Valadez, E. A., Harrewijn, A., Phillips, D. A., Chronis-Tuscano, A. M., et al. (2022) · Biological Psychiatry Cognitive Neuroscience and Neuroimaging · doi:10.1016/j.bpsc.2022.03.007 · Cited by 18
Micoulaud‐Franchi, J., Batail, J.-M. V., Fovet, T., Philip, P., Cermolacce, M., Jaumard‐Hakoun, A., & Vialatte, F. (2019) · Applied Psychophysiology and Biofeedback · doi:10.1007/s10484-019-09440-4 · Cited by 24
Were we erring? The impact of worry and arousal on error‐related negativity in a non‐clinical sample
Härpfer, K., Carsten, H. P., Spychalski, D., Kathmann, N., & Riesel, A. (2020) · Psychophysiology · doi:10.1111/psyp.13661 · Cited by 17
Arnett, A. B., Rhoads, C. L., & Rutter, T. M. (2021) · Journal of the International Neuropsychological Society · doi:10.1017/s1355617721001065 · Cited by 19
Negative affect related traits and the chasm between self-report and neuroscience
Brandt, A., & Mueller, E. M. (2021) · Current Opinion in Behavioral Sciences · doi:10.1016/j.cobeha.2021.11.002 · Cited by 18
Amir, N., Holbrook, A., Kallen, A. M., Santopetro, N. J., Klawohn, J., McGhie, S. F., Bruchnak, A., Lowe, M. E., Taboas, W., Brush, C. J., et al. (2023) · Clinical Psychological Science · doi:10.1177/21677026231170563 · Cited by 17
Chapman, B., Louis, C. C., Moser, J. S., Grunfeld, E. A., & Derakshan, N. (2023) · Psycho-Oncology · doi:10.1002/pon.6232 · Cited by 17
Self-citationGilbertson, H., Lin, F., Andrzejewski, J. A., & Carlson, J. M. (2021) · Psychophysiology · doi:10.1111/psyp.13794 · Cited by 19
Working memory load impairs the evaluation of behavioral errors in the medial frontal cortex
Maier, M. E., & Steinhauser, M. (2017) · Psychophysiology · doi:10.1111/psyp.12899 · Cited by 19
Bailey, N. W., Hoy, K. E., Maller, J. J., Upton, D. J., Segrave, R. A., Fitzgibbon, B. M., & Fitzgerald, P. B. (2015) · Biological Psychology · doi:10.1016/j.biopsycho.2015.01.011 · Cited by 15
Kar, B. R., Srinivasan, N., Nehabala, Y., & Nigam, R. (2017) · Cognition & Emotion · doi:10.1080/02699931.2017.1304897 · Cited by 16
Economic threat heightens conflict detection: sLORETA evidence
Nash, K. A., Tran, A., Leota, J., & Scott, A. (2020) · Social Cognitive and Affective Neuroscience · doi:10.1093/scan/nsaa139 · Cited by 16
Hsieh, M.-T., Lu, H., Lin, C.-I., Sun, T.-H., Chen, Y.-R., & Cheng, C. (2021) · Frontiers in Human Neuroscience · doi:10.3389/fnhum.2021.650838 · Cited by 16
When errors count: an EEG study on numerical error monitoring under performance pressure
Schillinger, F. L., Smedt, B. D., & Grabner, R. H. (2015) · ZDM · doi:10.1007/s11858-015-0746-8 · Cited by 17
Hoogeveen, S., Schjoedt, U., & van Elk, M. (2018) · Journal of Cognitive Neuroscience · doi:10.1162/jocn_a_01297 · Cited by 17
Wu, J., Feng, M., Liu, Y., Fang, H., & Duan, H. (2019) · Scientific Reports · doi:10.1038/s41598-019-48179-0 · Cited by 22
Metadata
- Authors
- Moser, J. S., Moran, T. P., Schroder, H. S., Donnellan, M. B., & Yeung, N.
- Affiliations
- Michigan State University (US)
- University of Oxford (GB)
- Corresponding author
- Moser, Jason S.
- Venue
- Frontiers in Human Neuroscience
- Publisher
- Frontiers Media SA
- Published
- 2013
- Volume
- 7
- Pages
- 466-466
- ISSN
- 1662-5161 (ISSN-L)
- PMC
- PMC3744033
- OpenAlex
- W2008540085
- Cited by
- 445
- References
- 165
- Citations by year
- 2026: 31 · 2025: 24 · 2024: 33 · 2023: 26 · 2022: 45 · 2021: 45 · 2020: 31 · 2019: 33 · 2018: 35 · 2017: 48 · 2016: 33 · 2015: 32 · 2014: 24 · 2013: 1
- FWCI
- 2.55
- Type
- journal article
- Language
- en
- Open access
- gold
- doi.org
- Licence
- cc-by
- Locations
- Frontiers in Human Neuroscience (publishedVersion, cc-by)
- Europe PMC (PubMed Central) (publishedVersion, cc-by)
- PubMed Central (publishedVersion, cc-by)
- PubMed (publishedVersion)
- DOAJ (DOAJ: Directory of Open Access Journals) (submittedVersion, cc-by-sa)
- Topics
- Life Sciences › Neuroscience › Cognitive Neuroscience › Neural and Behavioral Psychology Studies
- Social Sciences › Psychology › Experimental and Cognitive Psychology › Anxiety, Depression, Psychometrics, Treatment, Cognitive Processes
- Life Sciences › Neuroscience › Cognitive Neuroscience › Neurobiology of Language and Bilingualism
- Keywords
- anxiety, error monitoring, error-related negativity, event-related potentials, anxious apprehension, worry, conflict processing, cognitive control, goal maintenance
About these checks
Registry, retraction, Cites and statistics results are computed, not judged, with one exception: a printed reference that no index lists is read once by a model before it counts as a citation error. Claims are extracted by a model and kept only when their quote appears verbatim in the text; each cited source is then checked, with a model’s help, for whether it says what the claim relies on. Those verdicts can be wrong — read the claim’s quote and the cited source before relying on one.
Statistics and arithmetic are recomputed, not judged.
Confidence bands are shown only for fields calibrated on our annotated test set. None is calibrated yet, so no band is shown.
What counts as a claim ›How we measure confidence ›How we check this ›
Are you an author, or do you see a problem with this page? Request a review
