

The DOI matches its Crossref record; 73 of the 73 references it cites were found in a registry or an index.
Predicting individual brain maturity using dynamic functional connectivity
Open accessAbstract
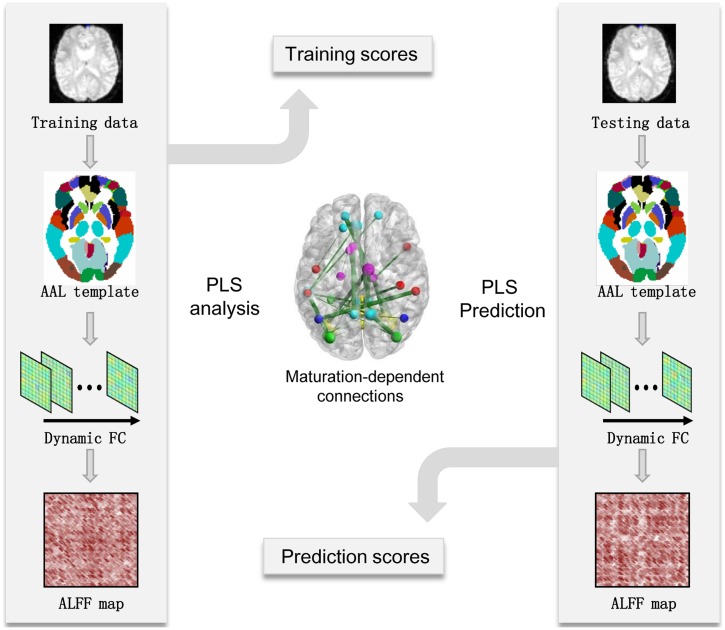
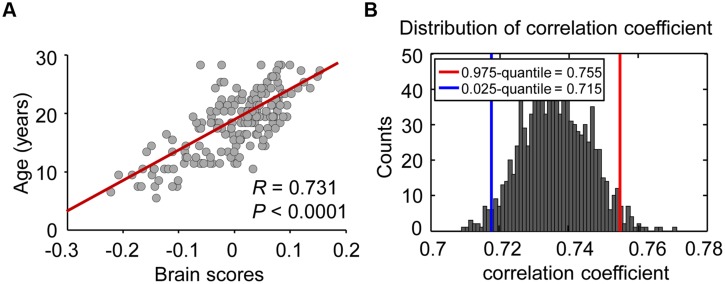
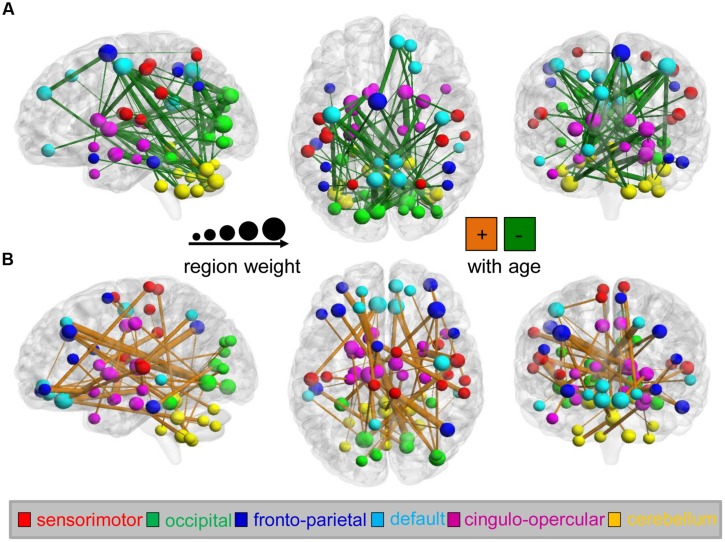
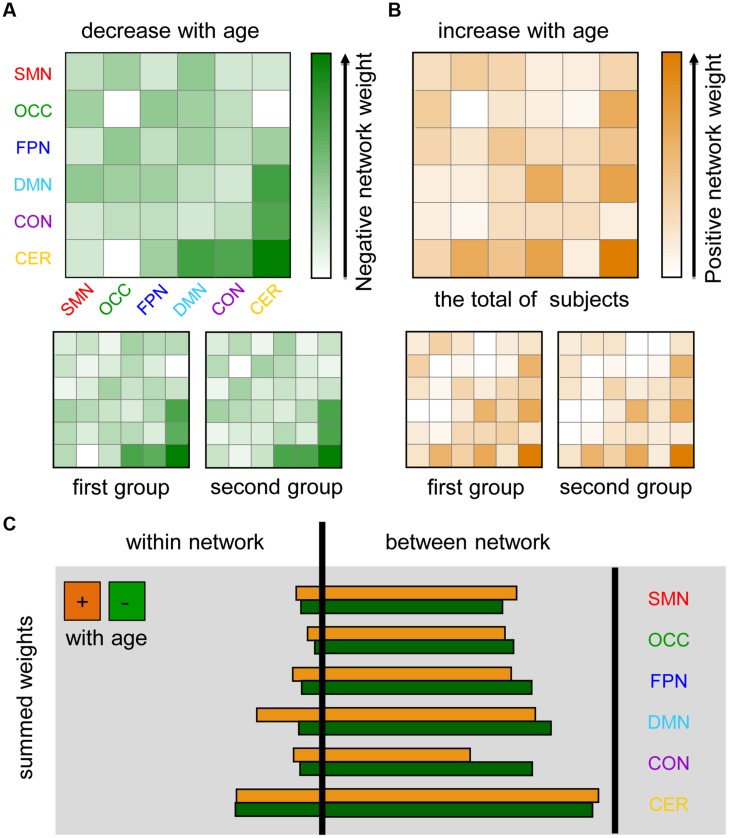
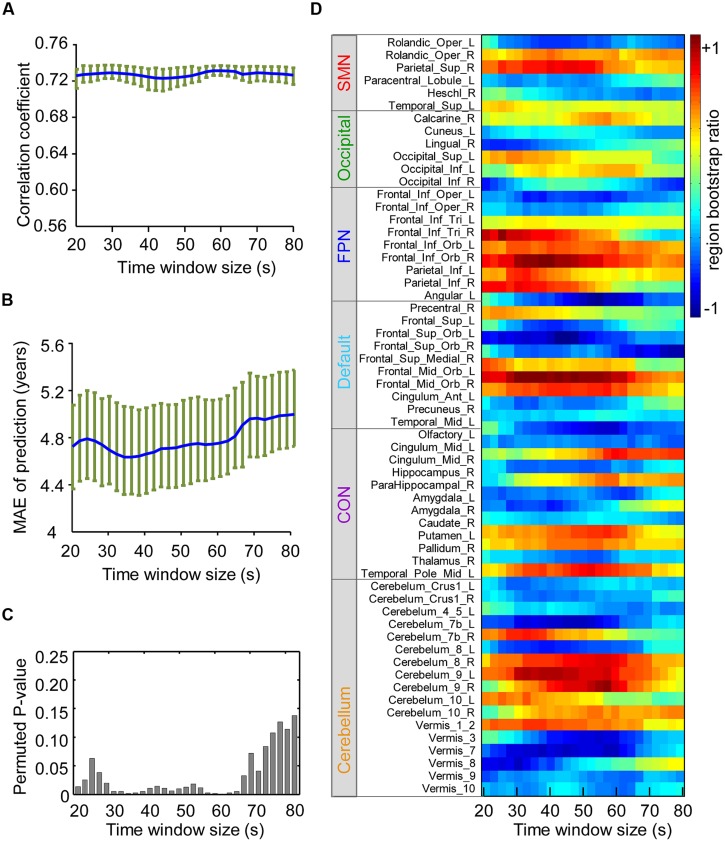
Neuroimaging-based functional connectivity (FC) analyses have revealed significant developmental trends in specific intrinsic connectivity networks linked to cognitive and behavioral maturation. However, knowledge of how brain functional maturation is associated with FC dynamics at rest is limited. Here, we examined age-related differences in the temporal variability of FC dynamics with data publicly released by the Nathan Kline Institute (NKI; n = 183, ages 7-30) and showed that dynamic inter-region interactions can be used to accurately predict individual brain maturity across development. Furthermore, we identified a significant age-dependent trend underlying dynamic inter-network FC, including increasing variability of the connections between the visual network, default mode network (DMN) and cerebellum as well as within the cerebellum and DMN and decreasing variability within the cerebellum and between the cerebellum and DMN as well as the cingulo-opercular network. Overall, the results suggested significant developmental changes in dynamic inter-network interaction, which may shed new light on the functional organization of typical developmental brains.
Overview
The claims and statistics of this paper haven’t been checked yet.
Run the check — free, no account needed. It reads the open-access text and checks the sources it cites.
Integrity signals
Registry
Cites
Statistics
Figures
Verification
Claims the paper makes
The claims and statistics of this paper haven’t been checked yet.
Run the check — free, no account needed. It reads the open-access text and checks the sources it cites.
Claims other papers make about this one
Each is checked against this paper’s own text: does it say what the citing paper says it does?
In the citing paper
“Over development, rs-fcMRI networks show increased within-subject variability (Hutchison and Morton, 2015; Marusak et al., 2016; Qin et al., 2015), consistent with EEG studies showing that signal complexity increases over development (McIntosh et al., 2008; Vakorin et al., 2011).”
From Development of large-scale functional networks from birth to adulthood: A guide to the neuroimaging literature (2017) · cites this paper as Qin et al., 2015
Self-check
Percentages, sums and reported differences re-computed from the paper’s own numbers.
The self-check needs the paper’s full text.
Citations
Cites
The organization of the human cerebellum estimated by intrinsic functional connectivity
Buckner, R. L., Krienen, F. M., Castellanos, A., Diaz, J. C., & Yeo, B. T. T. (2011) · Journal of Neurophysiology · doi:10.1152/jn.00339.2011 · Cited by 7,304
Tracking whole-brain connectivity dynamics in the resting state
Allen, E. A., Damaraju, E., Plis, S. M., Erhardt, E. B., Eichele, T., & Calhoun, V. D. (2014) · Cerebral Cortex · doi:10.1093/cercor/bhs352 · Cited by 2,992
Dynamic functional connectivity: Promise, issues, and interpretations
Hutchison, R. M., Womelsdorf, T., Allen, E. A., Bandettini, P. A., Calhoun, V. D., Corbetta, M., Della Penna, S., Duyn, J. H., Glover, G. H., Gonzalez-Castillo, J., et al. (2013) · NeuroImage · doi:10.1016/j.neuroimage.2013.05.079 · Cited by 2,962
The influence of head motion on intrinsic functional connectivity MRI
Van Dijk, K. R. A., Sabuncu, M. R., & Buckner, R. L. (2012) · NeuroImage · doi:10.1016/j.neuroimage.2011.07.044 · Cited by 2,344
Prediction of individual brain maturity using fMRI
Dosenbach, N. U. F., Nardos, B., Cohen, A. L., Fair, D. A., Power, J. D., Church, J. A., Nelson, S. M., Wig, G. S., Vogel, A. C., Lessov-Schlaggar, C. N., et al. (2010) · Science · doi:10.1126/science.1194144 · Cited by 2,183
A default mode of brain function: a brief history of an evolving idea
Raichle, M. E., & Snyder, A. Z. (2007) · NeuroImage · doi:10.1016/j.neuroimage.2007.02.041 · Cited by 2,173
Decoding subject-driven cognitive states with whole-brain connectivity patterns
Shirer, W. R., Ryali, S., Rykhlevskaia, E., Menon, V., & Greicius, M. D. (2012) · Cerebral Cortex · doi:10.1093/cercor/bhr099 · Cited by 1,843
Time–frequency dynamics of resting-state brain connectivity measured with fMRI
Chang, C., & Glover, G. H. (2010) · NeuroImage · doi:10.1016/j.neuroimage.2009.12.011 · Cited by 1,808
Neurodevelopmental Trajectories of the Human Cerebral Cortex
Shaw, P., Kabani, N. J., Lerch, J. P., Eckstrand, K., Lenroot, R., Gogtay, N., Greenstein, D., Clasen, L., Evans, A., Rapoport, J. L., et al. (2008) · The Journal of Neuroscience · doi:10.1523/jneurosci.5309-07.2008 · Cited by 1,644
Functional brain networks develop from a local to distributed organization
Fair, D. A., Cohen, A. L., Power, J. D., Dosenbach, N. U. F., Church, J. A., Miezin, F. M., Schlaggar, B. L., & Petersen, S. E. (2009) · PLoS Computational Biology · doi:10.1371/journal.pcbi.1000381 · Cited by 1,530
Cited by
Sorted by citations
The dynamic functional connectome: State-of-the-art and perspectives
Preti, M. G., Bolton, T. A. W., & Ville, D. V. D. (2016) · NeuroImage · doi:10.1016/j.neuroimage.2016.12.061 · Cited by 1,454
Grayson, D. S., & Fair, D. A. (2017) · NeuroImage · doi:10.1016/j.neuroimage.2017.01.079 · Cited by 411
“Over development, rs-fcMRI networks show increased within-subject variability (Hutchison and Morton, 2015; Marusak et al., 2016; Qin et al., 2015), consistent with EEG studies showing that signal complexity increases over development (McIntosh et al., 2008; Vakorin et al., 2011).”
BackgroundNorthoff, G., & Lamme, V. (2020) · Neuroscience & Biobehavioral Reviews · doi:10.1016/j.neubiorev.2020.07.019 · Cited by 247
Dynamic functional connectivity of neurocognitive networks in children
Marusak, H. A., Calhoun, V. D., Brown, S., Crespo, L. M., Sala‐Hamrick, K., Gotlib, I. H., & Thomason, M. E. (2016) · Human Brain Mapping · doi:10.1002/hbm.23346 · Cited by 238
Zhang, C., Dougherty, C. C., Baum, S. A., White, T. J. H., & Michael, A. M. (2018) · Human Brain Mapping · doi:10.1002/hbm.23950 · Cited by 221
Metadata
- Authors
- Qin, J., Chen, S.-G., Hu, D., Zeng, L.-L., Fan, Y.-M., Chen, X.-P., & Shen, H.
- Affiliations
- National University of Defense Technology (CN)
- Corresponding author
- Shen, Hui
- Venue
- Frontiers in Human Neuroscience
- Publisher
- Frontiers Media SA
- Published
- 2015-07-16
- Volume
- 9
- Pages
- 418-418
- ISSN
- 1662-5161 (ISSN-L)
- PMC
- PMC4503925
- OpenAlex
- W1587698431
- Cited by
- 117
- References
- 73
- Citations by year
- 2026: 2 · 2025: 6 · 2024: 10 · 2023: 11 · 2022: 17 · 2021: 16 · 2020: 12 · 2019: 12 · 2018: 12 · 2017: 11 · 2016: 8
- FWCI
- 6.21
- Type
- journal article
- Language
- en
- Open access
- gold
- doi.org
- Licence
- cc-by
- Locations
- Frontiers in Human Neuroscience (publishedVersion, cc-by)
- PubMed Central (publishedVersion, cc-by)
- PubMed (publishedVersion)
- DOAJ (DOAJ: Directory of Open Access Journals) (submittedVersion, cc-by-sa)
- Funders
- National Key Laboratory of Human Factors Engineering
- National Natural Science Foundation of China (2013CB329401, 61375034, 61375111)
- National Key Research and Development Program of China (61375034, 61375111, 2013CB329401)
- Topics
- Life Sciences › Neuroscience › Cognitive Neuroscience › Functional Brain Connectivity Studies
- Health Sciences › Medicine › Radiology, Nuclear Medicine and Imaging › Advanced Neuroimaging Techniques and Applications
- Health Sciences › Medicine › Radiology, Nuclear Medicine and Imaging › Advanced MRI Techniques and Applications
- Keywords
- dynamic functional connectivity, brain maturation, developmental trajectories, individual differences, default mode network, cerebellum, visual network, cingulo-opercular network, resting-state functional connectivity
About these checks
Registry, retraction, Cites and statistics results are computed, not judged, with one exception: a printed reference that no index lists is read once by a model before it counts as a citation error. Claims are extracted by a model and kept only when their quote appears verbatim in the text; each cited source is then checked, with a model’s help, for whether it says what the claim relies on. Those verdicts can be wrong — read the claim’s quote and the cited source before relying on one.
Statistics and arithmetic are recomputed, not judged.
Confidence bands are shown only for fields calibrated on our annotated test set. None is calibrated yet, so no band is shown.
What counts as a claim ›How we measure confidence ›How we check this ›
Are you an author, or do you see a problem with this page? Request a review
