

The DOI matches its Crossref record; 71 of the 71 references it cites were found in a registry or an index.
Echocardiographic Evaluation of Hemodynamics in Neonates and Children
Open accessAbstract
Hemodynamic instability and inadequate cardiac performance are common in critically ill children. The clinical assessment of hemodynamic status is reliant upon physical examination supported by the clinical signs such as heart rate, blood pressure, capillary refill time, and measurement of the urine output and serum lactate. Unfortunately, all of these parameters are surrogate markers of cardiovascular well-being and they provide limited direct information regarding the adequacy of blood flow and tissue perfusion. A bedside point-of-care echocardiography can provide real-time hemodynamic information by assessing cardiac function, loading conditions (preload and afterload) and cardiac output. The echocardiography has the ability to provide longitudinal functional assessment in real time, which makes it an ideal tool for monitoring hemodynamic assessment in neonates and children. It is indispensable in the management of patients with shock, pulmonary hypertension, and patent ductus arteriosus. The echocardiography is the gold standard diagnostic tool to assess hemodynamic stability in patients with pericardial effusion, cardiac tamponade, and cardiac abnormalities such as congenital heart defects or valvar disorders. The information from echocardiography can be used to provide targeted treatment in intensive care settings such as need of fluid resuscitation versus inotropic support, choosing appropriate inotrope or vasopressor, and in providing specific interventions such as selective pulmonary vasodilators in pulmonary hypertension. The physiological information gathered from echocardiography may help in making timely, accurate, and appropriate diagnosis and providing specific treatment in sick patients. There is no surprise that use of bedside point-of-care echocardiography is rapidly gaining interest among neonatologists and intensivists, and it is now being used in clinical decision making for patients with hemodynamic instability. Like any other investigation, it has certain limitations and the most important limitation is its intermittent nature. Sometimes acquiring high quality images for precise functional assessment in a ventilated child can be challenging. Therefore, it should be used in conjunction with the existing tools (physical examination and clinical parameters) for hemodynamic assessment while making clinical decisions.
Overview
The claims and statistics of this paper haven’t been checked yet.
Run the check — free, no account needed. It reads the open-access text and checks the sources it cites.
Integrity signals
Registry
Cites
Statistics
Figures
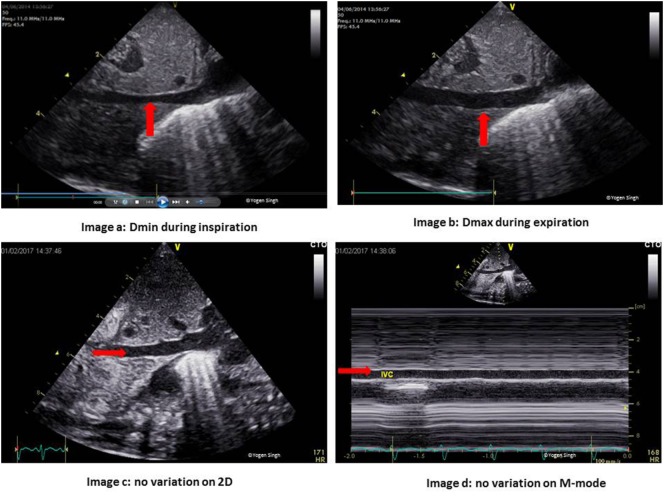
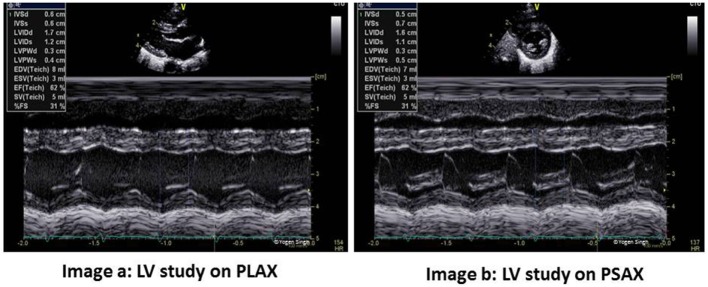
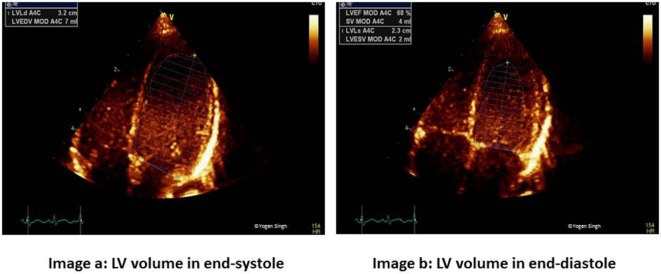
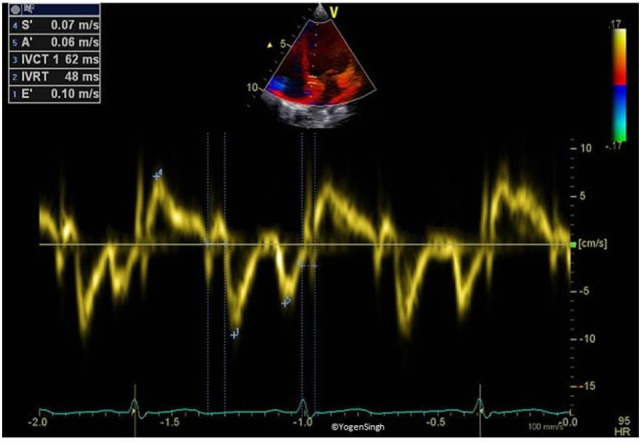
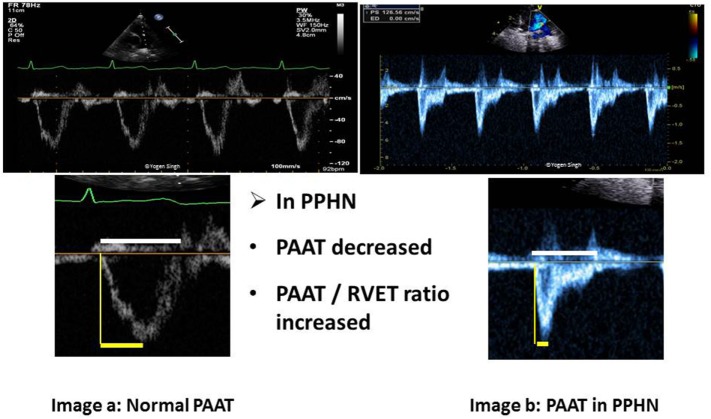
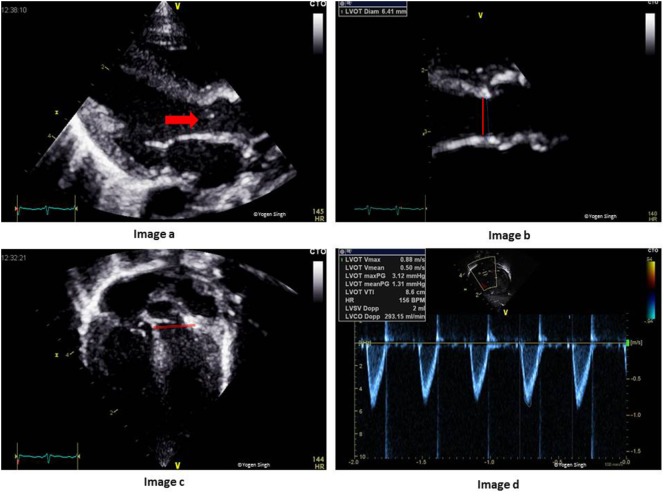
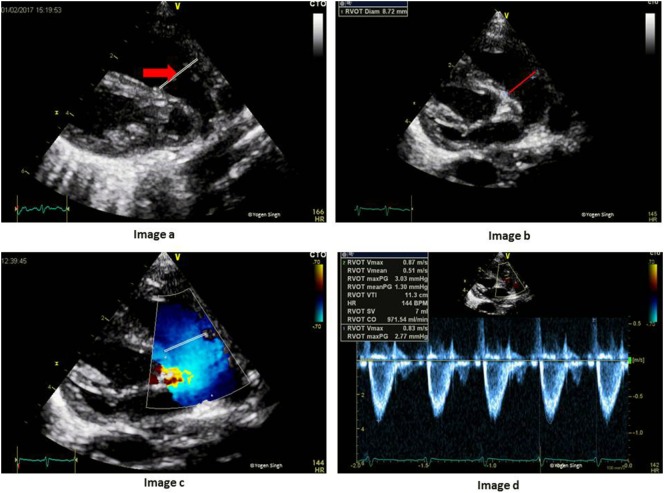
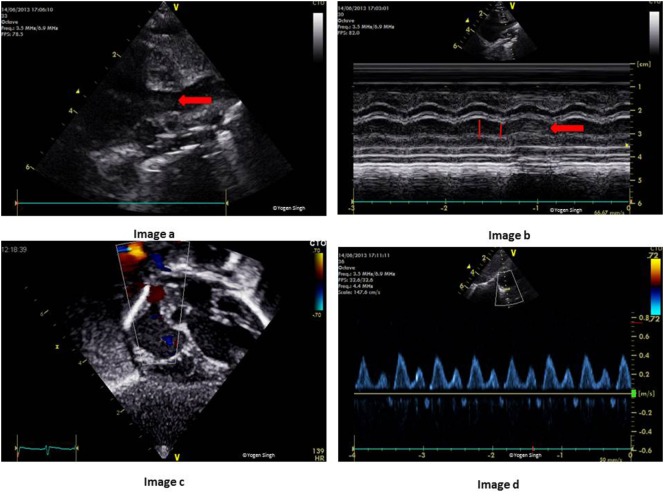
Verification
Claims the paper makes
The claims and statistics of this paper haven’t been checked yet.
Run the check — free, no account needed. It reads the open-access text and checks the sources it cites.
Claims other papers make about this one
Each is checked against this paper’s own text: does it say what the citing paper says it does?
The cited source says what the claim attributes to it.
In the citing paper
“TNE can lead to changes in clinical management in approximately 30–60% of patients with hemodynamic instability [50].”
From Trends and Challenges in Noninvasive Hemodynamic Monitoring of Neonates Following Cardiac Surgery: A Narrative Review (2025) · cites this paper as [50]
Self-check
Percentages, sums and reported differences re-computed from the paper’s own numbers.
The self-check needs the paper’s full text.
Citations
Cites
Lang, R. M., Bierig, M., Devereux, R. B., Flachskampf, F. A., Foster, E., Pellikka, P. A., Picard, M. H., Roman, M. J., Seward, J., Shanewise, J. S., et al. (2005) · Journal of the American Society of Echocardiography · doi:10.1016/j.echo.2005.10.005 · Cited by 11,318
Rudski, L., Lai, W. W., Afilalo, J., Hua, L., Handschumacher, M. D., Chandrasekaran, K., Solomon, S. D., Louie, E. K., & Schiller, N. B. (2010) · Journal of the American Society of Echocardiography · doi:10.1016/j.echo.2010.05.010 · Cited by 7,080
Cecconi, M., Backer, D. D., Antonelli, M. M., Beale, R. J., Bakker, J., Hofer, C. K., Jaeschke, R., Mebazaa, A., Pinsky, M. R., Teboul, J., et al. (2014) · Intensive Care Medicine · doi:10.1007/s00134-014-3525-z · Cited by 1,849
Lopez, L., Colan, S. D., Frommelt, P. C., Ensing, G. J., Kendall, K., Younoszai, A. K., Lai, W. W., & Geva, T. (2010) · Journal of the American Society of Echocardiography · doi:10.1016/j.echo.2010.03.019 · Cited by 1,557
Vincent, J., & Backer, D. D. (2013) · New England Journal of Medicine · doi:10.1056/nejmra1208943 · Cited by 1,532
The respiratory variation in inferior vena cava diameter as a guide to fluid therapy
Feissel, M., Michard, F., Faller, J.-P., & Teboul, J. (2004) · Intensive Care Medicine · doi:10.1007/s00134-004-2233-5 · Cited by 963
Barbier, C., Loubières, Y., Schmit, C., Hayon, J., Ricôme, J.-L., Jardin, F., & Vieillard‐Baron, A. (2004) · Intensive Care Medicine · doi:10.1007/s00134-004-2259-8 · Cited by 934
Feissel, M., Michard, F., Mangin, I., Ruyer, O., Faller, J.-P., & Teboul, J. (2001) · CHEST Journal · doi:10.1378/chest.119.3.867 · Cited by 607
Strain and strain rate imaging: a new clinical approach to quantifying regional myocardial function
Sutherland, G. R., Salvo, G. D., Claus, P., D’hooge, J., & Bijnens, B. H. (2004) · Journal of the American Society of Echocardiography · doi:10.1016/j.echo.2004.03.027 · Cited by 604
Superior vena cava flow in newborn infants: a novel marker of systemic blood flow
Kluckow, M. R., & Evans, N. (2000) · Archives of Disease in Childhood Fetal & Neonatal · doi:10.1136/fn.82.3.f182 · Cited by 404
Cited by
Sorted by citations
Singh, Y., Tissot, C., Fraga, M. V., Yousef, N., Cortes, R. G., Lopez, J., Sanchez-de-Toledo, J., Brierley, J., Colunga, J. M., Raffaj, D., et al. (2020) · Critical Care · doi:10.1186/s13054-020-2787-9 · Cited by 659
Self-citationEchocardiographic Evaluation of Ventricular Function—For the Neonatologist and Pediatric Intensivist
Tissot, C., Singh, Y., & Sekarski, N. (2018) · Frontiers in Pediatrics · doi:10.3389/fped.2018.00079 · Cited by 181
Self-citationMoving Beyond the Stethoscope: Diagnostic Point-of-Care Ultrasound in Pediatric Practice
Conlon, T., Nishisaki, A., Singh, Y., Bhombal, S., Luca, D. D., Kessler, D. O., Su, E. R., Chen, A. E., & Fraga, M. V. (2019) · PEDIATRICS · doi:10.1542/peds.2019-1402 · Cited by 120
Self-citationPathophysiology and Management of Persistent Pulmonary Hypertension of the Newborn
Singh, Y., & Lakshminrusimha, S. (2021) · Clinics in Perinatology · doi:10.1016/j.clp.2021.05.009 · Cited by 98
Self-citationSingh, Y., Villaescusa, J. U., da Cruz, E. M., Tibby, S. M., Bottari, G., Saxena, R., Guillén, M., Herce, J. L., Di Nardo, M., Cecchetti, C., et al. (2020) · Critical Care · doi:10.1186/s13054-020-03326-2 · Cited by 86
Self-citationPoint-of-Care Ultrasound in the Pediatric Intensive Care Unit
Burton, L., Bhargava, V., & Kong, M. Y. F. (2022) · Frontiers in Pediatrics · doi:10.3389/fped.2021.830160 · Cited by 72
Advances in Diagnosis and Management of Hemodynamic Instability in Neonatal Shock
Singh, Y., Katheria, A. C., & Vora, F. (2018) · Frontiers in Pediatrics · doi:10.3389/fped.2018.00002 · Cited by 68
Self-citationMore, K., Aiyer, S., Goti, A., Parikh, M., Sheikh, S., Patel, G., Kallem, V., Soni, R., & Kumar, P. (2022) · European Journal of Pediatrics · doi:10.1007/s00431-022-04377-z · Cited by 69
Singh, Y., Fraisse, A., Erdeve, Ö., & Atasay, B. (2020) · Frontiers in Pediatrics · doi:10.3389/fped.2020.573627 · Cited by 53
Self-citationEchocardiographic Evaluation of Transitional Circulation for the Neonatologists
Singh, Y., & Tissot, C. (2018) · Frontiers in Pediatrics · doi:10.3389/fped.2018.00140 · Cited by 50
Self-citationYoon, S. A., Hong, W. H., & Cho, H. J. (2020) · BMC Pediatrics · doi:10.1186/s12887-020-02212-8 · Cited by 47
Neonatal functional echocardiography
Tissot, C., & Singh, Y. (2020) · Current Opinion in Pediatrics · doi:10.1097/mop.0000000000000887 · Cited by 47
Self-citationFunctional Echocardiography in the Neonatal Intensive Care Unit
Singh, Y., Katheria, A. C., & Tissot, C. (2018) · Indian Pediatrics · doi:10.1007/s13312-018-1286-4 · Cited by 39
Self-citationThe evolution of cardiac point of care ultrasound for the neonatologist
Singh, Y., Bhombal, S., Katheria, A. C., Tissot, C., & Fraga, M. V. (2021) · European Journal of Pediatrics · doi:10.1007/s00431-021-04153-5 · Cited by 36
Self-citationPerinatal Cardiovascular Physiology and Recognition of Critical Congenital Heart Defects
Singh, Y., & Lakshminrusimha, S. (2021) · Clinics in Perinatology · doi:10.1016/j.clp.2021.05.008 · Cited by 36
Self-citationOrgan Complications of Infants with Hypoxic Ischemic Encephalopathy Before Therapeutic Hypothermia
Michniewicz, B., Al-Saad, S. R., Karbowski, L. M., Gadzinowski, J., Szymankiewicz, M., & Szpecht, D. (2020) · Therapeutic Hypothermia and Temperature Management · doi:10.1089/ther.2020.0035 · Cited by 25
Cardiac Output Monitoring in Preterm Infants
McGovern, M., & Miletín, J. (2018) · Frontiers in Pediatrics · doi:10.3389/fped.2018.00084 · Cited by 23
Ductus arteriosus flow predicts outcome in neonates with congenital diaphragmatic hernia
Bo, B., Pugnaloni, F., Licari, A., Patel, N., Strizek, B., Lemloh, L., Leyens, J., Mueller, A., & Kipfmueller, F. (2023) · Pediatric Pulmonology · doi:10.1002/ppul.26385 · Cited by 20
Follow-up after Percutaneous Patent Ductus Arteriosus Occlusion in Lower Weight Infants
Nealon, E., Rivera, B. K., Cua, C. L., Ball, M. K., Stiver, C. A., Boe, B. A., Slaughter, J. L., Chisolm, J. L., Smith, C. V., Cooper, J. N., et al. (2019) · The Journal of Pediatrics · doi:10.1016/j.jpeds.2019.05.070 · Cited by 18
Aichhorn, L., Küng, E., Habrina, L., Werther, T., Berger, A., Urlesberger, B., & Schwaberger, B. (2021) · Children · doi:10.3390/children8080628 · Cited by 18
Diagnostic Utility of Point-of-Care Ultrasound in the Pediatric Cardiac Intensive Care Unit
Persson, J. N., Kim, J. S., & Good, R. J. (2022) · Current Treatment Options in Pediatrics · doi:10.1007/s40746-022-00250-1 · Cited by 17
Echocardiographic measures of ventricular-vascular interactions in congenital diaphragmatic hernia
Aggarwal, S. A., Shanti, C. M., Agarwal, P., Lelli, J. L., & Natarajan, G. (2021) · Early Human Development · doi:10.1016/j.earlhumdev.2021.105534 · Cited by 17
Structured Neonatal Point-of-Care Ultrasound Training Program
Kurepa, D., Boyar, V., Zaghloul, N., BEACHY, J. C., Zaytseva, A., Teng, D., Cooper, R., Klewer, S. E., & Amodio, J. B. (2020) · American Journal of Perinatology · doi:10.1055/s-0040-1709667 · Cited by 15
Deshpande, S., Suryawanshi, P. B., Holkar, S., Singh, Y., Singh, Y. R., Klimek, J., & Gupta, S. (2021) · Journal of Ultrasound · doi:10.1007/s40477-021-00590-y · Cited by 14
Self-citationA new physiologic-based integrated algorithm in the management of neonatal hemodynamic instability
Elsayed, Y. N., & Wahab, M. G. A. (2021) · European Journal of Pediatrics · doi:10.1007/s00431-021-04307-5 · Cited by 14
Current Clinical Practice in Point-of-Care Ultrasound Use in the PICUs Across Europe
Humblet, M. H., Singh, Y., Tissot, C., Luca, D. D., & Leroy, P. L. J. M. (2020) · Pediatric Critical Care Medicine · doi:10.1097/pcc.0000000000002403 · Cited by 11
Self-citationNeonatal and paediatric point‐of‐care ultrasound review
Pan, S. J., Lin, C., & Tsui, B. C. H. (2022) · Australasian Journal of Ultrasound in Medicine · doi:10.1002/ajum.12322 · Cited by 10
Martini, S., Corsini, I., Corvaglia, L., Suryawanshi, P. B., Chan, B., & Singh, Y. (2023) · Frontiers in Pediatrics · doi:10.3389/fped.2023.1067323 · Cited by 10
Self-citationPoint-of-care ultrasound for children
Ichihashi, K., & Nonaka, K. (2022) · Journal of Medical Ultrasonics · doi:10.1007/s10396-021-01169-0 · Cited by 9
McNamara, P. J., Barker, P. C. A., Jain, A., & Lai, W. W. (2021) · Critical Care · doi:10.1186/s13054-020-03394-4 · Cited by 9
Katheria, A. C., Mercer, J., Poeltler, D. M., Morales, A., Torres, N., Lakshminrusimha, S., & Singh, Y. (2023) · The Journal of Pediatrics · doi:10.1016/j.jpeds.2023.03.001 · Cited by 8
Self-citationChaudhari, T., Sotomayor, N. S., & Maheshwari, R. (2024) · Frontiers in Pediatrics · doi:10.3389/fped.2024.1356157 · Cited by 8
Peček, J., Koželj, M., Lenasi, H., & Fister, P. (2022) · Pediatric Cardiology · doi:10.1007/s00246-022-02855-7 · Cited by 8
Cardiac output monitoring in paediatric cardiac surgery: A review
Woodman, H. M., Lee, C., Ahmed, A. N., Malik, B. A., Mellor, S., Brown, L. J., Gentle, L., & Harky, A. (2021) · Cardiology in the Young · doi:10.1017/s1047951120004680 · Cited by 7
Amer, R., Seshia, M. M. K., & Elsayed, Y. N. (2022) · Journal of Neonatal-Perinatal Medicine · doi:10.3233/npm-210932 · Cited by 7
Pulmonary Hypertension and Necrotizing Enterocolitis in Neonates Treated with Diazoxide
Duggal, M., Moore, S. S., Simoneau, J., Girard, G., Gernet, I. B., Oettingen, J. E. V., SantʼAnna, G., & Altit, G. (2023) · American Journal of Perinatology · doi:10.1055/s-0043-1764385 · Cited by 7
Kashaki, M., Mohazzab, A., Radgoudarzi, M., Bordbar, A., & Dabbagh, S. (2024) · Pediatrics & Neonatology · doi:10.1016/j.pedneo.2023.12.007 · Cited by 7
Narrative Review on Echocardiographic Evaluation of Patent Ductus Arteriosus in Preterm Infants
Singh, Y., Chan, B., Noori, S., & Ramanathan, R. (2024) · Journal of Cardiovascular Development and Disease · doi:10.3390/jcdd11070199 · Cited by 7
Self-citationUse of echocardiography in the neonatal intensive care unit
Singh, Y. (2022) · Paediatrics and Child Health · doi:10.1016/j.paed.2022.07.005 · Cited by 7
Self-citationShin, J. A., Lee, J. Y., & Yum, S. K. (2023) · Scientific Reports · doi:10.1038/s41598-023-37376-7 · Cited by 11
Huang, J. Q., Singh, Y., Adie, M. A., Noori, S., Ebrahimi, M., Durand, M., Cayabyab, R. G., & Ramanathan, R. (2023) · European Journal of Pediatrics · doi:10.1007/s00431-023-05121-x · Cited by 6
Self-citationEchocardiography in the neonatal unit: current status and future prospects
Singh, Y. (2024) · Expert Review of Medical Devices · doi:10.1080/17434440.2024.2334449 · Cited by 6
Self-citationGreiwe, G., Balfanz, V., Hapfelmeier, A., Zajonz, T. S., Müller, M., Saugel, B., & Schulte-Uentrop, L. (2022) · Anesthesia & Analgesia · doi:10.1213/ane.0000000000006010 · Cited by 6
Translating Guidelines into Practical Practice
Weber, M. D., Lim, J. K. B., Ginsburg, S., Conlon, T., & Nishisaki, A. (2022) · Critical Care Clinics · doi:10.1016/j.ccc.2022.09.012 · Cited by 6
Manoj, S., Talasila, A., Khattar, P., Sastry, B., & Samhouri, M. (2025) · Cureus · doi:10.7759/cureus.97874 · Cited by 5
Pliauckienė, A., Liubšys, A., Vankevičienė, R., & Usonis, V. (2021) · Journal of Clinical Monitoring and Computing · doi:10.1007/s10877-021-00711-2 · Cited by 5
Miletín, J., Straňák, Z., Catháin, N. Ó., Janota, J., & Šemberová, J. (2021) · Frontiers in Pediatrics · doi:10.3389/fped.2021.661698 · Cited by 5
Acevedo-Olguín, A. L., Hernández-Benítez, R., Iglesias-Leboreiro, J., Bernárdez-Zapata, I., Hoyo, M. N. G.-D., & Rendón-Macı́as, M. E. (2020) · Archivos de cardiolog�a de M�xico (English ed Internet) · doi:10.24875/acme.m20000076 · Cited by 5
FoCUS and non-invasive hemodynamics monitoring in neonatal sepsis
Abdou, N., Rowisha, M., Elmahdy, H. S., Tolba, O., Shihab, N. S. E., & Elmesiry, A. (2025) · European Journal of Pediatrics · doi:10.1007/s00431-025-06283-6 · Cited by 4
Maseeh, A. A. E., Mostafa, F. A. Z., Younis, A. T., & Salam, N. A. E. (2022) · Pediatric Sciences Journal · doi:10.21608/cupsj.2021.92531.1025 · Cited by 4
Maddaloni, C., Rose, D. U. D., Ronci, S., Pugnaloni, F., Martini, L., Caoci, S., Bersani, I., Conforti, A., Campi, F., Lombardi, R., et al. (2023) · Pediatric Research · doi:10.1038/s41390-023-02889-4 · Cited by 6
Consistency between Impedance Technique and Echocardiogram Hemodynamic Measurements in Neonates
Wu, W., Lin, S., Xie, C.-X., Li, J., Lie, J. T., & Qiu, S. (2020) · American Journal of Perinatology · doi:10.1055/s-0040-1710030 · Cited by 4
Ghanem, M., & El-Hefnawy, A. S. (2021) · Egyptian Journal of Anaesthesia · doi:10.1080/11101849.2021.1889747 · Cited by 4
Rudakova, А. А., Ionov, О. V., Filippova, E. A., Сугак, А. Б., Kirtbaya, A. R., Balashova, E. N., & Zubkov, V. V. (2022) · Neonatology News Opinions Training · doi:10.33029/2308-2402-2022-10-4-54-62 · Cited by 4
Shape of Pulmonary Artery Doppler Flow Profile and Right Ventricular Hemodynamics in Neonates
Joye, S., Bhattacharya, S., Kharrat, A., Jasani, B., Giesinger, R. E., McNamara, P. J., & Jain, A. (2023) · The Journal of Pediatrics · doi:10.1016/j.jpeds.2023.113864 · Cited by 4
Prenatal prediction of neonatal haemodynamic adaptation after maternal hyperoxygenation
McHugh, A. F., Breatnach, C. R., Bussmann, N., Franklin, O., EL-Khuffash, A. F., & Breathnach, F. (2020) · BMC Pregnancy and Childbirth · doi:10.1186/s12884-020-03403-y · Cited by 4
Nguyen, T. T., Dang, G. T. K., Bui, P., Anh, M. K., Hoa, P. T., Ryu, D., & Dũng, V. C. (2026) · Frontiers in Endocrinology · doi:10.3389/fendo.2026.1701713 · Cited by 3
Paediatric point‐of‐care ultrasound in a resource‐limited Melanesian setting: A case series
Henry, J. (2020) · Australasian Journal of Ultrasound in Medicine · doi:10.1002/ajum.12199 · Cited by 3
Management of Pulmonary Hypertension in Term Infants—A Review
Kumaran, U., & Shenoi, A. (2021) · Journal of Neonatology · doi:10.1177/0973217921999383 · Cited by 3
Kallimath, A., Kolkur, K., Malshe, N. S., Klimek, J., & Suryawanshi, P. B. (2024) · Frontiers in Pediatrics · doi:10.3389/fped.2023.1296184 · Cited by 3
Ünal, İ., İmamoğlu, E. Y., Ozumut, S. S., & Ovalı, F. (2025) · Journal of Perinatology · doi:10.1038/s41372-025-02271-8 · Cited by 2
Role of functional echocardiography in neonatal shock: a systematic review and meta-analysis
Goyal, N., Ananthan, A., Subhadarsini, S., & Shah, S. (2025) · Pediatric Research · doi:10.1038/s41390-025-04298-1 · Cited by 2
Fadel, F. I., Badr, A. M., Abdelkareem, M., Samir, M., Abdallah, M., Atia, F. M., & Ramadan, Y. M. (2023) · The Indian Journal of Pediatrics · doi:10.1007/s12098-023-04903-3 · Cited by 2
Cucerea, M., Moscalu, M., Ognean, M. L., Făgărășan, A., Toma, D., Marian, R., Anciuc-Crauciuc, M., Racean, A., Gáll, Z., & Simon, M. (2024) · Biomedicines · doi:10.3390/biomedicines12061136 · Cited by 2
Multisystem Inflammatory Syndrome In Neonates Associated With SARS-CoV2 infection- A case series.Preprint
More, K., Aiyer, S., Goti, A. M., Parikh, M., Sheikh, S. S., Patel, G., Kallem, V. R., Soni, R., & Kumar, P. (2021) · Research Square · doi:10.21203/rs.3.rs-846460/v1 · Cited by 2
Nedelcu, C., Ionescu, N. S., Bizubac, A. M., Filip, C., & Cirstoveanu, C. (2025) · Life · doi:10.3390/life15101621 · Cited by 2
“TNE can lead to changes in clinical management in approximately 30–60% of patients with hemodynamic instability [50].”
Neonatal & Paediatric Point Of Care Ultrasound (Pocus): A Novel Standard Practice
Shinde, A., Kumar, S., & Mhaske, S. (2021) · VIMS Health Science Journal · doi:10.46858/vimshsj.8308 · Cited by 1
Pereira, S. S., & Šatas, S. (2024) · BMJ Paediatrics Open · doi:10.1136/bmjpo-2024-002606 · Cited by 1
Zayani, S., Thabet, F. C., Daya, A., Chamtouri, I., Bennasrallah, C., Chouchane, C., Hamda, K. B., & Chouchane, S. (2025) · Pediatric Emergency Care · doi:10.1097/pec.0000000000003349 · Cited by 1
Zhang, L. (2025) · American Journal of Translational Research · doi:10.62347/uqys8766 · Cited by 1
Kanagaraj, U. K., Castaldo, M. P., Braschel, M. C., Harris, A., & Mitra, S. (2025) · Pediatric Research · doi:10.1038/s41390-025-04389-z · Cited by 1
Qin, X., Dan, Y., Zhang, K., Tong, C., Wang, H., Sun, L., Mamtili, I., Huang, Y. M., & Zheng, J. (2025) · Journal of Cardiothoracic and Vascular Anesthesia · doi:10.1053/j.jvca.2025.09.228 · Cited by 1
Congenital anemia due to fetal blood loss (guideline)
Balashova, E. N., Sharafutdinova, D. R., Narogan, M. V., Sapun, O. I., Карпова, А. Л., Александровна, С. О., Kirtbaya, A. R., Ryndin, А. Y., Golubtsova, Y. M., Ionov, О. V., et al. (2021) · Neonatology News Opinions Training · doi:10.33029/2308-2402-2021-9-4-58-68 · Cited by 1
Tissot, C., Singh, Y., Younoszai, A. K., & Phelps, C. (2020) · Springer eBooks · doi:10.1007/978-3-030-21870-6_6 · Cited by 1
Self-citationEchocardiographic Evaluation of Left Ventricular Function and Hemodynamic Status
Tissot, C., Sekarski, N., & Singh, Y. (2023) · Springer eBooks · doi:10.1007/978-3-031-26538-9_5 · Cited by 1
Self-citationTorres, R. A., & Torres, T. R. (2024) · Medical Research Archives · doi:10.18103/mra.v12i2.5165 · Cited by 1
Petoello, E., Flore, A. I., Nogara, S., Bonafiglia, E., Lenzi, M. B., Arnone, O. C., Benfari, G., Ciarcià, M., Corsini, I., de Waal, K., et al. (2024) · Scientific Reports · doi:10.1038/s41598-024-59441-5 · Cited by 1
Focused critical care echocardiography
Puente-Reyes, C., Plazas-Castro, H., Guzmán, M. C., León, O. J., Izquierdo, L. M., & Rodríguez, C. (2019) · Colombian Journal of Anesthesiology · doi:10.1097/cj9.0000000000000087 · Cited by 1
Cardiorespiratory status and cerebral oxygenation in neonates with respiratory disorders
Санковец, Д. Н., & Vitushka, A. M. (2020) · Neonatology News Opinions Training · doi:10.33029/2308-2402-2020-8-2-13-20 · Cited by 1
Torres, R. A., Bastos, M. G., Torres, B. R., Nogueira, A. L., Farnetano, B. D. S., de Andrade, F. M., de Freitas, B. A. C., & Magalhães, L. V. B. (2020) · HU Revista · doi:10.34019/1982-8047.2020.v46.30170 · Cited by 1
Санковец, Д. Н., Gnedko, T. V., Vitushka, A. M., & Свирская, О. Я. (2021) · Proceedings of the National Academy of Sciences of Belarus Medical series · doi:10.29235/1814-6023-2021-18-1-16-24 · Cited by 1
Санковец, Д. Н. (2020) · Репродуктивное здоровье Восточная Европа · doi:10.34883/pi.2020.10.3.014 · Cited by 1
Nguyen, T.-Q., Bechsgaard, T. E., Schmidt, M. R., Juul, K., Moshavegh, R., Lönn, L., Nielsen, M. B., Jensen, J. A., & Hansen, K. L. (2021) · Ultrasound International Open · doi:10.1055/a-1652-1261 · Cited by 2
Epidemiological Profile of Congenital Cardiopathy Neonatal Revelation in Tehran
Kenari, M. A. (2018) · JOURNAL OF CASE REPORTS AND STUDIES · doi:10.15744/2348-9820.6.603
Acevedo-Olguín, A. L., Hernández-Benítez, R., Iglesias-Leboreiro, J., Bernárdez-Zapata, I., Hoyo, M. N. G.-D., & Rendón-Macı́as, M. E. (2019) · Archivos de cardiología de México · doi:10.24875/acm.19000138
Role of Point-of-care Ultrasound Imaging in Neonatal Sepsis
Nagpal, R., & Suryawanshi, P. B. (2020) · Pediatric Infectious Disease · doi:10.5005/jp-journals-10081-1249
Cardiovascular Physiology in Premature and Term Neonates
Singh, Y. (2021) · Springer eBooks · doi:10.1007/978-1-4471-4999-6_254-1
Self-citationAmer, R., Seshia, M. M. K., & Elsayed, Y. N. (2021) · Research Square · doi:10.21203/rs.3.rs-482070/v1
Spontaneous intracardiac contrast in a case with intestinal pneumatosis
Leth-Olsen, M., Drivenes, Ø., Williams, W., & Nyrnes, S. A. (2021) · BMJ Case Reports · doi:10.1136/bcr-2021-245153
Elsayed, Y. N., Wahab, M. G. A., Mohamed, A., Fadel, N. B., Bhombal, S., Yousef, N., Fraga, M. V., Afifi, J. K., Suryawanshi, P. B., Hyderi, A., et al. (2022) · Research Square · doi:10.21203/rs.3.rs-1576038/v1
Self-citationClinical Benefits of New Echocardiographic Methods
Kojc, T. S., & Varda, N. M. (2022) · IntechOpen eBooks · doi:10.5772/intechopen.104808
Actualización en Cuidados Intensivos Pediátricos Vol. 2
Galeano, A. F. R., Coronel, J. L. M., Godoy, E. P. G., Prieto, E. E. R., Jordan, S. F. M., & Ortiz, A. F. H. (2023) · Juan Cuevas eBooks · doi:10.56470/978-9942-627-44-5
Actualización en Cuidados Intensivos Pediátricos Vol. 3
Cerna, G. D. V., Cerna, C. J. V., Carrillo, C. E. T., Luzuriaga, B. S. R., Cabascango, K. E. C., Luzuriaga, A. P. R., & Domínguez, D. C. S. (2023) · Juan Cuevas eBooks · doi:10.56470/978-9942-627-49-0
ECHOCARDIOGRAPHIC EVALUATION OF RIGHT VENTRICLE FUNCTION IN MECHANICALLY VENTILATED CHILDRENPreprint
Chiaradia, F. D. O., Luchese, S., Buratti, C., Pauletto, L. D. R., Navarro, N., Carvalho, P. R. A., & da Rocha, T. S. (2023) · doi:10.22541/au.169031167.75917521/v1
Advanced Functional Echocardiographic Views Including PDA Assessment and Hemodynamic Evaluation
Singh, Y., Joye, S., & Tissot, C. (2023) · Springer eBooks · doi:10.1007/978-3-031-26538-9_8
Self-citationComparison of Different Methods of Superior Vena Cava Flow Measurment in Preterm Infants
Halimić, M., Terzić, S., Orucevic, S., Jogunčić, A., Vukas, E., Arnautovic, Arnautović-Halimić, A., Kadić, A., & Sidran, A. (2023) · Archives of Pediatrics and Neonatology · doi:10.22259/2638-5155.0601001
Una sindrome infiammatoria multisistemica fredda complicata da shock
Valencic, I., Moratti, M., Lombardi, F., Francavilla, R., & Ghizzi, C. (2023) · Medico e Bambino - Pagine Elettroniche · doi:10.53126/mebxxvio151
Özdemir, M., Tepe, T., Atmış, A., Akbaş, T., Özlü, F., Yapıcıoğlu, H., & Narlı, N. (2023) · Güncel Pediatri · doi:10.4274/jcp.2023.03708
Comparison of Functional Echocardiographic Markers in Septic and Non-Septic Neonate
Mannan, M. A. (2024) · Journal of Clinical Medical Research · doi:10.46889/jcmr.2024.5310
Developing a Neonatal Pulmonary Hypertension Core Outcome Set (NeoPH COS)—A Study Protocol
Morgan, C. E., Woolfall, K., Aikman, N., Gale, C., & Subhedar, N. V. (2025) · Pulmonary Circulation · doi:10.1002/pul2.70052
Metadata
- Authors
- Singh, Y.
- Affiliations
- University of Cambridge (GB)
- Corresponding author
- Singh, Yogen
- ORCID
- Singh, Yogen
- Venue
- Frontiers in Pediatrics
- Publisher
- Frontiers Media SA
- Published
- 2017-09-15
- Volume
- 5
- Pages
- 201-201
- ISSN
- 2296-2360 (ISSN-L)
- PMC
- PMC5605552
- OpenAlex
- W2755816020
- Cited by
- 116
- References
- 71
- Citations by year
- 2026: 10 · 2025: 16 · 2024: 10 · 2023: 17 · 2022: 14 · 2021: 21 · 2020: 18 · 2019: 4 · 2018: 6
- FWCI
- 1.53
- Type
- journal article
- Language
- en
- Open access
- gold
- doi.org
- Licence
- cc-by
- Locations
- Frontiers in Pediatrics (publishedVersion, cc-by)
- PubMed Central (publishedVersion, cc-by)
- PubMed (publishedVersion)
- DOAJ (DOAJ: Directory of Open Access Journals) (submittedVersion, cc-by-sa)
- Topics
- Health Sciences › Medicine › Critical Care and Intensive Care Medicine › Ultrasound in Clinical Applications
- Health Sciences › Medicine › Surgery › Hemodynamic Monitoring and Therapy
- Health Sciences › Medicine › Cardiology and Cardiovascular Medicine › Congenital Heart Disease Studies
- Keywords
- point-of-care echocardiography, hemodynamic assessment, neonates, critically ill children, cardiac output, preload and afterload, shock, pulmonary hypertension, patent ductus arteriosus, cardiac tamponade, pericardial effusion, congenital heart disease, fluid resuscitation, vasopressors, pulmonary vasodilators, tissue perfusion
About these checks
Registry, retraction, Cites and statistics results are computed, not judged, with one exception: a printed reference that no index lists is read once by a model before it counts as a citation error. Claims are extracted by a model and kept only when their quote appears verbatim in the text; each cited source is then checked, with a model’s help, for whether it says what the claim relies on. Those verdicts can be wrong — read the claim’s quote and the cited source before relying on one.
Statistics and arithmetic are recomputed, not judged.
Confidence bands are shown only for fields calibrated on our annotated test set. None is calibrated yet, so no band is shown.
What counts as a claim ›How we measure confidence ›How we check this ›
Are you an author, or do you see a problem with this page? Request a review
