

The DOI matches its Crossref record; 77 of the 77 references it cites were found in a registry or an index; none of the 60 sources its claims cite is checked for support yet.
Comparison of Muscle Function, Bone Mineral Density and Body Composition of Early Starting and Later Starting Older Masters Athletes
Open accessAbstract
Masters endurance runners can epitomize healthy aging; being reflective of the physiological processes of aging without the compounded effects of inactivity. The primary aim of the present study was to determine, using cross-sectional data, whether individuals taking up training after the age of 50 years can achieve the same level of athletic performance and musculoskeletal characteristics in their older age as those who trained all of their adult lives. A total of 150 master endurance runners [age 68 (5) years; 111 male, 39 female] were divided into early starters (training all of their adulthood) and late starters (started training after age 50 years). A comparative non-athletic group of 59 healthy older adults [age 73 (4) years; 30 female, 29 male] were additionally included for analysis. Training intensity, age-graded performance (AGP) and musculoskeletal assessments were performed. Results showed that there was no difference between athlete groups for training intensity or age-graded performance, despite the 30-year difference in training history. Body fat percentage and leg lean mass did not differ between athlete groups, but were 17% lower and 12% greater, respectively, in athlete groups compared with controls. Power normalized to body mass did not differ between any groups. Spine BMD was lower in late starters than controls, while early starters did not differ from late starters or controls. Hip BMD did not differ between any of the groups. These findings show that the Masters athletes we studied that started intense endurance running after the age of 50 years had lower body fat and higher leg lean mass compared to non-athletes. Body composition and athletic performance of the late starters was very similar to those who trained all of their adult lives.
Overview
CoChat Summary
TL;DR
In a cross-sectional comparison, older Masters endurance runners who started intense training after age 50 had similar age-graded performance, training impacts, body fat percentage, and leg lean mass to those who trained throughout adulthood. Both athlete groups had lower body fat and greater leg lean mass than non-athletic controls, but late starters had lower spine BMD than controls.
Key findings
- Among 150 Masters endurance runners [age 68 (5) years; 111 male, 39 female], early starters had about 30 more training years than late starters (e.g., men: 52.3 ± 6.0 vs. 18.4 ± 5.1 years; p < 0.0005), but age-graded performance did not differ (p = 0.294), and low-, medium-, and high-impact accelerometry counts did not differ (p = 0.089, 0.799, and 0.352).
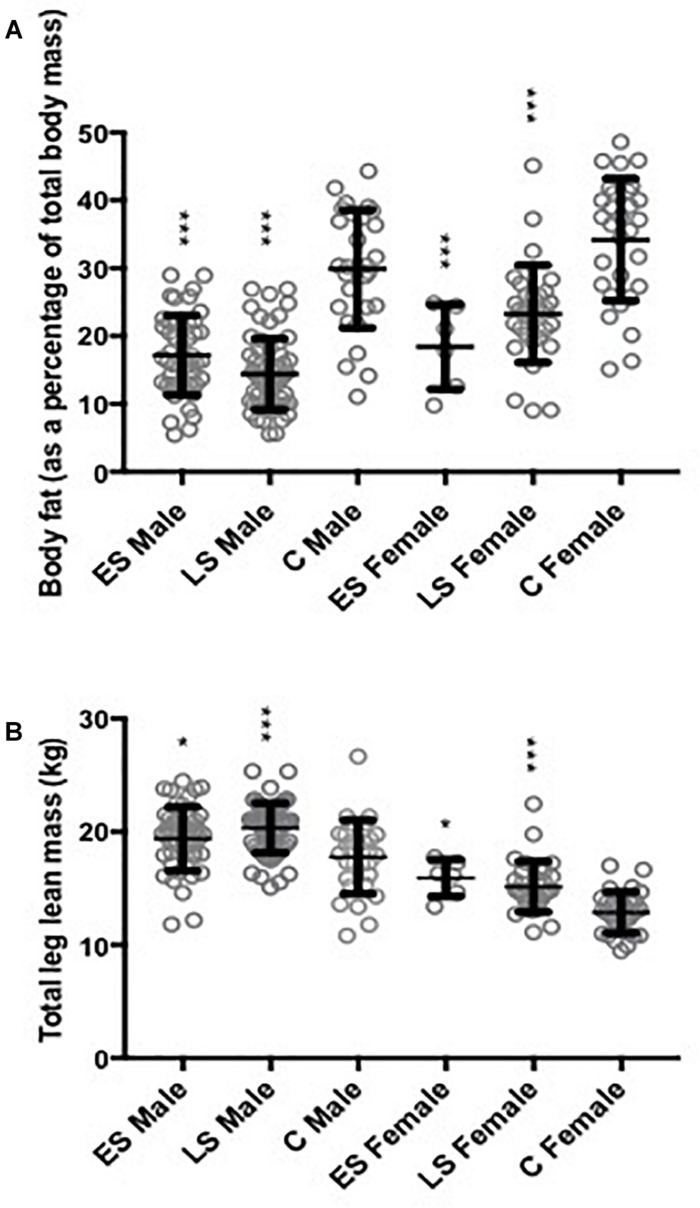
- Body fat percentage was approximately 17% lower and leg lean mass approximately 12% greater in both athlete groups than controls (p < 0.01 and p < 0.003, respectively), with no difference between early and late starters; appendicular lean mass was greater in late starters than controls (p = 0.001).
- Spine BMD was lower in late starters than controls (p = 0.001), while early starters did not differ from late starters or controls; hip BMD did not differ between any groups.
- Maximal grip strength and relative vertical jump power did not differ between groups; absolute vertical jump power was greater in controls than late starters (p = 0.006), with no difference between athlete groups.
Methods
- Cross-sectional study of 150 Masters endurance runners from the VIBE study (aged ≥59 years, regional endurance competition in past 12 months, free from serious injury >2 years), classified by questionnaire as early starters (trained throughout adulthood; 48 male/6 female) or late starters (started after age 50; 63 male/33 female), plus 59 healthy older controls from MYOAGE (29 male/30 female); total 209 participants.
- Measurements included DXA whole-body, hip, and spine scans for body composition and BMD; grip strength; countermovement vertical jump power; 7-day hip accelerometry in athletes; and age-graded performance from best ranked performance in the last 2 years.
- ANCOVA compared early starters, late starters, and controls with age and sex as covariates, followed by Fisher’s Least Significant Difference pairwise comparisons; significance was p < 0.05, with partial eta squared reported for effect sizes.
Limitations
- Stated by the paper: group assignment relied on self-reports and the cross-sectional design prevents causal conclusions; sample size was powered to detect small differences but very small early-vs-late differences may have been missed; controls’ data were collected approximately 5 years apart and controls did not complete the same physical activity assessments; athlete recruitment based on performance over the previous 2 years may miss fluctuations from injury or illness; Masters athletes may be better educated, of higher socioeconomic status, and have fewer diseases than the general population; energy intake and vitamin D/calcium status were not measured.
- Evident in the text: the athlete sample was predominantly male (111/150), and the early-starter female subgroup was very small (n = 6), limiting sex-specific conclusions; accelerometry was collected only in athletes, so activity comparisons with controls are unavailable.
Model-written summary. Check it against the paper before relying on it.
Integrity signals
Registry
Cites
Statistics
Figures
Verification
Claims the paper makes
0 Valid · 0 Not valid · 30 Not checked · 60 Own results and interpretations
A result the paper reports from its own data — it cites no other source for it, so there is none to check. The quote shows it is in the paper.
In the paper
“Pairwise comparisons showed that C were older than ES and LS, with no difference between ES and LS groups.”
§ Comparison of Muscle Function, Bone Mineral Density and Body Composition of Early Starting and Later Starting Older Masters Athletes > Results > Participant Characteristics
plain- Asserted: passes — The authors put it forward as true.
- Checkable: passes — It can be checked against evidence.
- Load-bearing: unclear — It is unclear whether the paper’s conclusions depend on it.
- Based: passes — The paper gives a reason why it holds.
A result the paper reports from its own data — it cites no other source for it, so there is none to check. The quote shows it is in the paper.
In the paper
“Both athlete groups had lower body fat and greater leg lean mass than healthy non-athletic controls, but spine BMD was lower in LS than in C.”
- Also stated in: § Discussion · plain
“The LS athletes had lower spine BMD, BMC, and Area than C, raising the possibility that starting regular intense endurance running after age 50 years may be detrimental to spine bone health.”
§ Comparison of Muscle Function, Bone Mineral Density and Body Composition of Early Starting and Later Starting Older Masters Athletes > Discussion
plainstates an association- Asserted: passes — The authors put it forward as true.
- Checkable: passes — It can be checked against evidence.
- Load-bearing: passes — The paper’s conclusions depend on it.
- Based: passes — The paper gives a reason why it holds.
- Also stated in: § Discussion · plain
A result the paper reports from its own data — it cites no other source for it, so there is none to check. The quote shows it is in the paper.
In the paper
“Our findings demonstrate that the men and women of the LS group with no previous history of intense training or competition before the age of 50 years, had by the age of 70 years very similar training intensity, athletic performance, body fat percentage and leg lean mass to athletes of the ES group whom had accumulated 30 extra years of training and competition”
§ Comparison of Muscle Function, Bone Mineral Density and Body Composition of Early Starting and Later Starting Older Masters Athletes > Discussion
boosted- Asserted: passes — The authors put it forward as true.
- Checkable: passes — It can be checked against evidence.
- Load-bearing: passes — The paper’s conclusions depend on it.
- Based: passes — The paper gives a reason why it holds.
A result the paper reports from its own data — it cites no other source for it, so there is none to check. The quote shows it is in the paper.
In the paper
“Our findings demonstrate that the men and women of the LS group with no previous history of intense training or competition before the age of 50 years, had by the age of 70 years very similar training intensity, athletic performance, body fat percentage and leg lean mass to athletes of the ES group whom had accumulated 30 extra years of training and competition”
§ Comparison of Muscle Function, Bone Mineral Density and Body Composition of Early Starting and Later Starting Older Masters Athletes > Discussion
boosted- Asserted: passes — The authors put it forward as true.
- Checkable: passes — It can be checked against evidence.
- Load-bearing: passes — The paper’s conclusions depend on it.
- Based: passes — The paper gives a reason why it holds.
A result the paper reports from its own data — it cites no other source for it, so there is none to check. The quote shows it is in the paper.
In the paper
“Accelerometry collected over 7 days showed similar impacts in the low, medium, and high g bands between ES and LS groups (p = 0.089, 0.799, and 0.352, respectively, as shown in Table 1).”
§ Comparison of Muscle Function, Bone Mineral Density and Body Composition of Early Starting and Later Starting Older Masters Athletes > Results > Participant Characteristics
plain- Asserted: passes — The authors put it forward as true.
- Checkable: passes — It can be checked against evidence.
- Load-bearing: unclear — It is unclear whether the paper’s conclusions depend on it.
- Based: passes — The paper gives a reason why it holds.
- Rests on an assumption not shown here.
37 more claims
Create a free account to see all 90 claims and to verify the 42 references still open.
- It may state two separate claims as one. 29
- Probably not a substantial claim. 27
Claims other papers make about this one
Each is checked against this paper’s own text: does it say what the citing paper says it does?
In the citing paper
“In Masters Athletes, Piasecki et al. [13, 14] stated that especially sprinting is associated with greater hip, spine and tibial BMD. What is more this effect was not confirmed to endurance running.”
From Bone mineral density in elite masters athletes: the effect of body composition and long-term exercise (2021) · cites this paper as [14]
In the citing paper
“Thus, masters athletes should have greater bone mineral density than aged-matched non-athletes and inactive peers [13, 14].”
From Bone mineral density in elite masters athletes: the effect of body composition and long-term exercise (2021) · cites this paper as [14]
In the citing paper
“There is evidence that chronic physical activity associated with the training of many Master athletes (especially those performing strength and power training) helps maintain bone mineral density [9, 173]”
From Protein Requirements for Master Athletes: Just Older Versions of Their Younger Selves (2021) · cites this paper as [9]
Statistics that don’t add up
Each reported p-value recomputed from its test statistic and degrees of freedom.
Rated minor: it would not touch a result — a value no result rests on, a p-value that stays on the same side of the significance level, or a conflict that is clerical, resolved elsewhere in the paper, or outside its own findings.
In the paper
“F(1,236) = 6.45, p = 0.014”
§ Comparison of Muscle Function, Bone Mineral Density and Body Composition of Early Starting and Later Starting Older Masters Athletes > Results > Muscle Function and Body Composition
Reported p = .014 · recomputed p = .012
Rated minor: it would not touch a result — a value no result rests on, a p-value that stays on the same side of the significance level, or a conflict that is clerical, resolved elsewhere in the paper, or outside its own findings.
In the paper
“F(1,242) = 0.77, p = 0.412”
§ Comparison of Muscle Function, Bone Mineral Density and Body Composition of Early Starting and Later Starting Older Masters Athletes > Results > Muscle Function and Body Composition
Reported p = .412 · recomputed p = .381
Statistics recomputed
Every reported test result, recomputed from its test statistic and degrees of freedom. A result shows as not adding up only once an independent check has confirmed it.
- Doesn’t add upF(1, 242) = 0.77reported p = .412 · recomputed p = .381
“F(1,242) = 0.77, p = .412”
- Doesn’t add upF(1, 236) = 6.45reported p = .014 · recomputed p = .012
“F(1,236) = 6.45, p = .014”
- ConsistentF(1, 184) = 0.007reported p = .934 · recomputed p = .933
“F(1,184) = 0.007, p = .934”
- ConsistentF(1, 184) = 286reported p < .0005 · recomputed p < .001
“F(1,184) = 286, p < .0005”
- ConsistentF(2, 242) = 15.8reported p < .0005 · recomputed p < .001
“F(2,242) = 15.8, p < .0005”
35 more recomputed tests
Create a free account to see every test the Stats check recomputed.
Self-check
Percentages, sums and reported differences re-computed from the paper’s own numbers.
Each contradiction between two passages listed here was confirmed by an independent check.
Rated minor: it would not touch a result — a value no result rests on, a p-value that stays on the same side of the significance level, or a conflict that is clerical, resolved elsewhere in the paper, or outside its own findings.
In the paper
§ Comparison of Muscle Function, Bone Mineral Density and Body Composition of Early Starting and Later Starting Older Masters Athletes > Materials and Methods > Study Design
“Body mass (kg) | 68.3 ± 8.7 | 55.4 ± 4.7 | 67.5 ± 6.8 | 56.1 ± 7.8 | 80.2 ± 16.2 | 63.1 ± 11.5 | >0.0005 | 0.823 | >0.0005 | >0.0005”
§ Comparison of Muscle Function, Bone Mineral Density and Body Composition of Early Starting and Later Starting Older Masters Athletes > Results > Participant Characteristics
“Body mass and BMI were similar for the ES and LS athletes, but significantly greater for C compared with ES and LS groups (both p < 0.0005).”
Rated minor: it would not touch a result — a value no result rests on, a p-value that stays on the same side of the significance level, or a conflict that is clerical, resolved elsewhere in the paper, or outside its own findings.
In the paper
§ Comparison of Muscle Function, Bone Mineral Density and Body Composition of Early Starting and Later Starting Older Masters Athletes > Materials and Methods > Study Design
“Therefore, the total number of complete datasets available for analysis was 209”
§ Comparison of Muscle Function, Bone Mineral Density and Body Composition of Early Starting and Later Starting Older Masters Athletes > Results > Muscle Function and Body Composition
“F(1,242) = 280, p < 0.0005”
Rated minor: it would not touch a result — a value no result rests on, a p-value that stays on the same side of the significance level, or a conflict that is clerical, resolved elsewhere in the paper, or outside its own findings.
In the paper
“The full cohort included 188 Masters Athletes, of which 33 were sprinters (events less than or equal to 400 m) and 150 were endurance runners (events greater than or equal to 800 m).”
§ Comparison of Muscle Function, Bone Mineral Density and Body Composition of Early Starting and Later Starting Older Masters Athletes > Materials and Methods > Study Design
Reported 188 · recomputed 183
Rated minor: it would not touch a result — a value no result rests on, a p-value that stays on the same side of the significance level, or a conflict that is clerical, resolved elsewhere in the paper, or outside its own findings.
In the paper
§ Comparison of Muscle Function, Bone Mineral Density and Body Composition of Early Starting and Later Starting Older Masters Athletes > Materials and Methods > Study Design
“AGP ranged from 77–92% across the cohort”
§ Comparison of Muscle Function, Bone Mineral Density and Body Composition of Early Starting and Later Starting Older Masters Athletes > Materials and Methods > Study Design
“Age graded performance (%) | 74.5 ± 1.6”
Rated minor: it would not touch a result — a value no result rests on, a p-value that stays on the same side of the significance level, or a conflict that is clerical, resolved elsewhere in the paper, or outside its own findings.
In the paper
§ Comparison of Muscle Function, Bone Mineral Density and Body Composition of Early Starting and Later Starting Older Masters Athletes > Results > Participant Characteristics
“The main reason for greater body mass in C was the higher body fat percentage (Figure 1B).”
§ Comparison of Muscle Function, Bone Mineral Density and Body Composition of Early Starting and Later Starting Older Masters Athletes > Results > Participant Characteristics
“(A) Body fat expressed as a percentage of total body mass, significance assessed when adjusting for Gender [F(1,242) = 44.2, p < 0.01] and age [F(1,242) = 2.07, p = 0.15]. (B) Leg lean mass significance assessed when adjusting for Gender [F(1,242) = 179, p < 0.01] and age [F(1,242) = 8.40, p < 0.01].”
Citations
Cites
Sarcopenia: revised European consensus on definition and diagnosis
Cruz-Jentoft, A. J., Bahat, G., Bauer, J., Boirie, Y., Bruyère, O., Cederholm, T., Cooper, C., Landi, F., Rolland, Y., Sayer, A. A., et al. (2019) · Age and Ageing · doi:10.1093/ageing/afy169 · Cited by 13,818
Lakens, D. (2013) · Frontiers in Psychology · doi:10.3389/fpsyg.2013.00863 · Cited by 10,303
Sarcopenia: revised European consensus on definition and diagnosis
Cruz-Jentoft, A. J., Bahat, G., Bauer, J., Boirie, Y., Bruyère, O., Cederholm, T., Cooper, C., Landi, F., Rolland, Y., Sayer, A. A., et al. (2019) · Age and Ageing · doi:10.1093/ageing/afz046 · Cited by 3,803
Skeletal muscle mass and distribution in 468 men and women aged 18–88 yr
Janssen, I., Heymsfield, S. B., Wang, Z., & Ross, R. (2000) · Journal of Applied Physiology · doi:10.1152/jappl.2000.89.1.81 · Cited by 3,087
Bone “mass” and the “mechanostat”: A proposal
Frost, H. M. (1987) · The Anatomical Record · doi:10.1002/ar.1092190104 · Cited by 2,132
What is the cause of the ageing atrophy?
Lexell, J., Taylor, C. C., & Sjöström, M. (1988) · Journal of the Neurological Sciences · doi:10.1016/0022-510x(88)90132-3 · Cited by 2,075
Mitchell, W. K., Williams, J., Atherton, P., Larvin, M., Lund, J., & Narici, M. (2012) · Frontiers in Physiology · doi:10.3389/fphys.2012.00260 · Cited by 1,377
Physical activity in older age: perspectives for healthy ageing and frailty
McPhee, J. S., French, D. P., Jackson, D., Nazroo, J., Pendleton, N., & Degens, H. (2016) · Biogerontology · doi:10.1007/s10522-016-9641-0 · Cited by 1,369
Self-citationGrip Strength across the Life Course: Normative Data from Twelve British Studies
Dodds, R. M., Syddall, H. E., Cooper, R., Benzeval, M., Deary, I. J., Dennison, E. M., Der, G., Gale, C. R., Inskip, H. M., Jagger, C., et al. (2014) · PLoS ONE · doi:10.1371/journal.pone.0113637 · Cited by 1,221
ACSM Position Stand: Exercise and Physical Activity for Older Adults
Mazzeo, R. S., Cavanagh, P., Evans, W. J., Fiatarone, M., Hagberg, J., McAuley, E., & Startzell, J. (1998) · Medicine & Science in Sports & Exercise · doi:10.1097/00005768-199806000-00033 · Cited by 1,158
Skeletal Muscle Power: A Critical Determinant of Physical Functioning in Older Adults
Reid, K. F., & Fielding, R. A. (2012) · Exercise and Sport Sciences Reviews · doi:10.1097/jes.0b013e31823b5f13 · Cited by 913
Bauer, J. M., Verlaan, S., Bautmans, I., Brandt, K., Donini, L. M., Maggio, M., McMurdo, M. E. T., Mets, T., Seal, C., Wijers, S. L., et al. (2015) · Journal of the American Medical Directors Association · doi:10.1016/j.jamda.2015.05.021 · Cited by 670
Self-citationComparison of cardioprotective benefits of vigorous versus moderate intensity aerobic exercise
Swain, D. P., & Franklin, B. A. (2006) · The American Journal of Cardiology · doi:10.1016/j.amjcard.2005.07.130 · Cited by 660
American College of Sports Medicine Position Stand. Exercise and physical activity for older adults.
(1998) · PubMed · Cited by 634
Frost, H. M. (1987) · PubMed · Cited by 615
The numbers of limb motor neurons in the human lumbosacral cord throughout life
Tomlinson, B. E., & Irving, D. (1977) · Journal of the Neurological Sciences · doi:10.1016/0022-510x(77)90069-7 · Cited by 598
Muscle quality. I. Age-associated differences between arm and leg muscle groups
Lynch, N. A., Metter, E. J., Lindle, R. S., Fozard, J. L., Tobin, J. D., Roy, T. A., Fleg, J. L., & Hurley, B. F. (1999) · Journal of Applied Physiology · doi:10.1152/jappl.1999.86.1.188 · Cited by 595
Tanaka, H., & Seals, D. R. (2008) · The Journal of Physiology · doi:10.1113/jphysiol.2007.141879 · Cited by 554
Ethnicity‐related skeletal muscle differences across the lifespan
Silva, A. M., Shen, W., Heo, M., Gallagher, D., Wang, Z., Sardinha, L. B., & Heymsfield, S. B. (2010) · American Journal of Human Biology · doi:10.1002/ajhb.20956 · Cited by 309
Diet, Nutrition, and Bone Health
Cashman, K. D. (2007) · The Journal of Nutrition · doi:10.1093/jn/137.11.2507s · Cited by 286
Verlaan, S., Aspray, T. J., Bauer, J. M., Cederholm, T., Hemsworth, J., Hill, T. R., McPhee, J. S., Piasecki, M., Seal, C., Sieber, C. C., et al. (2017) · Clinical Nutrition · doi:10.1016/j.clnu.2015.11.013 · Cited by 268
Self-citationThe BPAQ: a bone-specific physical activity assessment instrument
Weeks, B. K., & Beck, B. R. (2008) · Osteoporosis International · doi:10.1007/s00198-008-0606-2 · Cited by 261
O’Keefe, D. J. (2007) · Communication Methods and Measures · doi:10.1080/19312450701641375 · Cited by 249
Physical activity when young provides lifelong benefits to cortical bone size and strength in men
Warden, S. J., Mantila Roosa, S. M., Kersh, M. E., Hurd, A. L., Fleisig, G. S., Pandy, M. G., & Fuchs, R. K. (2014) · Proceedings of the National Academy of Sciences · doi:10.1073/pnas.1321605111 · Cited by 235
Vlietstra, L., Hendrickx, W., & Waters, D. L. (2018) · Australasian Journal on Ageing · doi:10.1111/ajag.12521 · Cited by 216
Exercise When Young Provides Lifelong Benefits to Bone Structure and Strength
Warden, S. J., Fuchs, R. K., Castillo, A. B., Nelson, I. R., & Turner, C. H. (2006) · Journal of Bone and Mineral Research · doi:10.1359/jbmr.061107 · Cited by 194
Piasecki, M., Ireland, A., Piasecki, J., Stashuk, D. W., Święcicka, A., Rutter, M. K., Jones, D. A., & McPhee, J. S. (2018) · The Journal of Physiology · doi:10.1113/jp275520 · Cited by 192
Self-citationMoore, A. Z., Caturegli, G., Metter, E. J., Makrogiannis, S., Resnick, S. M., Harris, T. B., & Ferrucci, L. (2014) · Journal of the American Geriatrics Society · doi:10.1111/jgs.12653 · Cited by 144
Exploring the public health potential of a mass community participation event
Stevinson, C. D., & Hickson, M. (2013) · Journal of Public Health · doi:10.1093/pubmed/fdt082 · Cited by 141
Relation between whole-body and regional measures of human skeletal muscle.
Jung Lee, S., Janssen, I., Heymsfield, S. B., & Ross, R. (2004) · The American Journal of Clinical Nutrition · doi:10.1093/ajcn/80.5.1215 · Cited by 132
McPhee, J. S., Cameron, J., Maden‐Wilkinson, T., Piasecki, M., Yap, M. H., Jones, D. A., & Degens, H. (2018) · The Journals of Gerontology Series A · doi:10.1093/gerona/gly040 · Cited by 132
Self-citationMechanical muscle function, morphology, and fiber type in lifelong trained elderly
AAGAARD, P., MAGNUSSON, P. S., LARSSON, B., KJÆR, M., & KRUSTRUP, P. (2007) · Medicine & Science in Sports & Exercise · doi:10.1249/mss.0b013e31814fb402 · Cited by 128
Ultrasound imaging of the quadriceps muscle in elderly athletes and untrained men
Sipilä, S., & Suominen, H. (1991) · Muscle & Nerve · doi:10.1002/mus.880140607 · Cited by 127
Piasecki, M., Ireland, A., Coulson, J., Stashuk, D. W., Hamilton-Wright, A., Święcicka, A., Rutter, M. K., McPhee, J. S., & Jones, D. A. (2016) · Physiological Reports · doi:10.14814/phy2.12987 · Cited by 125
Self-citationWilks, D. C., Winwood, K., Gilliver, S. F., Kwiet, A., Chatfield, M., Michaelis, I., Sun, L. W., Ferretti, J. L., Sargeant, A. J., Felsenberg, D., et al. (2009) · Bone · doi:10.1016/j.bone.2009.03.660 · Cited by 119
Upper Limb Muscle–Bone Asymmetries and Bone Adaptation in Elite Youth Tennis Players
Ireland, A., Maden‐Wilkinson, T., McPhee, J. S., Cooke, K., Narici, M. V., Degens, H., & Rittweger, J. (2013) · Medicine & Science in Sports & Exercise · doi:10.1249/mss.0b013e31828f882f · Cited by 112
Self-citationMaster Athletes Are Extending the Limits of Human Endurance
Lepers, R., & Stapley, P. J. (2016) · Frontiers in Physiology · doi:10.3389/fphys.2016.00613 · Cited by 112
Muscle morphology and performance in master athletes: A systematic review and meta-analyses
Mckendry, J., Breen, L., Shad, B. J., & Greig, C. A. (2018) · Ageing Research Reviews · doi:10.1016/j.arr.2018.04.007 · Cited by 111
Couppé, C., Svensson, R. B., Grosset, J.-F., Kovanen, V., Nielsen, R. H., Olsen, M. R., Larsen, J. O., Praet, S. F. E., Skovgaard, D., Hansen, M., et al. (2014) · AGE · doi:10.1007/s11357-014-9665-9 · Cited by 109
Motor unit survival in lifelong runners is muscle dependent.
POWER, G. A., DALTON, B. H., BEHM, D. G., DOHERTY, T. J., VANDERVOORT, A. A., & RICE, C. L. (2012) · Medicine & Science in Sports & Exercise · doi:10.1249/mss.0b013e318249953c · Cited by 99
Mikkelsen, U. R., Couppé, C., Karlsen, A., Grosset, J. F., Schjerling, P., Mackey, A. L., Klausen, H. H., Magnusson, S. P., & Kjær, M. (2013) · Mechanisms of Ageing and Development · doi:10.1016/j.mad.2013.11.004 · Cited by 96
Low bone mineral density in highly trained male master cyclists
Palmer, J. E., Levy, S. S., & Nichols, J. F. (2003) · Osteoporosis International · doi:10.1007/s00198-003-1418-z · Cited by 92
Grados, F., Brazier, M., Kamel, S., Duver, S., Heurtebize, N., Maamer, M., Mathieu, M., Garabédian, M., Sebert, J., & Fardellone, P. (2003) · Joint Bone Spine · doi:10.1016/s1297-319x(03)00046-0 · Cited by 90
Physical activity and sarcopenia in the geriatric population: a systematic review.
Lee, S.-Y., Tung, H.-H., Liu, C.-Y., & Chen, L.-K. (2018) · Journal of the American Medical Directors Association · doi:10.1016/j.jamda.2018.02.003 · Cited by 87
Physical Activity Patterns and Mortality: The Weekend Warrior and Activity Bouts
Shiroma, E. J., Lee, I.-M. M., Schepps, M. A., Kamada, M., & Harris, T. B. (2018) · Medicine & Science in Sports & Exercise · doi:10.1249/mss.0000000000001762 · Cited by 85
Grados, F., Brazier, M., Kamel, S., Mathieu, M., Hurtebize, N., Maamer, M., Garabédian, M., Sebert, J., & Fardellone, P. (2003) · The Journal of Clinical Endocrinology & Metabolism · doi:10.1210/jc.2002-021968 · Cited by 74
Johansson, J., Nordström, A., & Nordström, P. (2015) · Bone · doi:10.1016/j.bone.2015.07.001 · Cited by 71
Pollock, R. D., O’Brien, K. A., Daniels, L. J., Nielsen, K. B., Rowlerson, A. M., Duggal, N. A., Lazarus, N. R., Lord, J. M., Philp, A., & Harridge, S. D. R. (2018) · Aging Cell · doi:10.1111/acel.12735 · Cited by 67
Landi, F., Calvani, R., Picca, A., Tosato, M., Martone, A. M., D’Angelo, E., Serafini, E., Bernabei, R., & Marzetti, E. (2018) · PLoS ONE · doi:10.1371/journal.pone.0191820 · Cited by 65
Diagnostic measures for sarcopenia and bone mineral density.
Bijlsma, A. Y., Meskers, M. C. G., Molendijk, M., Westendorp, R. G. J., Sipilä, S., Stenroth, L., Sillanpää, E., McPhee, J. S., Jones, D. A., Narici, M., et al. (2013) · Osteoporosis International · doi:10.1007/s00198-013-2376-8 · Cited by 57
Self-citationMcPhee, J. S., Hogrel, J., Maier, A. B., Seppet, E. K., Seynnes, O., Sipilä, S., Bottinelli, R., Barnouin, Y., Bijlsma, A. Y., Gapeyeva, H., et al. (2013) · Biogerontology · doi:10.1007/s10522-013-9434-7 · Cited by 57
Self-citationTriceps surae muscle-tendon properties in older endurance- and sprint-trained athletes.
Stenroth, L., Cronin, N. J., Peltonen, J., Korhonen, M. T., Sipilä, S., & Finni, T. (2016) · Journal of Applied Physiology · doi:10.1152/japplphysiol.00511.2015 · Cited by 56
Piasecki, M., Ireland, A., Piasecki, J., Degens, H., Stashuk, D. W., Swiecicka, A., Rutter, M. K., Jones, D. A., & McPhee, J. S. (2019) · Frontiers in Physiology · doi:10.3389/fphys.2019.00449 · Cited by 55
Self-citationIreland, A., Maden-Wilkinson, T., Ganse, B., Degens, H., & Rittweger, J. (2014) · Osteoporosis International · doi:10.1007/s00198-014-2617-5 · Cited by 54
Self-citationPiasecki, J., McPhee, J. S., Hannam, K., Deere, K. C., Elhakeem, A., Piasecki, M., Degens, H., Tobias, J. H., & Ireland, A. (2018) · Archives of Osteoporosis · doi:10.1007/s11657-018-0486-9 · Cited by 50
Self-citationHannam, K., Deere, K. C., Hartley, A., Al-Sari, U. A., Clark, E. M., Fraser, W. D., & Tobias, J. H. (2017) · Osteoporosis International · doi:10.1007/s00198-016-3863-5 · Cited by 48
Self-citationRingsberg, K., Gärdsell, P., Johnell, O., Josefsson, P. O., & Obrant, K. J. (2001) · Gerontology · doi:10.1159/000052765 · Cited by 44
MacKelvie, K. J., Taunton, J. E., McKay, H. A., & Khan, K. M. (2000) · British Journal of Sports Medicine · doi:10.1136/bjsm.34.4.273 · Cited by 44
Sprinters versus long-distance runners: how to grow old healthy.
Kusy, K., & Zieliński, J. (2015) · Exercise and Sport Sciences Reviews · doi:10.1249/jes.0000000000000033 · Cited by 41
Sprint Acceleration Mechanics in Masters Athletes
Pantoja, P. D., de Villarreal, E. S., Brisswalter, J., Peyré‐Tartaruga, L. A., & Morin, J.-B. (2016) · Medicine & Science in Sports & Exercise · doi:10.1249/mss.0000000000001039 · Cited by 39
The effect of moderate impact exercise on skeletal integrity in master athletes
Velez, N. F., Zhang, A., Stone, B., Perera, S., Miller, M., & Greenspan, S. L. (2008) · Osteoporosis International · doi:10.1007/s00198-008-0590-6 · Cited by 38
Deere, K. C., Hannam, K. J., Coulson, J., Ireland, A., McPhee, J. S., Moss, C. L., Edwards, M. H., Dennison, E. M., Cooper, C. C., Sayers, A. E., et al. (2015) · Journal of Aging and Physical Activity · doi:10.1123/japa.2015-0066 · Cited by 38
Self-citationHannam, K. J., Deere, K. C., Hartley, A. E., Clark, E., Coulson, J., Ireland, A., Moss, C., Edwards, M. H., Dennison, E. M., Gaysin, T., et al. (2016) · Osteoporosis International · doi:10.1007/s00198-016-3810-5 · Cited by 37
Self-citationCoulson, J., Bagley, L., Barnouin, Y., Bradburn, S., Butler-Browne, G., Gapeyeva, H., Hogrel, J.-Y., Maden-Wilkinson, T., Maier, A. B., Meskers, C., et al. (2017) · Osteoporosis International · doi:10.1007/s00198-017-4104-2 · Cited by 37
Self-citationBagley, L., McPhee, J. S., Ganse, B., Müller, K., Korhonen, M. T., Rittweger, J., & Degens, H. (2019) · Scandinavian Journal of Medicine & Science in Sports · doi:10.1111/sms.13404 · Cited by 35
Self-citationSanada, K., Miyachi, M., Tabata, I., Suzuki, K., Yamamoto, K., Kawano, H., Usui, C., & Higuchi, M. (2009) · Journal of Sports Sciences · doi:10.1080/02640410903081852 · Cited by 32
Wilks, D. C., Winwood, K. L., Gilliver, S. F., Kwiet, A., Sun, L. W., Gutwasser, C., Ferretti, J. L., Sargeant, A. J., Felsenberg, D., & Rittweger, J. (2009) · PubMed · Cited by 29
Bruce, B., Fries, J. F., & Hubert, H. (2008) · American Journal of Public Health · doi:10.2105/ajph.2007.119909 · Cited by 28
Bone mineral density and bone turnover in male masters athletes aged 40–64
Nowak, A., Straburzyńska-Lupa, A., Kusy, K., Zieliński, J., Felsenberg, D., Rittweger, J., Karolkiewicz, J., Straburzyńska-Migaj, E., & Pilaczyńska-Szcześniak, Ł. (2010) · The Aging Male · doi:10.3109/13685531003657776 · Cited by 25
Hannam, K. J., Clark, E., Hartley, A., Sayer, A. A., Tobias, J. H., & Gregson, C. L. (2017) · Europe PMC (PubMed Central) · doi:10.25405/ncl.34315671 · Cited by 23
Self-citationBone density and neuromuscular function in older competitive athletes depend on running distance
Gast, U., Belavý, D. L., Armbrecht, G., Kusy, K., Lexy, H., Rawer, R., Rittweger, J., Winwood, K., Zieliński, J., & Felsenberg, D. (2013) · Osteoporosis International · doi:10.1007/s00198-012-2234-0 · Cited by 22
Guo, Y., Wang, Y., Chen, F., Wang, J., & Wang, D. (2020) · Journal of Diabetes Research · doi:10.1155/2020/1508258 · Cited by 22
Fien, S., Climstein, M., Quilter, C., Buckley, G., Henwood, T., Grigg, J., & Keogh, J. W. L. (2017) · PeerJ · doi:10.7717/peerj.3768 · Cited by 21
Elhakeem, A., Hannam, K., Deere, K. C., Hartley, A., Clark, E. M., Moss, C., Edwards, M. H., Dennison, E., Gaysin, T., Kuh, D., et al. (2018) · The Journals of Gerontology: Series A · doi:10.1093/gerona/glx176 · Cited by 14
Self-citationIreland, A., Degens, H., Ganse, B., Maden-Wilkinson, T. M., Wilks, D. C., & Rittweger, J. (2015) · Journal of Orthopaedic Translation · doi:10.1016/j.jot.2015.04.001 · Cited by 7
Self-citation(2011) · PubMed
Self-citation(2008) · PubMed
Cited by
Strasser, B., Wolters, M., Weyh, C., Krüger, K., & Ticinesi, A. (2021) · Nutrients · doi:10.3390/nu13062045 · Cited by 193
Piasecki, J., Inns, T. B., Bass, J. J., Scott, R., Stashuk, D. W., Phillips, B. E., Atherton, P. J., & Piasecki, M. (2020) · The Journal of Physiology · doi:10.1113/jp280679 · Cited by 52
Self-citationProtein Requirements for Master Athletes: Just Older Versions of Their Younger Selves
Moore, D. R. (2021) · Sports Medicine · doi:10.1007/s40279-021-01510-0 · Cited by 33
Nutrition for Older Athletes: Focus on Sex-Differences
Strasser, B., Pesta, D., Rittweger, J., Burtscher, J., & Burtscher, M. (2021) · Nutrients · doi:10.3390/nu13051409 · Cited by 25
Kopiczko, A., Adamczyk, J. G., Gryko, K., & Popowczak, M. (2021) · European Review of Aging and Physical Activity · doi:10.1186/s11556-021-00262-0 · Cited by 24
Metadata
- Authors
- Piasecki, J., Ireland, A., Piasecki, M., Deere, K., Hannam, K., Tobias, J., & McPhee, J. S.
- Affiliations
- Nottingham Trent University (GB)
- Manchester Metropolitan University (GB)
- University of Nottingham (GB)
- University of Bristol (GB)
- Corresponding author
- McPhee, Jamie S.
- Venue
- Frontiers in Physiology
- Publisher
- Frontiers Media SA
- Published
- 2019-08-27
- Volume
- 10
- Pages
- 1050-1050
- ISSN
- 1664-042X (ISSN-L)
- PMC
- PMC6719569
- OpenAlex
- W2966821848
- Semantic Scholar
- 3e95f5bafe383389a0e2222a42dc513f661a853a
- Cited by
- 24
- References
- 77
- Citations by year
- 2026: 1 · 2025: 2 · 2024: 2 · 2023: 4 · 2022: 3 · 2021: 7 · 2020: 5
- FWCI
- 3.84
- Type
- journal article
- Language
- en
- Open access
- gold
- doi.org
- Licence
- Locations
- Frontiers in Physiology (publishedVersion, cc-by)
- PubMed (publishedVersion)
- Repository@Nottingham (University of Nottingham) (publishedVersion, cc-by)
- PubMed Central (publishedVersion, cc-by)
- e-space (Manchester Metropolitan University) (acceptedVersion)
- Nottingham Trent University's Institutional Repository (Nottingham Trent Repository) (acceptedVersion)
- Repository@Nottingham (University of Nottingham) (submittedVersion, cc-by)
- DOAJ (DOAJ: Directory of Open Access Journals) (submittedVersion, cc-by-sa)
- Figshare (submittedVersion, cc-by)
- Bristol Research (University of Bristol) (submittedVersion, cc-by)
- Explore Bristol Research (submittedVersion, cc-by)
- Frontiers in Physiology (cc-by)
- Funders
- European Commission (223576)
- Medical Research Council (MR/K024973/1)
- Topics
- Health Sciences › Medicine › Orthopedics and Sports Medicine › Sports Performance and Training
- Health Sciences › Medicine › Physiology (medical) › Cardiovascular and exercise physiology
- Health Sciences › Medicine › Public Health, Environmental and Occupational Health › Physical Activity and Health
- Keywords
- masters athletes, endurance running, healthy aging, muscle function, bone mineral density, body composition, fat mass, leg lean mass, exercise intensity, output power, older adults
About these checks
Registry, retraction, Cites and statistics results are computed, not judged, with one exception: a printed reference that no index lists is read once by a model before it counts as a citation error. Claims are extracted by a model and kept only when their quote appears verbatim in the text; each cited source is then checked, with a model’s help, for whether it says what the claim relies on. Those verdicts can be wrong — read the claim’s quote and the cited source before relying on one.
A language model drew the claims from the paper on 2026-11-14, under version 3 of the claim definition (model deepseek-v4.1-flash, prompt extract-v3).
A second model labelled each claim on 2026-11-14 (model jev-1.13-20260917, definition revision gold-guideline-v0.2).
Statistics and arithmetic are recomputed, not judged.
Confidence bands are shown only for fields calibrated on our annotated test set. None is calibrated yet, so no band is shown.
What counts as a claim ›How we measure confidence ›How we check this ›
Are you an author, or do you see a problem with this page? Request a review
Data sources
Bibliographic data: Semantic Scholar, OpenAlex, Crossref.
Contains information from the Semantic Scholar Academic Graph Datasets, made available under the ODC Attribution License (ODC-BY 1.0).
Semantic Scholar’s data is described in: Kinney, R., et al. (2023). The Semantic Scholar Open Data Platform. arXiv:2301.10140.
