

The DOI matches its Crossref record; 86 of the 86 references it cites were found in a registry or an index; 12 of the 50 sources its claims cite were checked for support.
Neurocognitive function among individuals with problematic social media use
Open accessAbstract
Background: With the development of technology and the internet, social networks gained momentum quickly and play a central role in daily activities. Despite this, there is a public health concern over excessive or problematic social media use. There is also a debate whether excessive social media use should be considered as a behavioral addiction characterized by impulsivity or an impulse control disorder characterized by compulsivity. The goal of this study is to use neurocognitive tasks to investigate impulsivity and compulsivity among excessive social media users compared with non-excessive users. Method: The study included 79 participants (age range 18 to 37), divided into two groups: 34 participants who excessively use social media (Mean Age = 23.03, SD = 2.71) and 45 participants who do not excessively use social media (Mean Age = 25.47, SD = 4.3). Participants filled out a demographic questionnaire, questionnaires on social media use, impulsivity, compulsivity, anxiety, and depression. They performed computerized cognitive tasks: GO/NO-GO (with Facebook and traffic sign pictures), Experimental Delay Discounting (EDT), and the Wisconsin Card Sorting Test (WCST). Results: Excessive users of social media exhibited a lower ability to delay gratification on the EDT, indicating impulsivity. They made fewer non-perseverative errors on the WCST, which indicated high flexibility and test shifting, which is a contradicting evidence for compulsivity. Furthermore, on the GO/NO-GO task, individuals who excessively use social media made more omission errors in response to the “Facebook” sign compared to traffic signs (GO condition), indicating impaired selective attention. Finally, they also showed higher subjective ratings of anxiety, depression, impulsivity, and compulsivity. Discussion: The results of this study provide evidence for impulsivity indicated by delay discounting tendency, which supports the behavioral addiction model, impaired selection attention and lack of evidence for compulsivity in excessive social media users. Further research on neurocognitive function in excessive social media users is required in order to determine whether it should be considered a behavioral addiction or an impulse control disorder.
Overview
CoChat Summary
## TL;DR
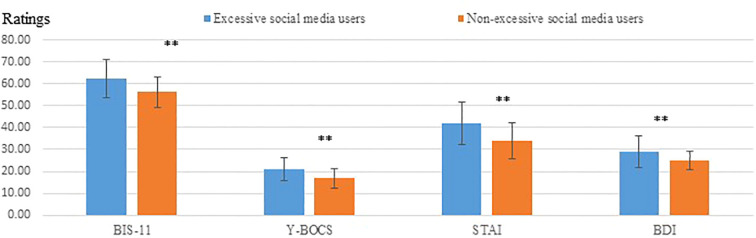
This cross-sectional study compared 34 “excessive” and 45 “non-excessive” social media users on questionnaires and computerized tasks and found stronger evidence for impulsivity than compulsivity in the excessive-use group. Excessive users showed higher delay discounting, higher BIS-11, Y-BOCS, trait anxiety, and BDI scores, but no clear inhibition deficit and no evidence of WCST-based inflexibility.
## Key findings
- Excessive social media users scored higher than non-excessive users on the BIS-11: F(1,76) = 8.7, p = .004, ηp² = .103.
- Excessive users scored higher on the Y-BOCS: F(1,76) = 9.11, p = .003, ηp² = .107; they also had higher trait anxiety (M = 42.41, SD = 9.68 vs M = 33.75, SD = 8.36; F(1,76) = 11.5, p = .001, ηp² = .131) and BDI scores (M = 29.47, SD = 7.22 vs M = 24.47, SD = 4.25; F(1,76) = 9.62, p = .003, ηp² = .112).
- On the EDT, excessive users showed steeper delay discounting: K = -0.1 (SD = 0.1) vs -0.04 (SD = 0.1); F(1,75) = 4.55, p = .04, ηp² = .06.
- On the GO/NO-GO, there was no group difference in overall reaction time or errors, but excessive users made more omission errors to “Facebook” signs (t(96) = -2.26, p = .026, ηp² = .12). On the WCST, excessive users made fewer non-perseverative errors (M = 4.84, SD = 2.16 vs M = 6.38, SD = 4.02; F(1,73) = 4.5, p = .037, ηp² = .058), with no difference in perseverative errors.
## Methods
- Design: Cross-sectional comparison of excessive vs non-excessive social media users.
- Sample/data: 79 participants aged 18–37 (16 males, 63 females), with 34 classified as excessive users and 45 as non-excessive users using the BSMAS cut-off of 19; 4 participants were excluded for inadequate task performance.
- Analysis: Group comparisons used ANCOVA (age as covariate) for questionnaires and tasks; the GO/NO-GO used a two-way mixed repeated-measures ANCOVA; the WCST used one-way ANCOVAs; Pearson correlations tested links between questionnaire scores and task performance.
## Limitations
- The paper explicitly states that this was a cross-sectional study, so causality cannot be inferred.
- The authors note the sample was mostly women (80%), which may affect task performance on impulsivity measures; this is a stated limitation, and the text also makes evident that the sample is gender-imbalanced.
- The authors state that the BSMAS cut-off of 19 may create classification bias because it is a lenient threshold; this is a stated limitation.
- The authors state there was no correlation between subjective reports and cognitive-task performance, and that assessing compulsivity with cognitive tasks is problematic; the text also makes evident that some data were incomplete due to technical reasons and that participants were recruited from university/social-network sources, which may limit generalizability.
Model-written summary. Check it against the paper before relying on it.
Integrity signals
Registry
Cites
Statistics
Figures



Verification
Claims the paper makes
9 Valid · 3 Not valid · 33 Not checked · 59 Own results and interpretations
At least one cited source doesn’t support this claim or points to a different paper, and none confirmed it — see the verdicts below.
In the paper
“There is little evidence for impaired cognitive and executive function in excessive social media users.”
What the sources say
- Not checked yetcites [9] Aydın, 2020, Associations between executive functions and problematic social networking sites use, J Clin Exp Neuropsychol. source
- Disputedcites [10] Gao, 2019, Inhibitory control in excessive social networking users: evidence from an event-related potential-based go-nogo task, Front Psychol sourceExperimental — accuracy not yet measured
Our copy of Gao et al. (2019) concludes the opposite of the claim: the Abstract and the Discussion's closing paragraph report that excessive SNS users showed larger N2 and smaller Nogo-P3 amplitudes than non-excessive users, indicating they are 'inefficient in allocating monitoring resources' and 'show difficulty in late inhibitory control procedure' — i.e., electrophysiological evidence of impaired inhibitory control, a core executive function. The only part of the claim the paper supports is the null behavioural result (Results, Behavioral Results: main effect of group not significant for accuracy, RT and signal-detection indices; Discussion: 'No differences between excessive users and non-excessive users were observed at the behavioral level'), which the authors themselves attribute to insensitive behavioural measures rather than to an absence of impairment. The paper also does not address cognitive/executive function broadly, and its sample is 42 Chinese young-adult WeChat/QQ users, so 'little evidence for impaired cognitive and executive function in excessive social media users' overstates and inverts what this source reports. (LLM, conf=0.82)
Checked by a reasoning model — may be wrong.
plain- Asserted: passes — The authors put it forward as true.
- Checkable: passes — It can be checked against evidence.
- Load-bearing: unclear — It is unclear whether the paper’s conclusions depend on it.
- Based: passes — The paper gives a reason why it holds.
The cited sources support only part of this claim — read each source’s verdict below.
In the paper
“These findings indicate that tasks that measure flexibility and set-shifting, like the WCST, may be suitable to measure compulsivity.”
What the sources say
- Supportedcites [13] Fineberg, 2014, New developments in human neurocognition: clinical, genetic, and brain imaging correlates of impulsivity and compulsivity, CNS Spectr source
The Compulsivity section describes flexibility and set-shifting tasks as neurocognitive measures of compulsivity. The treatment-response section identifies perseveration errors on the WCST as a measure relating to cognitive flexibility. Together, these support the qualified claim that a task like the WCST may be suitable for measuring compulsivity; page numbers are unavailable in our copy. (LLM, conf=0.90)
- Not checked yetcites [14] Abbruzzese, 1995, Wisconsin card sorting test performance in obsessive-compulsive disorder: no evidence for involvement of dorsolateral prefrontal cortex, Psychiatry Res source
- Partly supportedcites [15] Watkins, 2005, Executive function in Tourette’s syndrome and obsessive-compulsive disorder, Psychol Med sourceExperimental — accuracy not yet measured
In Cognitive performance in OCD (p. 9), the authors link impaired cognitive flexibility and set-shifting to compulsive tendencies, supporting the proposed use of such tasks. However, their study used an attentional set-shifting test, not the WCST; the WCST is mentioned only in a discussion of an earlier Tourette’s study (p. 10). This paper therefore does not establish the WCST specifically as suitable for measuring compulsivity. (LLM, conf=0.84)
hedgedstates an association- Asserted: passes — The authors put it forward as true.
- Checkable: passes — It can be checked against evidence.
- Load-bearing: passes — The paper’s conclusions depend on it.
- Based: passes — The paper gives a reason why it holds.
- Supported
Every source the paper cites for this claim was checked and supports it.
In the paper
“Impulsivity, executive functions, and decision-making are key features of addictive behaviors, yet research on these functions in problematic social-network use is rare, and there are inconsistent findings ( 25 ).”
What the sources say
- Supportedcites [25] Müller, 2021, Deficits in executive functions but not in decision making under risk in individuals with problematic social-network use, Comp Psychiatry source
The Introduction states that impulsivity, executive functions, and decision making are critically involved in addictive behaviors, while research on these functions in problematic social-network use is fragmented and its findings inconsistent. It also describes mixed findings for executive functions and risky decision making. (LLM, conf=0.95)
plain- Asserted: passes — The authors put it forward as true.
- Checkable: passes — It can be checked against evidence.
- Load-bearing: passes — The paper’s conclusions depend on it.
- Based: passes — The paper gives a reason why it holds.
- Supported
The cited sources support only part of this claim — read each source’s verdict below.
In the paper
“Impulsivity, executive functions, and decision-making are key features of addictive behaviors, yet research on these functions in problematic social-network use is rare, and there are inconsistent findings ( 25 ).”
What the sources say
- Partly supportedcites [25] Müller, 2021, Deficits in executive functions but not in decision making under risk in individuals with problematic social-network use, Comp Psychiatry sourceExperimental — accuracy not yet measured
The Introduction (page unavailable) says research on these functions in problematic social-network use is fragmented and its findings inconsistent. It specifically calls research on risky decision-making relatively rare, but does not characterize research on impulsivity and executive functions as rare. (LLM, conf=0.82)
plain- Asserted: passes — The authors put it forward as true.
- Checkable: passes — It can be checked against evidence.
- Load-bearing: passes — The paper’s conclusions depend on it.
- Based: passes — The paper gives a reason why it holds.
- Partly supported
A result the paper reports from its own data — it cites no other source for it, so there is none to check. The quote shows it is in the paper.
In the paper
“high scores on the BIS-11 questionnaire that measures impulsivity”
plainstates an association- Asserted: passes — The authors put it forward as true.
- Checkable: passes — It can be checked against evidence.
- Load-bearing: passes — The paper’s conclusions depend on it.
- Based: passes — The paper gives a reason why it holds.
40 more claims
Create a free account to see all 104 claims and to verify the 38 references still open.
- Probably not a substantial claim. 42
- It may state two separate claims as one. 29
- The quote only partly states this claim. 2
Statistics that don’t add up
Each reported p-value recomputed from its test statistic and degrees of freedom.
Rated minor: it would not touch a result — a value no result rests on, a p-value that stays on the same side of the significance level, or a conflict that is clerical, resolved elsewhere in the paper, or outside its own findings.
In the paper
“F (1, 75) = 4.02, p = .04”
Reported p = .04 · recomputed p = .049
Statistics recomputed
Every reported test result, recomputed from its test statistic and degrees of freedom. A result shows as not adding up only once an independent check has confirmed it.
- Doesn’t add upF(1, 75) = 4.02reported p = .04 · recomputed p = .049
“F (1, 75) = 4.02, p = .04”
- ConsistentF(1, 78) = 106.5reported p = .01 · recomputed p < .001
“F (1, 78) = 106.5, p = .01”
The paper prints p at a floor (such as p < .001)
- ConsistentF(1, 76) = 8.7reported p = .004 · recomputed p = .004
“F (1, 76) = 8.7, p = .004”
- ConsistentF(1, 76) = 9.11reported p = .003 · recomputed p = .003
“F (1, 76) = 9.11, p = .003”
- ConsistentF(1, 76) = 11.5reported p = .001 · recomputed p = .001
“F (1, 76) = 11.5, p = .001”
16 more recomputed tests
Create a free account to see every test the Stats check recomputed.
Self-check
Percentages, sums and reported differences re-computed from the paper’s own numbers.
Each contradiction between two passages listed here was confirmed by an independent check.
Rated major: it would touch a result — a value a result rests on, reported and recomputed p-values on opposite sides of the significance level, two passages that conflict with no sign which is right, or a cited work retracted before this paper was published.
In the paper
“The total mean K score of the excessive social media use was -0.1 (S.D. = 0.1), and the total mean score of the non-excessive social media use was -0.04 (S.D. = 0.1), suggesting that the excessive social media users had steeper slopes and were more impulsive.”
“Higher k-values indicate more rapid discounting, which has been defined as more impulsive”
Rated major: it would touch a result — a value a result rests on, reported and recomputed p-values on opposite sides of the significance level, two passages that conflict with no sign which is right, or a cited work retracted before this paper was published.
In the paper
“omission errors, which were falsely pressing the button in “NO-GO” trials.”
“The higher number of omission errors to “Facebook” signs in the GO condition in excessive social media users may indicate impaired attention and not inhibition, since participants are required to respond to the sign (GO)”
Rated minor: it would not touch a result — a value no result rests on, a p-value that stays on the same side of the significance level, or a conflict that is clerical, resolved elsewhere in the paper, or outside its own findings.
In the paper
“This number is expected to increase to almost six billion by 2027.”
“In October 2025, over 6.04 billion people worldwide used social media”
Rated minor: it would not touch a result — a value no result rests on, a p-value that stays on the same side of the significance level, or a conflict that is clerical, resolved elsewhere in the paper, or outside its own findings.
In the paper
“but there was significant group effect”
“F (1, 75) = 1.32, p=.25, ηp 2 = .02) or sign type effect (F (1, 75) = 1.43, p=.23, ηp 2 = .02)”
Citations
Cites
Diagnostic and Statistical Manual of Mental Disorders
American Psychiatric Association (2013) · doi:10.1176/appi.books.9780890425596 · Cited by 116,369
Statistical power analyses using G∗Power 3.1: tests for correlation and regression analyses
Faul, F., Erdfelder, E., Buchner, A., & Lang, A.-G. (2009) · Behavior Research Methods · doi:10.3758/brm.41.4.1149 · Cited by 37,615 · cited 1×
“Power calculation of the ANOVA model was conducted using G*Power 3.1.9.7 (57, 58) based on ANCOVA and two-way mixed-design repeated-measures ANCOVA in accordance with the relevant literature (11).”
InfluentialDiamond, A. (2013) · Annual Review of Psychology · doi:10.1146/annurev-psych-113011-143750 · Cited by 13,268 · cited 1×
“Inhibitory control includes the ability to control attention in order to avoid internal urges, and to act appropriately; without inhibitory control, we would act upon impulses and old habits (74).”
Psychometric properties of the Beck Depression Inventory: Twenty-five years of evaluation
Beck, A. T., Steer, R. A., & Carbin, M. G. (1988) · Clinical Psychology Review · doi:10.1016/0272-7358(88)90050-5 · Cited by 11,696
The Yale-Brown Obsessive Compulsive Scale: I. Development, Use, and Reliability
Goodman, W. K. (1989) · Archives of General Psychiatry · doi:10.1001/archpsyc.1989.01810110048007 · Cited by 7,712
A “components” model of addiction within a biopsychosocial framework
Griffiths, M. (2005) · Journal of Substance Use · doi:10.1080/14659890500114359 · Cited by 3,088
Sample size determination and power analysis using the G*Power software
Kang, H. (2021) · Journal of Educational Evaluation for Health Professions · doi:10.3352/jeehp.2021.18.17 · Cited by 2,572 · cited 1×
“Power calculation of the ANOVA model was conducted using G*Power 3.1.9.7 (57, 58) based on ANCOVA and two-way mixed-design repeated-measures ANCOVA in accordance with the relevant literature (11).”
InfluentialEvaluation of a behavioral measure of risk taking: The balloon analogue risk task (BART)
Lejuez, C. W., Read, J. P., Kahler, C. W., Richards, J. B., Ramsey, S. E., Stuart, G. L., Strong, D. R., & Brown, R. A. (2002) · Journal of Experimental Psychology: Applied · doi:10.1037/1076-898x.8.2.75 · Cited by 2,336
A Note on Measurement of Utility
Samuelson, P. A. (1937) · The Review of Economic Studies · doi:10.2307/2967612 · Cited by 2,164
Andreassen, C. S., Billieux, J., Griffiths, M. D., Kuss, D. J., Demetrovics, Z., Mazzoni, E., & Pallesen, S. (2016) · Psychology of Addictive Behaviors · doi:10.1037/adb0000160 · Cited by 2,095 · cited 2×
“Although excessive social media users show evidence for subjective compulsivity (5), few studies have used computerized cognitive tasks assessing compulsivity in them.”
Research works printed but not linked: 6
- 2014, Public health implications of excessive use of the internet, computers, smartphones and similar electronic devices
- Spielberger, 1983, Manual for the State-Trait Anxiety Inventory
- Mazur, 1987, An adjusting procedure for studying delayed reinforcement, 55
- Rachlin, 2000, The Science of Self-Control
- Loewenstein, 1992, The fall and rise of psychological explanations in the economics of intertemporal choice
- Posner, 1998, Executive attention: conflict, target detection, and cognitive control
Metadata
- Authors
- Almog, I., Mama, Y., & Weinstein, A. M.
- Affiliations
- Ariel University (IL)
- Corresponding author
- Weinstein, Aviv M
- ORCID
- Mama, Yaniv
- Venue
- Frontiers in Psychiatry
- Publisher
- Frontiers Media SA
- Published
- 2026-05-18
- Volume
- 17
- Pages
- 1825888-1825888
- ISSN
- 1664-0640 (ISSN-L)
- PMC
- PMC13223338
- OpenAlex
- W7161539425
- Cited by
- 1
- References
- 86
- Citations by year
- 2026: 1
- FWCI
- 11.24
- Type
- journal article
- Language
- en
- Open access
- gold
- doi.org
- Licence
- Locations
- Frontiers in Psychiatry (publishedVersion, cc-by)
- PubMed (publishedVersion)
- PubMed Central (publishedVersion, cc-by)
- DOAJ (DOAJ: Directory of Open Access Journals) (submittedVersion, cc-by-sa)
- Topics
- Social Sciences › Sociology and Political Science › Impact of Technology on Adolescents
- Social Sciences › Psychology › Clinical Psychology › Gambling Behavior and Treatments
- Social Sciences › Psychology › Clinical Psychology › Sexuality, Behavior, and Technology
- Keywords
- social media addiction, excessive social media use, impulsivity, compulsivity, behavioral addiction, impulse control disorders, delay discounting, selective attention, cognitive flexibility, anxiety, depression, neurocognitive function
About these checks
Registry, retraction, Cites and statistics results are computed, not judged, with one exception: a printed reference that no index lists is read once by a model before it counts as a citation error. Claims are extracted by a model and kept only when their quote appears verbatim in the text; each cited source is then checked, with a model’s help, for whether it says what the claim relies on. Those verdicts can be wrong — read the claim’s quote and the cited source before relying on one.
The claim verdicts this report counts are experimental: their accuracy is not yet measured.
A language model drew the claims from the paper on 2026-10-11, under version 3 of the claim definition (model deepseek-v4.1-flash, prompt extract-v3).
A second model labelled each claim on 2026-10-11 (model jev-1.13-20260917, definition revision gold-guideline-v0.2).
Cited sources are checked with a language model’s help (qwen3.8-omni-flash and gpt-6-sol).
Statistics and arithmetic are recomputed, not judged.
Confidence bands are shown only for fields calibrated on our annotated test set. None is calibrated yet, so no band is shown.
What counts as a claim ›How we measure confidence ›How we check this ›
Are you an author, or do you see a problem with this page? Request a review
How to cite
Cite CoChat for the checks on this page, and the paper for its own findings.
- This page
- CoChat. (2026). Citation check: Neurocognitive function among individuals with problematic social media use. https://app.cochat.ai/papers/10.3389/fpsyt.2026.1825888
- The paper
- Almog, I., Mama, Y., & Weinstein, A. M. (2026). Neurocognitive function among individuals with problematic social media use. Frontiers in Psychiatry. https://doi.org/10.3389/fpsyt.2026.1825888
Data sources
Bibliographic data: Semantic Scholar, OpenAlex, Crossref.
Contains information from the Semantic Scholar Academic Graph Datasets, made available under the ODC Attribution License (ODC-BY 1.0).
Semantic Scholar’s data is described in: Kinney, R., et al. (2023). The Semantic Scholar Open Data Platform. arXiv:2301.10140.
