

The DOI matches its Crossref record; 36 of the 37 references it cites were found in a registry or an index; 3 of the 22 sources its claims cite were checked for support.
Active learning-based systematic reviewing using switching classification models: the case of the onset, maintenance, and relapse of depressive disorders
Open accessAbstract
Introduction: This study examines the performance of active learning-aided systematic reviews using a deep learning-based model compared to traditional machine learning approaches, and explores the potential benefits of model-switching strategies. Methods: Comprising four parts, the study: 1) analyzes the performance and stability of active learning-aided systematic review; 2) implements a convolutional neural network classifier; 3) compares classifier and feature extractor performance; and 4) investigates the impact of model-switching strategies on review performance. Results: Lighter models perform well in early simulation stages, while other models show increased performance in later stages. Model-switching strategies generally improve performance compared to using the default classification model alone. Discussion: The study's findings support the use of model-switching strategies in active learning-based systematic review workflows. It is advised to begin the review with a light model, such as Naïve Bayes or logistic regression, and switch to a heavier classification model based on a heuristic rule when needed.
Overview
CoChat Summary
TL;DR
This paper evaluates active learning-aided systematic reviewing on a large depression-relapse dataset and tests whether switching classification models during screening improves performance. It finds that active learning saves substantial screening time, that lighter models perform well early while heavier neural models help later, and that model-switching generally improves over the default model alone.
Key findings
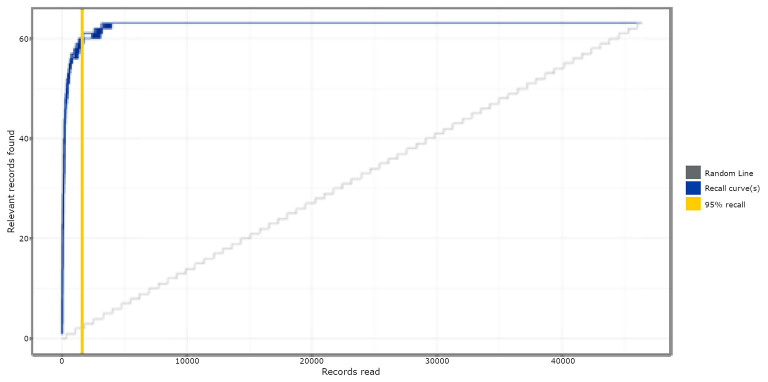
- On the Brouwer et al. dataset of 46,376 records with 63 relevant papers (<0.14% relevance), active learning saved on average 92% of screening time (SD = 0.18; min/max = 91.65/92.25), and after screening only 5% of records, 95% of relevant records were found (SD = 0.35; min/max = 95.16/96.77).
- Excluding the 5% or 10% last-to-find records did not change meta-analysis conclusions overall; one odds-ratio subgroup changed from “just”-significant to “just” not-significant due to one missing study.
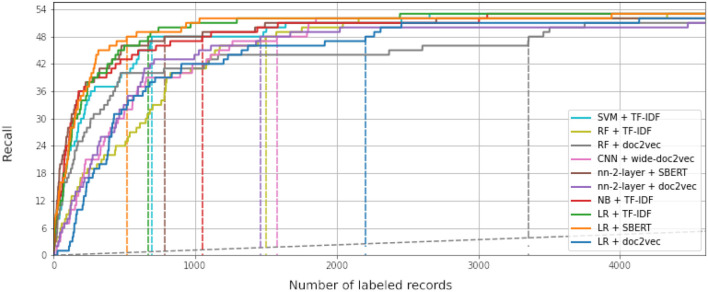
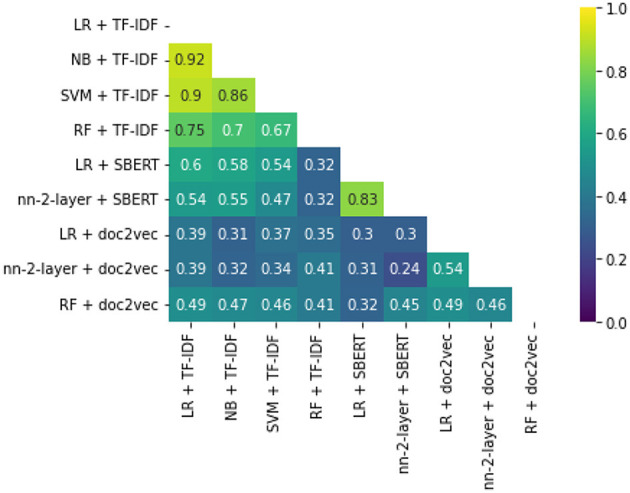
- In Study 3, the best WSS@95% was Logistic Regression + SBERT at 94.21%, finding 95% of relevant records after 587 screened records (1.3% of all records); LR + TF-IDF was close at 94.14% with much lower feature-extraction time (0:00:23.35 vs. 6:27:23.23).
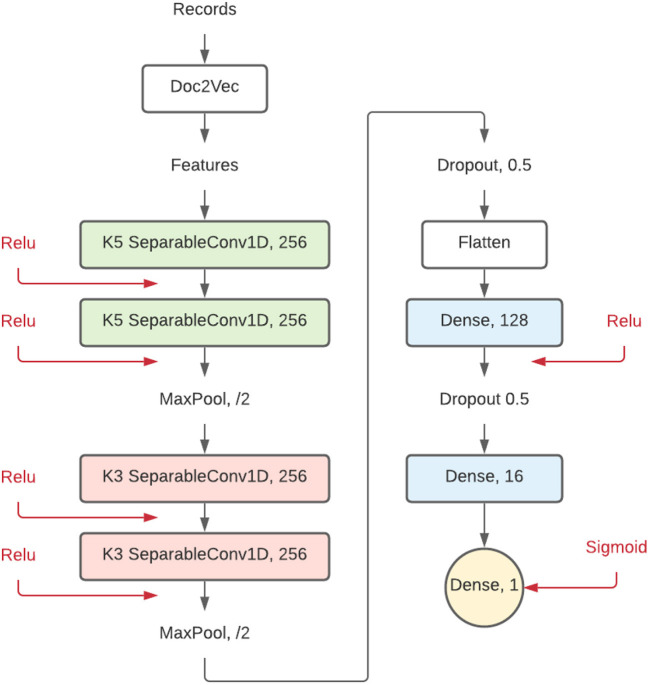
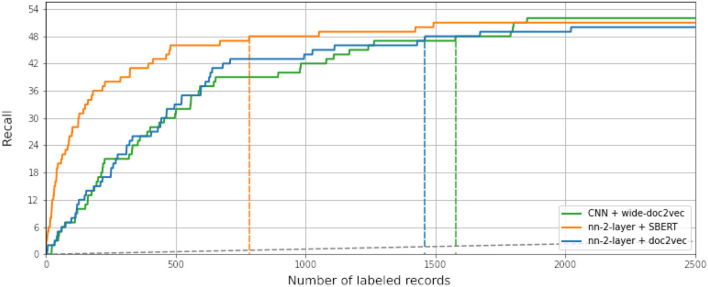
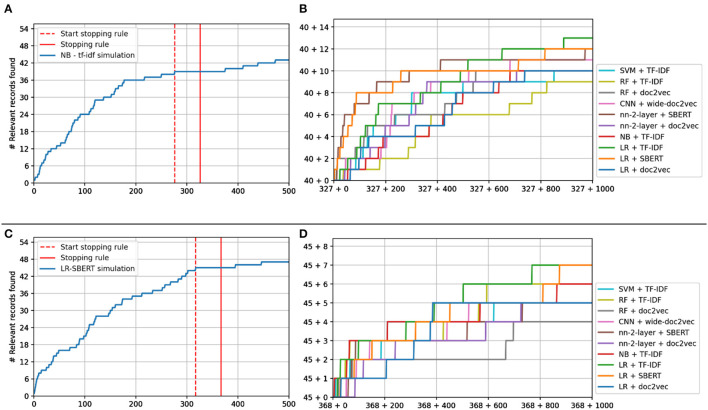
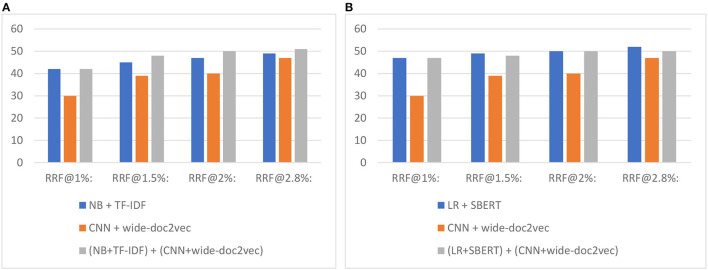
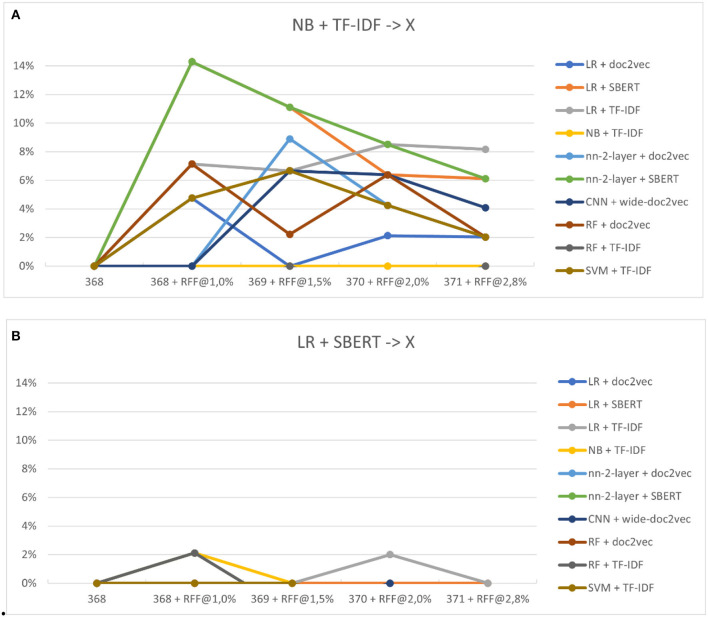
- In Study 4, switching from Naïve Bayes + TF-IDF to another model almost always increased performance, especially when switching to a different feature extractor; first running a shallow model and then switching to the 17-layer CNN outperformed screening with the CNN alone.
Methods
- Four simulation studies used the pre-labeled Brouwer et al. depression-relapse dataset (46,376 records, 63 included) and ASReview v0.18 simulation mode.
- Study 1 used default Naïve Bayes + TF-IDF with 63 runs, one relevant and ten irrelevant prior records, and measured WSS@95%, average time to discovery, and re-ran meta-analyses excluding the 5% and 10% last-to-find records.
- Studies 2–4 developed a 17-layer CNN with wide Doc2Vec, compared classifiers (NB, LR, RF, SVM, 2-layer NN) and feature extractors (TF-IDF, Doc2Vec, SBERT) on WSS and computational time, and tested model-switching after a heuristic stopping rule (e.g., 50 consecutive irrelevant records).
Limitations
- The paper states that model selection and performance results are specific to the Brouwer dataset and may not generalize; it recommends a benchmark platform with multiple datasets.
- The paper states unresolved challenges in re-training frequency, training-time trade-offs, optimal model-switching point, and how content differences affect record findability.
- The text also makes evident that simulations were terminated after all relevant records were found, which is not representative of real active learning reviews where it is unknown when all relevant records have been found.
Model-written summary. Check it against the paper before relying on it.
Integrity signals
Registry
Cites
Statistics
Figures
Verification
Claims the paper makes
2 Valid · 2 Not valid · 18 Not checked · 87 Own results and interpretations
The cited sources support only part of this claim — read each source’s verdict below.
In the paper
“The dataset used in this study comes from a systematic review-based meta-analysis focusing on the evidence for leading psychological and biological theories on the onset, maintenance, and relapse of depressive disorders (Brouwer et al., 2019; Kennis et al., 2020; Fu et al., 2021).”
§ Active learning-based systematic reviewing using switching classification models: the case of the onset, maintenance, and relapse of depressive disorders > 1. Introduction > 1.1. Data
What the sources say
- Partly supportedcites Brouwer et al., 2019 sourceExperimental — accuracy not yet measured
Brouwer et al. (2019) is indeed a systematic review and meta-analysis of prospective studies on the evidence for the five leading PSYCHOLOGICAL theories (cognitive, diathesis-stress, behavioural, psychodynamic, personality-based) of depressive RELAPSE/recurrence in MDD (Discussion para. 1; Introduction; 2.1 Selection of studies, PRISMA/PROSPERO CRD42017073977). However, the scope the citing sentence attributes to it — 'psychological and biological theories' and 'onset, maintenance, and relapse' — overreaches this paper: its search strings covered only factors from the five leading psychological theories combined with relapse/recurrence, and the paper states that the biological and onset components belong to the larger project reported elsewhere ('the current study was part of a larger project investigating psychological and biological risk factors of MDD onset and relapse (see Fu et al., in preparation; Kennis et al., 2019)'). Those extensions are carried by the co-cited Kennis and Fu papers, not by this source; whether the citing study's dataset derives from it is also not something our copy addresses. (LLM, conf=0.80)
- Supportedcites Kennis et al., 2020 source
The Search process and study selection section states that 'This meta-analysis was part of a larger project on evidence for leading theories for MDD onset, and relapse/recurrence and mechanisms of change,' and the Introduction/Abstract confirm it is a PRISMA-guided systematic review with random-effects meta-analyses of prospective biomarkers derived from leading biological theories, concluding there is 'a lack of evidence for leading biological theories for onset and maintenance of depression.' Thus this source is indeed one of the systematic review-based meta-analyses on biological theory evidence for onset, maintenance and relapse; the psychological half of the joint statement is carried by the co-cited Brouwer et al. (2019), which our copy lists as reference 102 (psychological theories of depressive relapse and recurrence). (LLM, conf=0.90)
- Not checked yetcites Fu et al., 2021
plain- Asserted: passes — The authors put it forward as true.
- Checkable: passes — It can be checked against evidence.
- Load-bearing: passes — The paper’s conclusions depend on it.
- Based: passes — The paper gives a reason why it holds.
- Partly supported
The cited sources support only part of this claim — read each source’s verdict below.
In the paper
“as Alwosheel et al. show, the performance of neural networks in classification problems increases with dataset sample size (Alwosheel et al., 2018).”
§ Active learning-based systematic reviewing using switching classification models: the case of the onset, maintenance, and relapse of depressive disorders > 1. Introduction
What the sources say
- Partly supportedcites Alwosheel et al., 2018 sourceExperimental — accuracy not yet measured
Section 4 reports that, across the discrete-choice datasets studied, networks trained on larger datasets showed better predictive performance, measured in part by classification accuracy (hit rate). The cited paper supports that finding for discrete-choice analysis, but the claim extends it to classification problems generally. (LLM, conf=0.83)
plainstates a cause- Asserted: passes — The authors put it forward as true.
- Checkable: passes — It can be checked against evidence.
- Load-bearing: passes — The paper’s conclusions depend on it.
- Based: passes — The paper gives a reason why it holds.
- Partly supported
A result the paper reports from its own data — it cites no other source for it, so there is none to check. The quote shows it is in the paper.
In the paper
“Lastly, addressing RQ1.3, our analysis revealed that failing to discover the last-to-find records in the systematic review from the Brouwer et al. dataset did not impact the analysis results or clinical advice”
§ Active learning-based systematic reviewing using switching classification models: the case of the onset, maintenance, and relapse of depressive disorders > 2. Study 1—Active learning-aided systematic reviewing > 2.3. Results
plain- Asserted: passes — The authors put it forward as true.
- Checkable: passes — It can be checked against evidence.
- Load-bearing: passes — The paper’s conclusions depend on it.
- Based: passes — The paper gives a reason why it holds.
A result the paper reports from its own data — it cites no other source for it, so there is none to check. The quote shows it is in the paper.
In the paper
“Results show that excluding the 5 or 10% of last-to-find records from the analysis has no impact on analysis results.”
§ Active learning-based systematic reviewing using switching classification models: the case of the onset, maintenance, and relapse of depressive disorders > 2. Study 1—Active learning-aided systematic reviewing > 2.3. Results
plain- Asserted: passes — The authors put it forward as true.
- Checkable: passes — It can be checked against evidence.
- Load-bearing: passes — The paper’s conclusions depend on it.
- Based: passes — The paper gives a reason why it holds.
A result the paper reports from its own data — it cites no other source for it, so there is none to check. The quote shows it is in the paper.
In the paper
“It appeared that with active learning, on average, 92% (SD = 0.18; Min/max = 91.65/92.25) of the screening time (WSS) could have been saved compared to reading records at random.”
- Also stated in: § 2.3. Results · plain
“For RQ1.1, we found that active learning saved an average of 92% of screening time compared to reading records at random during the systematic review that resulted in the Brouwer et al. dataset.”
§ Active learning-based systematic reviewing using switching classification models: the case of the onset, maintenance, and relapse of depressive disorders > 2. Study 1—Active learning-aided systematic reviewing > 2.3. Results
plainstates a cause- Asserted: passes — The authors put it forward as true.
- Checkable: passes — It can be checked against evidence.
- Load-bearing: passes — The paper’s conclusions depend on it.
- Based: passes — The paper gives a reason why it holds.
- Also stated in: § 2.3. Results · plain
63 more claims
Create a free account to see all 109 claims and to verify the 19 references still open.
- Probably not a substantial claim. 18
- It may state two separate claims as one. 28
Claims other papers make about this one
Each is checked against this paper’s own text: does it say what the citing paper says it does?
The source backs part of the claim, not all of it — or backs it for a different population, condition or comparison.
In the citing paper
“The third screening phase is to ensure that records are not missed due to suboptimal choice of the active learning model [40].”
From The SAFE procedure: a practical stopping heuristic for active learning-based screening in systematic reviews and meta-analyses (2024) · cites this paper as [40]
Experimental — accuracy not yet measuredIn the citing paper
“More complex models, which rely on a larger number of parameters and features, typically require more data to generate effective screening orders [54].”
From Large-scale simulation study of active learning models for systematic reviews (2025) · cites this paper as [54]
In the citing paper
“Therefore, we foresee that this model can serve as a model to switch to if enough labels have been gathered,30 as a quality check,39 or if a previously labeled dataset is available, for example, in an update of a systematic review (e.g., van de Schoot et al.2).”
From ASReview LAB v.2: Open-source text screening with multiple agents and a crowd of experts (2025) · cites this paper as [30]
In the citing paper
“Alternatively, one could benchmark existing models but for different datasets.26,30,31,32,33,34”
From ASReview LAB v.2: Open-source text screening with multiple agents and a crowd of experts (2025) · cites this paper as [30]
Self-check
Percentages, sums and reported differences re-computed from the paper’s own numbers.
Rated minor: it would not touch a result — a value no result rests on, a p-value that stays on the same side of the significance level, or a conflict that is clerical, resolved elsewhere in the paper, or outside its own findings.
In the paper
“2.8% (1,391) of screened records”
§ Active learning-based systematic reviewing using switching classification models: the case of the onset, maintenance, and relapse of depressive disorders > 5. Simulation study 4—Model switching > 5.2. Setup
Reported 2.8 · recomputed 2.999396
Citations
Cites
(2014) · Cited by 33,419
PRISMA-P Group, Moher, D., Shamseer, L., Clarke, M., Ghersi, D., Liberati, A., Petticrew, M., Shekelle, P., & Stewart, L. A. (2015) · Systematic Reviews · doi:10.1186/2046-4053-4-1 · Cited by 26,223 · cited 1×
“Researchers write systematic reviews and conduct meta-analyses to provide an exhaustive summary of a specific scientific field, providing essential, comprehensive overviews of relevant topics (Moher et al., 2015).”
BackgroundBorenstein, M., Hedges, L. V., Higgins, J. P. T., & Rothstein, H. R. (2021) · doi:10.1002/9781119558378 · Cited by 9,799
(2011) · Cited by 6,993
A unified architecture for natural language processing: deep neural networks with multitask learning
Collobert, R., & Weston, J. (2008) · Proceedings of the 25th international conference on Machine learning - ICML '08 · doi:10.1145/1390156.1390177 · Cited by 5,058
A survey on concept drift adaptation
Gama, J., Žliobaitė, I., Bifet, A., Pechenizkiy, M., & Bouchachia, A. (2014) · ACM Computing Surveys · doi:10.1145/2523813 · Cited by 3,735
Neural Networks: Tricks of the Trade: Second Edition
(2012) · Lecture Notes in Computer Science · doi:10.1007/978-3-642-35289-8 · Cited by 2,116 · cited 1×
“However, CNN models require much more training data (Montavon et al., 2012) and, as Alwosheel et al.”
MethodReading text in the wild with convolutional neural networks
Jaderberg, M., Simonyan, K., Vedaldi, A., & Zisserman, A. (2016) · International Journal of Computer Vision · doi:10.1007/s11263-015-0823-z · Cited by 1,191
An open source machine learning framework for efficient and transparent systematic reviews
van de Schoot, R., de Bruin, J., Schram, R., Zahedi, P., de Boer, J., Weijdema, F., Kramer, B., Huijts, M., Hoogerwerf, M., Ferdinands, G., et al. (2021) · Nature Machine Intelligence · doi:10.1038/s42256-020-00287-7 · Cited by 1,157
Self-citationSettles, B. (2012) · Synthesis Lectures on Artificial Intelligence and Machine Learning · doi:10.2200/s00429ed1v01y201207aim018 · Cited by 605
Research works printed but not linked: 9
- Ferdinands, 2021, Scripts and Output for the Simulation Study Determining the Time to Discovery for the Depression Data (1, 0.).
- Goodfellow, 2016, Deep learning: MIT press;
- Parker, 2011, English Gigaword
- Teijema, ASReview CNN 17 layer model plugin. v1, 0.2 ed.
- Teijema, ASReview wide doc2vec plugin. v0, 1.2 ed.
- Teijema, ASReview model switcher plugin. v1, 0.2 ed.
- van de Brand, 2021, A Systematic Review on Studies Evaluating the Performance of Active Learning Compared to Human Reading for Systematic Review Data
- van de Schoot, ASReview: Active learning for systematic reviews [Software]
- van den Brand, 2021, Scripts for Post-Processing Mega-Meta Screening Results. v1, 0.1 ed.
Cited by
Boetje, J., & van de Schoot, R. (2024) · Systematic Reviews · doi:10.1186/s13643-024-02502-7 · Cited by 146
“The third screening phase is to ensure that records are not missed due to suboptimal choice of the active learning model [40].”
BackgroundSleep assessment using EEG-based wearables – A systematic review
de Gans, C. J., Burger, P. C., van den Ende, E. S., Hermanides, J., Nanayakkara, P. W. B., Gemke, R. J. B. J., Rutters, F., & Stenvers, D. J. (2024) · Sleep Medicine Reviews · doi:10.1016/j.smrv.2024.101951 · Cited by 128
Ferdinands, G., Schram, R., de Bruin, J., Bagheri, A., Oberski, D. L., Tummers, L., Teijema, J. J., & van de Schoot, R. (2023) · Systematic Reviews · doi:10.1186/s13643-023-02257-7 · Cited by 96
“See [61] for a study utilizing the TD and ATD metrics for a comparative analysis of different model configurations.”
MethodSelf-citationKönig, L., Zitzmann, S., Fütterer, T., Campos, D., Scherer, R., & Hecht, M. (2024) · Research Synthesis Methods · doi:10.1002/jrsm.1762 · Cited by 39
ASReview LAB v.2: Open-source text screening with multiple agents and a crowd of experts
de Bruin, J., Lombaers, P., Kaandorp, C., Teijema, J., van der Kuil, T., Yazan, B., Dong, A., & van de Schoot, R. (2025) · Patterns · doi:10.1016/j.patter.2025.101318 · Cited by 27
Self-citation
Metadata
- Authors
- Teijema, J. J., Hofstee, L., Brouwer, M., de Bruin, J., Ferdinands, G., de Boer, J., Vizan, P., van den Brand, S., Bockting, C., van de Schoot, R., & Bagheri, A.
- Affiliations
- Utrecht University (NL)
- Amsterdam University Medical Centers (NL)
- ORCID
- Venue
- Frontiers in Research Metrics and Analytics
- Publisher
- Frontiers Media SA
- Published
- 2023-05-16
- Volume
- 8
- Pages
- 1178181-1178181
- ISSN
- 2504-0537 (ISSN-L)
- PMC
- PMC10227618
- OpenAlex
- W4376645833
- Cited by
- 36
- References
- 35
- Citations by year
- 2026: 9 · 2025: 10 · 2024: 13 · 2023: 4
- FWCI
- 2.55
- Type
- journal article
- Language
- en
- Open access
- gold
- doi.org
- Licence
- Locations
- Frontiers in Research Metrics and Analytics (publishedVersion, cc-by)
- PubMed Central (publishedVersion, cc-by)
- PubMed (publishedVersion)
- Pure Amsterdam UMC (submittedVersion, cc-by)
- DOAJ (DOAJ: Directory of Open Access Journals) (submittedVersion, cc-by-sa)
- Funders
- Universiteit van Amsterdam
- Topics
- Social Sciences › Decision Sciences › Statistics, Probability and Uncertainty › Meta-analysis and systematic reviews
- Physical Sciences › Computer Science › Artificial Intelligence › Machine Learning and Algorithms
- Social Sciences › General Social Sciences › Computational and Text Analysis Methods
- Keywords
- active learning (machine learning), systematic reviews, model switching, convolutional neural networks, feature extraction, depression onset, depression maintenance, depression relapse
About these checks
Registry, retraction, Cites and statistics results are computed, not judged, with one exception: a printed reference that no index lists is read once by a model before it counts as a citation error. Claims are extracted by a model and kept only when their quote appears verbatim in the text; each cited source is then checked, with a model’s help, for whether it says what the claim relies on. Those verdicts can be wrong — read the claim’s quote and the cited source before relying on one.
The claim verdicts this report counts are experimental: their accuracy is not yet measured.
A language model drew the claims from the paper on 2026-10-05, under version 3 of the claim definition (model deepseek-v4.1-flash, prompt extract-v3).
A second model labelled each claim on 2026-10-05 (model jev-1.13-20260917, definition revision gold-guideline-v0.2).
Cited sources are checked with a language model’s help (qwen3.8-omni-flash and gpt-6-sol).
Statistics and arithmetic are recomputed, not judged.
Confidence bands are shown only for fields calibrated on our annotated test set. None is calibrated yet, so no band is shown.
What counts as a claim ›How we measure confidence ›How we check this ›
Are you an author, or do you see a problem with this page? Request a review
How to cite
Cite CoChat for the checks on this page, and the paper for its own findings.
- This page
- CoChat. (2026). Citation check: Active learning-based systematic reviewing using switching classification models: the case of the onset, maintenance, and relapse of depressive disorders. https://app.cochat.ai/papers/10.3389/frma.2023.1178181
- The paper
- Teijema, J. J., Hofstee, L., Brouwer, M., de Bruin, J., Ferdinands, G., de Boer, J., Vizan, P., van den Brand, S., Bockting, C., van de Schoot, R., & Bagheri, A. (2023). Active learning-based systematic reviewing using switching classification models: the case of the onset, maintenance, and relapse of depressive disorders. Frontiers in Research Metrics and Analytics. https://doi.org/10.3389/frma.2023.1178181
Data sources
Bibliographic data: Semantic Scholar, OpenAlex, Crossref.
Contains information from the Semantic Scholar Academic Graph Datasets, made available under the ODC Attribution License (ODC-BY 1.0).
Semantic Scholar’s data is described in: Kinney, R., et al. (2023). The Semantic Scholar Open Data Platform. arXiv:2301.10140.
