

The DOI matches its Crossref record; 5 of the 5 references it cites were found in a registry or an index.
Concentrations of Airborne Microplastics during the Dry Season at Five Locations in Bangkok Metropolitan Region, Thailand
Abstract
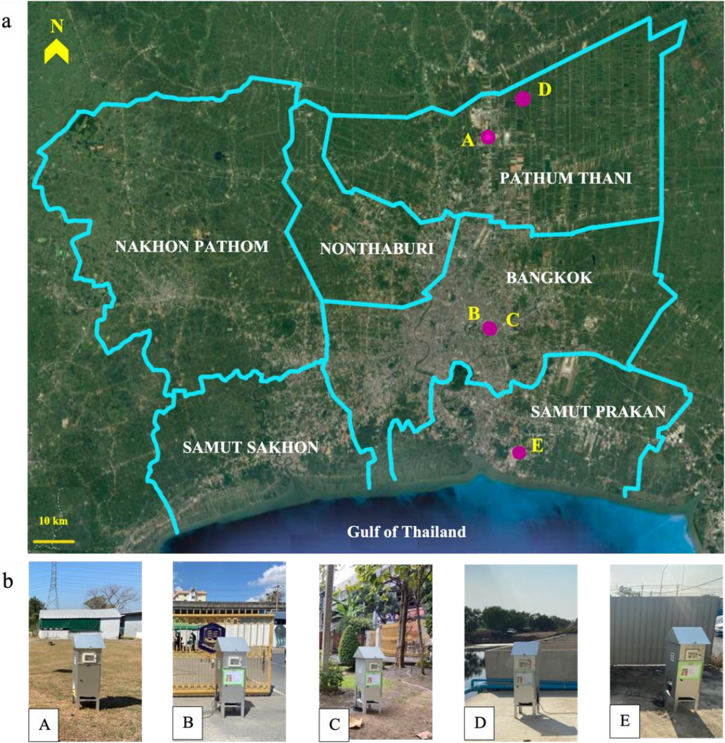
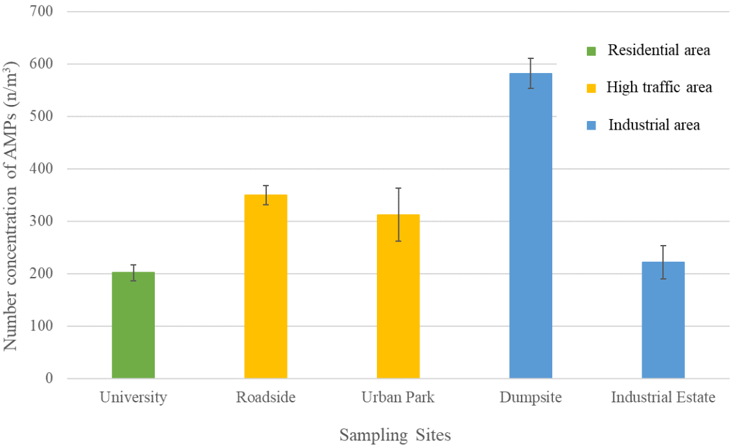
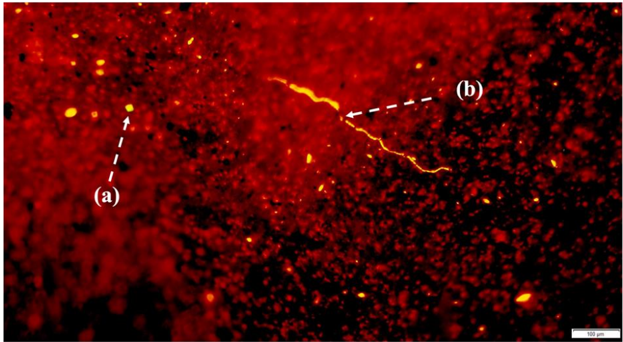
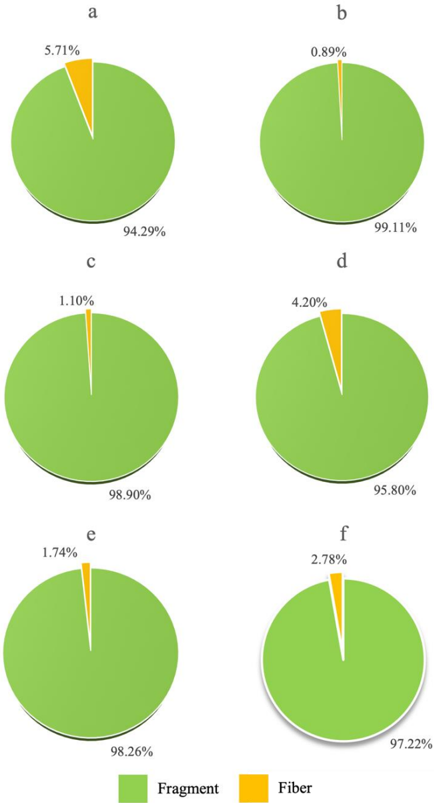
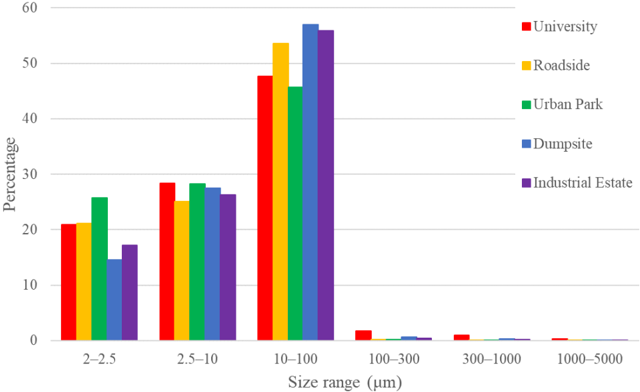
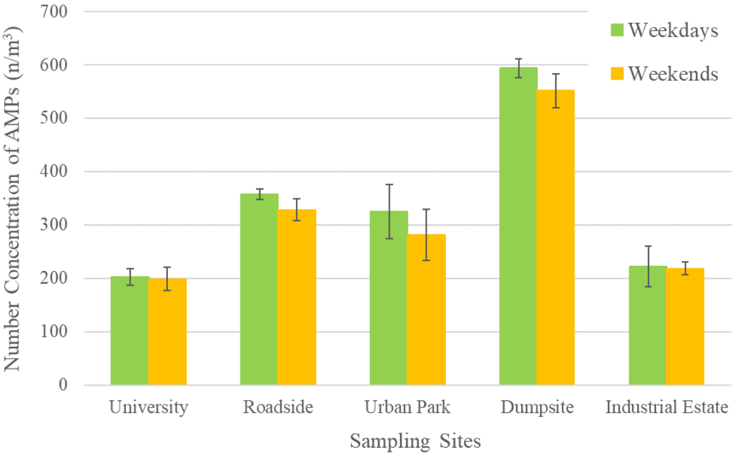
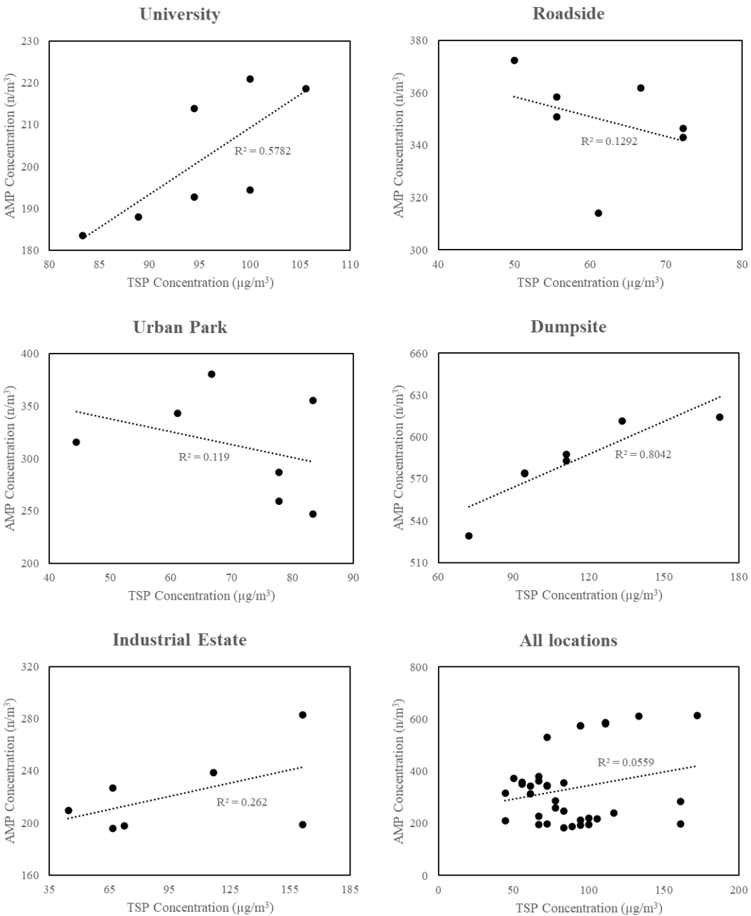
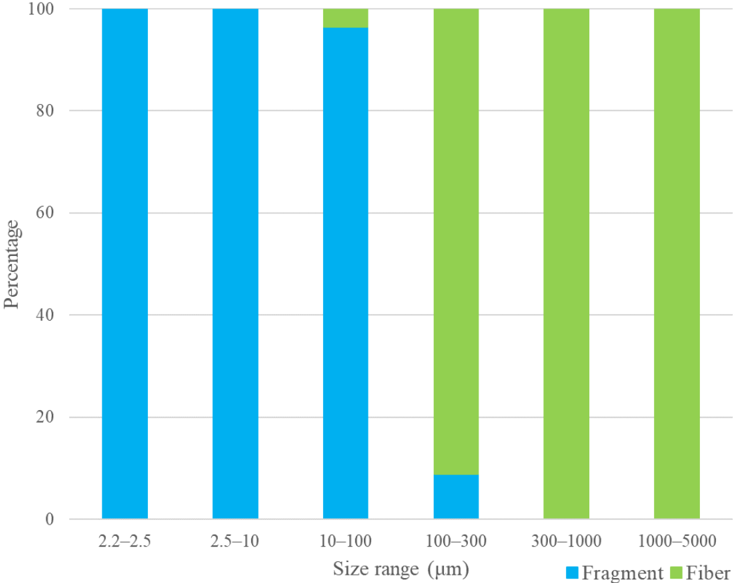
Information on airborne microplastics (AMPs) in Thailand is still not available. This study monitored and identified AMPs in Bangkok Metropolitan Region (BMR), Thailand. A high-volume air sampler was used to collect AMPs at five different locations in BMR. These five locations are university, roadside, urban park, dumpsite, and industrial estate. The results showed that AMPs concentration was averaged at 333.42 ± 142.99 per cubic meter (n/m3). The concentration of AMPs at the dumpsite was much higher than the concentration in the other areas. The relationship between AMPs and total suspended particles (TSP) was highly dependent on the locations and sources of microplastics nearby. Higher AMP with higher TSP were found at the university, dumpsite, and industrial estate. On the other hand, lower AMP with higher TSP were found at the roadside and urban park. Regarding the shape of the AMPs, the majority (97.22%) of the AMPs were in fragment form while only 2.78% were in fiber form. Polyethylene (PE) in the fragments and cellophane in the fibers were the major polymer types which were present in all locations.
Overview
The claims and statistics of this paper haven’t been checked yet.
Run the check — free, no account needed. It reads the open-access text and checks the sources it cites.
Integrity signals
Registry
Cites
Statistics
Figures
Verification
Claims the paper makes
The claims and statistics of this paper haven’t been checked yet.
Run the check — free, no account needed. It reads the open-access text and checks the sources it cites.
Claims other papers make about this one
Each is checked against this paper’s own text: does it say what the citing paper says it does?
In the citing paper
“The atmosphere is one of the pathways in which microplastic pollutants exist as it is evident that microplastic fibers have been found in outdoor and indoor air [4,5].”
From Exploring Personal Exposure to Airborne Microplastics across Various Work Environments in Pathum Thani Province, Thailand (2023) · cites this paper as [5]
Self-check
Percentages, sums and reported differences re-computed from the paper’s own numbers.
The self-check needs the paper’s full text.
Citations
Cites
Discovery and quantification of plastic particle pollution in human blood
Leslie, H. A., van Velzen, M. J. M., Brandsma, S. H., Vethaak, A. D., Garcia-Vallejo, J. J., & Lamoree, M. H. (2022) · Environment International · doi:10.1016/j.envint.2022.107199 · Cited by 3,906
Future Scenarios of Global Plastic Waste Generation and Disposal
Lebreton, L., & Andrady, A. (2019) · Palgrave Communications · doi:10.1057/s41599-018-0212-7 · Cited by 2,327
Detection of microplastics in human lung tissue using μFTIR spectroscopy
Jenner, L. C., Rotchell, J. M., Bennett, R. T., Cowen, M., Tentzeris, V., & Sadofsky, L. R. (2022) · Science of The Total Environment · doi:10.1016/j.scitotenv.2022.154907 · Cited by 1,536
Atmospheric microplastic deposition in an urban environment and an evaluation of transport
Wright, S. L., Ulke, J., Font, A., Chan, K. L. A., & Kelly, F. J. (2020) · Environment International · doi:10.1016/j.envint.2019.105411 · Cited by 1,222
Deposition, retention, and clearance of inhaled particles.
Lippmann, M., Yeates, D. B., & Albert, R. E. (1980) · Occupational and Environmental Medicine · doi:10.1136/oem.37.4.337 · Cited by 557
Research works printed but not linked: 29
- Andrady, 2009, Applications and societal benefits of plastics, Philos. Trans. R. Soc. B Biol. Sci., 364, 1977, 10.1098/rstb.2008.0304 · DOI · Paper page
- Lithner, 2011, Environmental and health hazard ranking and assessment of plastic polymers based on chemical composition, Sci. Total Environ., 409, 3309, 10.1016/j.scitotenv.2011.04.038 · DOI · Paper page
- Frias, 2019, Microplastics: Finding a consensus on the definition, Mar. Pollut. Bull., 138, 145, 10.1016/j.marpolbul.2018.11.022 · DOI
- Akanyange, 2021, Does microplastic really represent a threat? A review of the atmospheric contamination sources and potential impacts, Sci. Total Environ., 777, 146020, 10.1016/j.scitotenv.2021.146020 · DOI
- Guo, 2019, The chemical behaviors of microplastics in marine environment: A review, Mar. Pollut. Bull., 142, 1, 10.1016/j.marpolbul.2019.03.019 · DOI · Paper page
- Golwala, 2021, Solid waste: An overlooked source of microplastics to the environment, Sci. Total Environ., 769, 144581, 10.1016/j.scitotenv.2020.144581 · DOI
- Alimba, 2019, Microplastics in the marine environment: Current trends in environmental pollution and mechanisms of toxicological profile, Environ. Toxicol. Pharmacol., 68, 61, 10.1016/j.etap.2019.03.001 · DOI
- Auta, 2017, Distribution and importance of microplastics in the marine environment: A review of the sources, fate, effects, and potential solutions, Environ. Int., 102, 165, 10.1016/j.envint.2017.02.013 · DOI · Paper page
- Chae, 2018, Current research trends on plastic pollution and ecological impacts on the soil ecosystem: A review, Environ. Pollut., 240, 387, 10.1016/j.envpol.2018.05.008 · DOI
- Beaurepaire, 2021, Microplastics in the atmospheric compartment: A comprehensive review on methods, results on their occurrence and determining factors, Curr. Opin. Food Sci., 41, 159, 10.1016/j.cofs.2021.04.010 · DOI
- Levermore, 2020, Detection of microplastics in ambient particulate matter using Raman spectral imaging and chemometric analysis, Anal. Chem., 92, 8732, 10.1021/acs.analchem.9b05445 · DOI
- Costa, 2022, Airborne microplastics and SARS-CoV-2 in total suspended particles in the area surrounding the largest medical centre in Latin America, Environ. Pollut., 292, 118299, 10.1016/j.envpol.2021.118299 · DOI
- Donaldson, 2002, Inflammation caused by particles and fibers, Inhal. Toxicol., 14, 5, 10.1080/089583701753338613 · DOI
- Eschenbacher, 1999, Nylon flock–associated interstitial lung disease, Am. J. Respir. Crit. Care Med., 159, 2003, 10.1164/ajrccm.159.6.9808002 · DOI
- Pauly, 1998, Inhaled cellulosic and plastic fibers found in human lung tissue, Cancer Epidemiol. Prev. Biomark., 7, 419
- Tran, 2000, Inhalation of poorly soluble particles. II. Influence of particle surface area on inflammation and clearance, Inhal. Toxicol., 12, 1113, 10.1080/08958370050166796 · DOI · Paper page
- Huang, 2020, Mini-review on current studies of airborne microplastics: Analytical methods, occurrence, sources, fate and potential risk to human beings, TrAC Trends Anal. Chem., 125, 115821, 10.1016/j.trac.2020.115821 · DOI
- Jin, 2014, Evaluation of impacts of trees on PM2.5 dispersion in urban streets, Atmos. Environ., 99, 277, 10.1016/j.atmosenv.2014.10.002 · DOI
- Chen, 2017, Variation in tree species ability to capture and retain airborne fine particulate matter (PM2. 5), Sci. Rep., 7, 1
- Zhu, 2021, Airborne microplastic concentrations in five megacities of northern and southeast China, Environ. Sci. Technol., 55, 12871
- Liao, 2021, Airborne microplastics in indoor and outdoor environments of a coastal city in Eastern China, J. Hazard. Mater., 417, 126007, 10.1016/j.jhazmat.2021.126007 · DOI
- Kaya, 2018, Ubiquitous exposure to microfiber pollution in the air, Eur. Phys. J. Plus, 133, 488, 10.1140/epjp/i2018-12372-7 · DOI
- Ding, 2021, The abundance and characteristics of atmospheric microplastic deposition in the northwestern South China Sea in the fall, Atmos. Environ., 253, 118389, 10.1016/j.atmosenv.2021.118389 · DOI
- Liu, 2019, Consistent transport of terrestrial microplastics to the ocean through atmosphere, Environ. Sci. Technol., 53, 10612, 10.1021/acs.est.9b03427 · DOI
- Syafei, 2017, Microplastic pollution in the ambient air of Surabaya, Indonesia, Curr. World Environ., 14, 290, 10.12944/CWE.14.2.13 · DOI
- Klein, 2019, Microplastic abundance in atmospheric deposition within the Metropolitan area of Hamburg, Germany, Sci. Total Environ., 685, 96, 10.1016/j.scitotenv.2019.05.405 · DOI
- Gaston, 2020, Microplastics differ between indoor and outdoor air masses: Insights from multiple microscopy methodologies, Appl. Spectrosc., 74, 1079, 10.1177/0003702820920652 · DOI
- Tamminga, 2017, Nile red staining as a subsidiary method for microplastic quantification: A comparison of three solvents and factors influencing application reliability, SDRP J. Earth Sci. Environ. Stud., 2, 165
- Ashrafi, 2018, Source apportionment of total suspended particles (TSP) by positive matrix factorization (PMF) and chemical mass balance (CMB) modeling in Ahvaz, Iran, Arch. Environ. Contam. Toxicol., 75, 278, 10.1007/s00244-017-0500-z · DOI
Cited by
Sorted by citations
Limsiriwong, K., & Winijkul, E. (2023) · International Journal of Environmental Research and Public Health · doi:10.3390/ijerph20247162 · Cited by 27
Self-citation
Metadata
- Authors
- Sarathana, D., & Winijkul, E.
- Venue
- Atmosphere
- Publisher
- MDPI AG
- Published
- 2022-12-24
- Volume
- 14
- Issue
- 1
- Pages
- 28
- ISSN
- 2073-4433
- Cited by
- 38
- References
- 5
- Language
- en
About these checks
Registry, retraction, Cites and statistics results are computed, not judged, with one exception: a printed reference that no index lists is read once by a model before it counts as a citation error. Claims are extracted by a model and kept only when their quote appears verbatim in the text; each cited source is then checked, with a model’s help, for whether it says what the claim relies on. Those verdicts can be wrong — read the claim’s quote and the cited source before relying on one.
Statistics and arithmetic are recomputed, not judged.
Confidence bands are shown only for fields calibrated on our annotated test set. None is calibrated yet, so no band is shown.
What counts as a claim ›How we measure confidence ›How we check this ›
Are you an author, or do you see a problem with this page? Request a review
