

Process Analytical Technology for Advanced Process Control in Biologics Manufacturing with the Aid of Macroscopic Kinetic Modeling
Open accessThe DOI matches its Crossref record; 53 of the 54 references it cites were found in a registry or an index.
Abstract
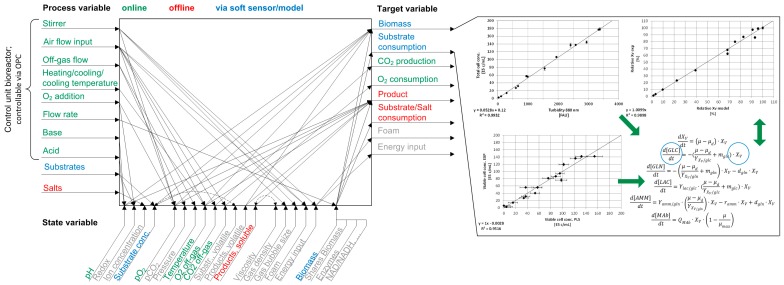
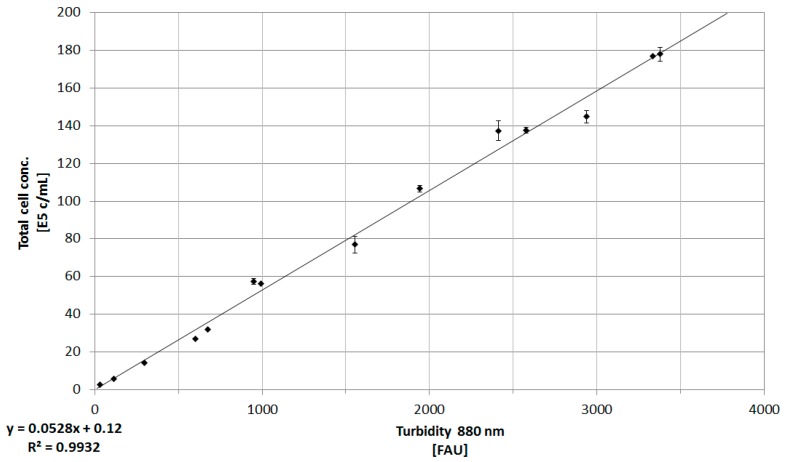
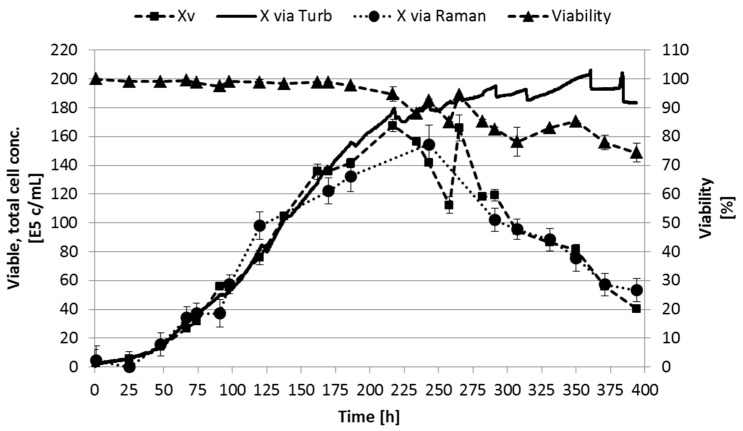
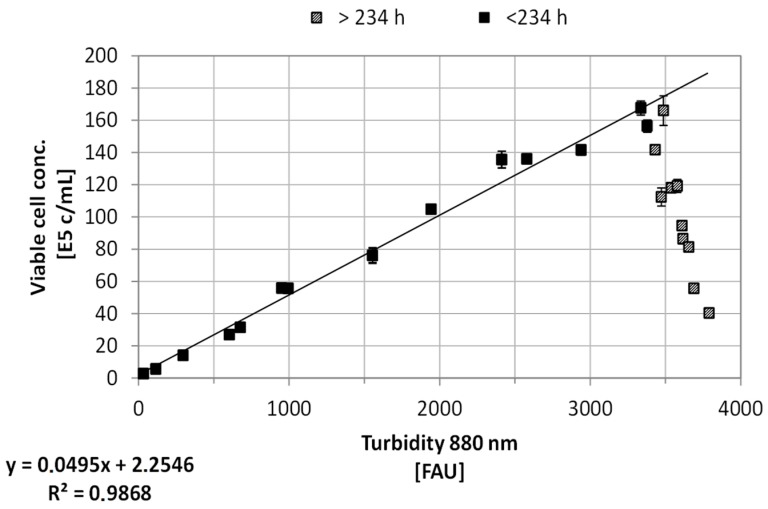
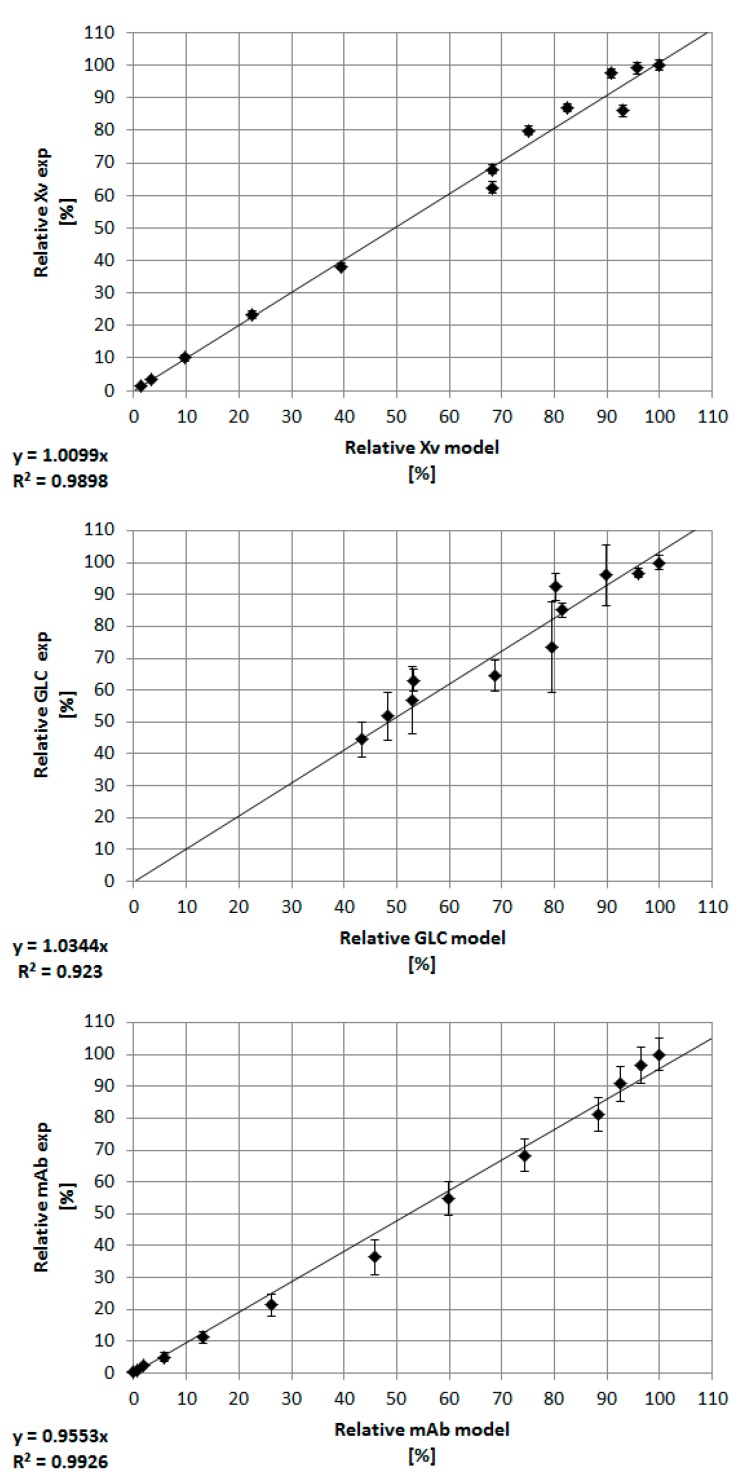
Productivity improvements of mammalian cell culture in the production of recombinant proteins have been made by optimizing cell lines, media, and process operation. This led to enhanced titers and process robustness without increasing the cost of the upstream processing (USP); however, a downstream bottleneck remains. In terms of process control improvement, the process analytical technology (PAT) initiative, initiated by the American Food and Drug Administration (FDA), aims to measure, analyze, monitor, and ultimately control all important attributes of a bioprocess. Especially, spectroscopic methods such as Raman or near-infrared spectroscopy enable one to meet these analytical requirements, preferably in-situ. In combination with chemometric techniques like partial least square (PLS) or principal component analysis (PCA), it is possible to generate soft sensors, which estimate process variables based on process and measurement models for the enhanced control of bioprocesses. Macroscopic kinetic models can be used to simulate cell metabolism. These models are able to enhance the process understanding by predicting the dynamic of cells during cultivation. In this article, in-situ turbidity (transmission, 880 nm) and ex-situ Raman spectroscopy (785 nm) measurements are combined with an offline macroscopic Monod kinetic model in order to predict substrate concentrations. Experimental data of Chinese hamster ovary cultivations in bioreactors show a sufficiently linear correlation (R2 ≥ 0.97) between turbidity and total cell concentration. PLS regression of Raman spectra generates a prediction model, which was validated via offline viable cell concentration measurement (RMSE ≤ 13.82, R2 ≥ 0.92). Based on these measurements, the macroscopic Monod model can be used to determine different process attributes, e.g., glucose concentration. In consequence, it is possible to approximately calculate (R2 ≥ 0.96) glucose concentration based on online cell concentration measurements using turbidity or Raman spectroscopy. Future approaches will use these online substrate concentration measurements with turbidity and Raman measurements, in combination with the kinetic model, in order to control the bioprocess in terms of feeding strategies, by employing an open platform communication (OPC) network—either in fed-batch or perfusion mode, integrated into a continuous operation of upstream and downstream.
Overview
The claims and statistics of this paper haven’t been checked yet.
Free: it reads the open-access text and checks the first 5 claims that cite a source we can check. Create a free account to check every claim.
Integrity signals
Registry
Cites
Statistics
Figures

Verification
Claims the paper makes
The claims and statistics of this paper haven’t been checked yet.
Free: it reads the open-access text and checks the first 5 claims that cite a source we can check. Create a free account to check every claim.
Claims other papers make about this one
Each is checked against this paper’s own text: does it say what the citing paper says it does?
The source backs part of the claim, not all of it — or backs it for a different population, condition or comparison.
In the citing paper
“These include a Raman microscope coupled to an automated plate reader to support early-stage scale-down conditions [70], an academic study that used in-line viscosity and off-line Raman measurements as input into a Monad model of CHO cell metabolism, [71] and an off-line time-gated Raman/SERS microscopy approach coupled to a custom microwell plate for E. coli fermentations [20].”
From The role of Raman spectroscopy in biopharmaceuticals from development to manufacturing (2022) · cites this paper as [71]
Experimental — accuracy not yet measured
Self-check
Percentages, sums and reported differences re-computed from the paper’s own numbers.
The self-check needs the paper’s full text.
Citations
Cites
Production of recombinant protein therapeutics in cultivated mammalian cells
Wurm, F. M. (2004) · Nature Biotechnology · doi:10.1038/nbt1026 · Cited by 2,032
Glutamine and glutamate—their central role in cell metabolism and function
Newsholme, P., Procopio, J., Lima, M. M. R., Pithon‐Curi, T. C., & Curi, R. (2003) · Cell Biochemistry and Function · doi:10.1002/cbf.1003 · Cited by 701 · cited 4×
“The also critical by-product ammonium (NH4) is mainly produced via the metabolism of glutamine [38,39,43].”
BackgroundInfluentialEffects of ammonia and lactate on hybridoma growth, metabolism, and antibody production
Ozturk, S. S., Riley, M. R., & Palsson, B. O. (1992) · Biotechnology and Bioengineering · doi:10.1002/bit.260390408 · Cited by 370 · cited 1×
“However, it is difficult to determine an exact threshold for the ammonium concentration, since different critical values, between 2 and 10 mM, are given in the literature [39,40,44].”
BackgroundEsmonde-White, K. A., Cuellar, M., Uerpmann, C., Lenain, B., & Lewis, I. R. (2017) · Analytical and Bioanalytical Chemistry · doi:10.1007/s00216-016-9824-1 · Cited by 332 · cited 1×
“Raman spectroscopy, in combination with chemometric analysis methods, can, for example, be used for the determination of the total or viable cell concentration, as well as for the substrate and metabolite concentration [4,20].”
MethodTrends in Upstream and Downstream Process Development for Antibody Manufacturing
Gronemeyer, P., Ditz, R., & Strube, J. (2014) · Bioengineering · doi:10.3390/bioengineering1040188 · Cited by 329
Self-citationAlt, N., Zhang, T. Y., Motchnik, P., Taticek, R., Quarmby, V., Schlothauer, T., Beck, H., Emrich, T., & Harris, R. J. (2016) · Biologicals · doi:10.1016/j.biologicals.2016.06.005 · Cited by 294 · cited 1×
“, structure, post-translational modifications, and efficacy) [7,8].”
Cell Culture Technology for Pharmaceutical and Cell-Based Therapies
(2005) · CRC Press eBooks · doi:10.1201/9780849351068 · Cited by 291 · cited 4×
“However, the reduction of pH, as well as the inhibition of cell growth and production of IgG, constitutes side-effects, resulting in the increase of lactate [37].”
BackgroundInfluentialBioreactor monitoring with spectroscopy and chemometrics: a review
Lourenço, N. D., Lopes, J. A., Almeida, C. F., Sarraguça, M. C., & Pinheiro, H. M. (2012) · Analytical and Bioanalytical Chemistry · doi:10.1007/s00216-012-6073-9 · Cited by 275 · cited 4×
“Depending on the location of the analysis, bioreactor monitoring techniques distinguish between in-situ, which can be invasive, non-invasive, or placed in a sampling loop, or ex-situ [9].”
BackgroundMethodInfluentialSoft sensors in bioprocessing: A status report and recommendations
Luttmann, R., Bracewell, D. G., Cornelissen, G., Gernaey, K. V., Glassey, J., Hass, V. C., Kaiser, C., Preusse, C., Striedner, G., & Mandenius, C. (2012) · Biotechnology Journal · doi:10.1002/biot.201100506 · Cited by 238 · cited 1×
“The combination of turbidity and/or Raman spectroscopy with a macroscopic model such as the soft sensor enables the estimation and/or prediction of process variables, which are not directly measureable [21].”
BackgroundSensor systems for bioprocess monitoring
Biechele, P., Busse, C., Solle, D., Scheper, T., & Reardon, K. (2015) · Engineering in Life Sciences · doi:10.1002/elsc.201500014 · Cited by 224
Research works printed but not linked: 1
- Otto M. Chemometrics. Statistics and Computer Application in Analytical Chemistry 3rd ed. Wiley-VCH Verlag GmbH et Co. KGaA Weinheim, Germany 2017
Cited by
Tripathi, N. K., & Shrivastava, A. (2019) · Frontiers in Bioengineering and Biotechnology · doi:10.3389/fbioe.2019.00420 · Cited by 575
“The implementation of Quality by Design (QbD) and process analytical technologies (PAT) tools has improved biopharmaceutical production strategies (Kornecki and Strube, 2018; Shekhawat et al., 2019).”
MethodProcess Analytical Technologies – Advances in bioprocess integration and future perspectives
Gerzon, G., Sheng, Y., & Kirkitadze, M. (2022) · Journal of Pharmaceutical and Biomedical Analysis · doi:10.1016/j.jpba.2021.114379 · Cited by 176
The role of Raman spectroscopy in biopharmaceuticals from development to manufacturing
Esmonde-White, K. A., Cuellar, M., & Lewis, I. R. (2022) · Analytical and Bioanalytical Chemistry · doi:10.1007/s00216-021-03727-4 · Cited by 152
Bioprocess Control: Current Progress and Future Perspectives
Rathore, A. S., Mishra, S., Nikita, S., & Priyanka, P. (2021) · Life · doi:10.3390/life11060557 · Cited by 141
Bioreactor control systems in the biopharmaceutical industry: a critical perspective
Mitra, S., & Murthy, G. S. (2021) · Systems Microbiology and Biomanufacturing · doi:10.1007/s43393-021-00048-6 · Cited by 136
Metadata
- Authors
- Kornecki, M., & Strube, J.
- Affiliations
- Clausthal University of Technology (DE)
- Corresponding author
- Strube, Jochen
- ORCID
- Strube, Jochen
- Venue
- Bioengineering
- Publisher
- MDPI AG
- Published
- 2018-03-16
- Volume
- 5
- Issue
- 1
- Pages
- 25
- ISSN
- 2306-5354 (ISSN-L)
- PMC
- PMC5874891
- OpenAlex
- W2793216914
- Cited by
- 61
- References
- 54
- Citations by year
- 2026: 4 · 2025: 8 · 2024: 3 · 2023: 7 · 2022: 6 · 2021: 14 · 2020: 9 · 2019: 6 · 2018: 4
- FWCI
- 2.94
- Type
- journal article
- Language
- en
- Open access
- gold
- doi.org
- Licence
- Locations
- Bioengineering (publishedVersion, cc-by)
- PubMed Central (publishedVersion, cc-by)
- PubMed (publishedVersion)
- DOAJ (DOAJ: Directory of Open Access Journals) (submittedVersion, cc-by-sa)
- Publikationsserver der Technischen Universität Clausthal (submittedVersion, cc-by)
- Topics
- Life Sciences › Biochemistry, Genetics and Molecular Biology › Molecular Biology › Viral Infectious Diseases and Gene Expression in Insects
- Physical Sciences › Chemistry › Analytical Chemistry › Spectroscopy and Chemometric Analyses
- Life Sciences › Biochemistry, Genetics and Molecular Biology › Biophysics › Spectroscopy Techniques in Biomedical and Chemical Research
- Keywords
- process analytical technology, bioprocess control, Raman spectroscopy, near-infrared spectroscopy, turbidity measurement, soft sensors, Monod kinetics, partial least squares regression, CHO cells, recombinant protein expression, glucose concentration prediction, fed-batch bioreactor, perfusion bioreactor
About these checks
Registry, retraction, Cites and statistics results are computed, not judged, with one exception: a printed reference that no index lists is read once by a model before it counts as a citation error. Claims are extracted by a model and kept only when their quote appears verbatim in the text; each cited source is then checked, with a model’s help, for whether it says what the claim relies on. Those verdicts can be wrong — read the claim’s quote and the cited source before relying on one.
Statistics and arithmetic are recomputed, not judged.
Confidence bands are shown only for fields calibrated on our annotated test set. None is calibrated yet, so no band is shown.
What counts as a claim ›How we measure confidence ›How we check this ›
Are you an author, or do you see a problem with this page? Request a review
Data sources
Bibliographic data: Semantic Scholar, OpenAlex, Crossref.
Contains information from the Semantic Scholar Academic Graph Datasets, made available under the ODC Attribution License (ODC-BY 1.0).
Semantic Scholar’s data is described in: Kinney, R., et al. (2023). The Semantic Scholar Open Data Platform. arXiv:2301.10140.
