

Explainable AI: A Review of Machine Learning Interpretability Methods
Open accessThe DOI matches its Crossref record; 170 of the 170 references it cites were found in a registry or an index.
Abstract
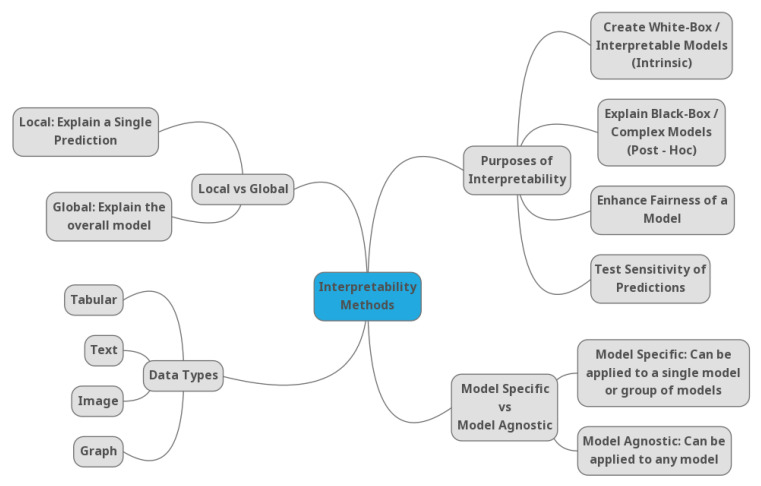
Recent advances in artificial intelligence (AI) have led to its widespread industrial adoption, with machine learning systems demonstrating superhuman performance in a significant number of tasks. However, this surge in performance, has often been achieved through increased model complexity, turning such systems into “black box” approaches and causing uncertainty regarding the way they operate and, ultimately, the way that they come to decisions. This ambiguity has made it problematic for machine learning systems to be adopted in sensitive yet critical domains, where their value could be immense, such as healthcare. As a result, scientific interest in the field of Explainable Artificial Intelligence (XAI), a field that is concerned with the development of new methods that explain and interpret machine learning models, has been tremendously reignited over recent years. This study focuses on machine learning interpretability methods; more specifically, a literature review and taxonomy of these methods are presented, as well as links to their programming implementations, in the hope that this survey would serve as a reference point for both theorists and practitioners.
Overview
The claims and statistics of this paper haven’t been checked yet.
Free: it reads the open-access text and checks the first 5 claims that cite a source we can check. Create a free account to check every claim.
Integrity signals
Registry
Cites
Statistics
Figures




Verification
Claims the paper makes
The claims and statistics of this paper haven’t been checked yet.
Free: it reads the open-access text and checks the first 5 claims that cite a source we can check. Create a free account to check every claim.
Claims other papers make about this one
Each is checked against this paper’s own text: does it say what the citing paper says it does?
The source backs part of the claim, not all of it — or backs it for a different population, condition or comparison.
In the citing paper
“While valuable, these techniques can sometimes be inconsistent or fail to capture the true decision-making process of highly complex models, potentially leading to a false sense of interpretability66.”
From Bias recognition and mitigation strategies in artificial intelligence healthcare applications (2025) · cites this paper as [66]
Experimental — accuracy not yet measuredThe source backs part of the claim, not all of it — or backs it for a different population, condition or comparison.
In the citing paper
“These methods facilitate a deeper understanding of the model’s internal logic, support debugging and optimization processes, and help identify key variables that most strongly influence students’ behavioral intentions toward GenAI adoption (Linardatos et al., 2020).”
From A two-step structural equation modeling and explainable machine learning framework for understanding university students’ adoption of generative AI: balancing intrinsic motivations and perceived risks (2026) · cites this paper as Linardatos et al., 2020
Experimental — accuracy not yet measuredThe source backs part of the claim, not all of it — or backs it for a different population, condition or comparison.
In the citing paper
“Yet, there is no common taxonomy neither within one field (such as data science) nor between different fields (law and data science).”
From Transparency of AI in Healthcare as a Multilayered System of Accountabilities: Between Legal Requirements and Technical Limitations (2022) · cites this paper as Linardatos et al., 2021
Experimental — accuracy not yet measuredThe source backs part of the claim, not all of it — or backs it for a different population, condition or comparison.
In the citing paper
“Despite the substantial amount of research devoted to solving the black-box issue of AI, many scholars in the field agree that a clear relevant taxonomy is missing (Doshi-Velez and Kim, 2017; Adadi and Berrada, 2018; Linardatos et al., 2021).”
From Transparency of AI in Healthcare as a Multilayered System of Accountabilities: Between Legal Requirements and Technical Limitations (2022) · cites this paper as Linardatos et al., 2021
Experimental — accuracy not yet measuredThe source backs part of the claim, not all of it — or backs it for a different population, condition or comparison.
In the citing paper
“Prior research on XAI across industries, has also found that the perceived quality of explanations is closely tied to their actionability and practical relevance for end users [8].”
From Explainable AI in hospital clinical decision support systems: A scoping review of healthcare professionals’ perspectives (2026) · cites this paper as [8]
Experimental — accuracy not yet measured
5 more claims about this paper
Create a free account to see every claim other papers make about this one.
Self-check
Percentages, sums and reported differences re-computed from the paper’s own numbers.
The self-check needs the paper’s full text.
Citations
Cites
ImageNet classification with deep convolutional neural networks
Krizhevsky, A., Sutskever, I., & Hinton, G. E. (2017) · Communications of the ACM · doi:10.1145/3065386 · Cited by 112,155 · cited 1×
“An improvement over the initial method was proposed in [24], where the well-known Krizhevsky network [25] was utilised in order to outperform state-of-the-art saliency models by a large margin, increasing the amount of explained information by 67% when compared to state-of-the art.”
LeCun, Y., Bengio, Y., & Hinton, G. (2015) · Nature · doi:10.1038/nature14539 · Cited by 84,126
XGBoost: A Scalable Tree Boosting System
Chen, T., & Guestrin, C. (2016) · Proceedings of the 22nd ACM SIGKDD International Conference on Knowledge Discovery and Data Mining · doi:10.1145/2939672.2939785 · Cited by 54,569 · cited 1×
“On the one hand, there are the so called black-box models, which include deep learning [2] and ensembles [8–10].”
Greedy function approximation: A gradient boosting machine
Friedman, J. H. (2001) · The Annals of Statistics · doi:10.1214/aos/1013203451 · Cited by 30,731 · cited 3×
“[59] PDPbox InterpretML Skater PH G Agnostic tab 589.”
Grad-CAM: Visual Explanations from Deep Networks via Gradient-Based Localization
Selvaraju, R. R., Cogswell, M., Das, A., Vedantam, R., Parikh, D., & Batra, D. (2017) · 2017 IEEE International Conference on Computer Vision (ICCV) · doi:10.1109/iccv.2017.74 · Cited by 24,513
A Unified Approach to Interpreting Model Predictions
Lundberg, S., & Lee, S.-I. (2017) · arXiv · doi:10.48550/arxiv.1705.07874 · Cited by 23,707 · cited 3×
“The breakDown method, as proposed in [62], is similar to SHAP [48], as both, based on the conditioned responses of a black-box model, attempt to attribute them proportionally to the input features.”
Classification and Regression by randomForest
Liaw, A. I., & Wiener, M. C. (2007) · Cited by 18,594
"Why Should I Trust You?": Explaining the Predictions of Any Classifier
Ribeiro, M. T., Singh, S., & Guestrin, C. (2016) · Proceedings of the 22nd ACM SIGKDD International Conference on Knowledge Discovery and Data Mining · doi:10.1145/2939672.2939778 · Cited by 17,555
Visualizing and understanding convolutional networks
Zeiler, M. D., & Fergus, R. (2014) · Lecture Notes in Computer Science · doi:10.1007/978-3-319-10590-1_53 · Cited by 15,839 · cited 8×
“[44] showed that, while the Deconvolution [32], Guided BackPropagation [31], and LRP [37] methods help in interpreting deep neural networks, they do not produce the theoretically correct interpretation, even in the simplest neural network setting; a linear model developed while using data that were produced by a linea…”
InfluentialLearning Deep Features for Discriminative Localization
Zhou, B., Khosla, A., Lapedriza, A., Oliva, A., & Torralba, A. (2016) · 2016 IEEE Conference on Computer Vision and Pattern Recognition (CVPR) · doi:10.1109/cvpr.2016.319 · Cited by 11,428 · cited 2×
“In many cases, this is achieved through exploiting the gradient information flowing through the layers of the network, Grad-CAM [35], a direct extension of [34], being a prime and most influential example in terms of citations per year.”
Research works printed but not linked: 3
- Luss, R., Chen, P.Y., Dhurandhar, A., Sattigeri, P., Zhang, Y., Shanmugam, K., and Tu, C.C. (2019). Generating contrastive explanations with monotonic attribute functions. arXiv.
- Van Looveren, A., and Klaise, J. (2019). Interpretable counterfactual explanations guided by prototypes. arXiv.
- Wang, X., Jin, H., and He, K. (2019). Natural language adversarial attacks and defenses in word level. arXiv.
Cited by
Items 401–500 of 1,016
Calderón-Díaz, M., Aguirre, R. S., Vásconez, J. P., Yáñez, R., Roby, M., Querales, M., & Salas, R. (2023) · Sensors · doi:10.3390/s24010119 · Cited by 47
“While the development of explainable models is relatively recent, their value in interpreting ML models has been acknowledged by various experts [21,22].”
BackgroundEthical Considerations in AI Development
Singh, B. P., & Joshi, A. (2024) · Advances in computational intelligence and robotics book series · doi:10.4018/979-8-3693-2964-1.ch010 · Cited by 46
Islam, M. M., Rifat, H. R., Shahid, M. S. B., Akhter, A., Uddin, M. A., & Uddin, K. M. M. (2025) · Engineering Reports · doi:10.1002/eng2.13080 · Cited by 41
Vu, T., Kokubo, Y., Inoue, M., Yamamoto, M., Mohsen, A. S., Morales, A. M., Inoué, T., Tay, J., Yoshizaki, M., Watanabe, N., et al. (2025) · JMIR Cardio · doi:10.2196/68066 · Cited by 45
Towards trustworthy AI in Industry 5.0: Ante-hoc interpretability with deep learning
Zhou, L., Chen, L., Zhu, T., Su, X., Dong, Y., Wen, L., Liu, H., Lu, X., Leng, J., Liu, Q., et al. (2026) · Computers & Industrial Engineering · doi:10.1016/j.cie.2026.111805 · Cited by 55
Liuzzi, P., Magliacano, A., Bellis, F. D., Mannini, A., & Estraneo, A. (2022) · Scientific Reports · doi:10.1038/s41598-022-17561-w · Cited by 46
Intelligent oncology: The convergence of artificial intelligence and oncology
Lin, B., Tan, Z., Mo, Y., Yang, X., Liu, Y., & Xu, B. (2022) · Journal of the National Cancer Center · doi:10.1016/j.jncc.2022.11.004 · Cited by 54
Moss, L., Corsar, D., Shaw, M., Piper, I., & Hawthorne, C. (2022) · Neurocritical Care · doi:10.1007/s12028-022-01504-4 · Cited by 48
“LIME has the advantages that it generates human-friendly explanations; works for tabular, text, and image data; and is relatively easy to use, whereas disadvantages include manual experimentation with different kernel settings for each application and a lack of stability in the explanations generated [28].”
BackgroundMethodInfluentialaEYE: A deep learning system for video nystagmus detection
Wagle, N., Morkos, J., Liu, J., Reith, H., Greenstein, J. L., Gong, K. D., Gangan, I., Pakhomov, D., Hira, S., Komogortsev, O. V., et al. (2022) · Frontiers in Neurology · doi:10.3389/fneur.2022.963968 · Cited by 41
“Further research into understanding the model’s predictions using explainable AI (27) may be useful for improving the model’s performance.”
BackgroundZhang, H., Lin, J., Hua, J., Zhang, T., & Tong, T. (2022) · Mechanical Systems and Signal Processing · doi:10.1016/j.ymssp.2022.109990 · Cited by 40
Machine Learning in Lithium‐Ion Battery Cell Production: A Comprehensive Mapping Study
Haghi, S., Hidalgo, M. F. V., Niri, M. F., Daub, R., & Marco, J. (2023) · Batteries & Supercaps · doi:10.1002/batt.202300046 · Cited by 45
Min, C., Wen, G., Gou, L., Li, X., & Yang, Z. (2023) · Energy · doi:10.1016/j.energy.2023.129211 · Cited by 43
TAI-PRM: trustworthy AI—project risk management framework towards Industry 5.0
Vyhmeister, E., & Castañé, G. G. (2024) · AI and Ethics · doi:10.1007/s43681-023-00417-y · Cited by 48
“However, specific cases can require detailed processes [28, 37, 48].”
Legesse, A., Beshah, B., Berhan, E., & Tesfaye, E. (2024) · Cogent Engineering · doi:10.1080/23311916.2024.2369220 · Cited by 52
“These discrepancies reflect different approaches and trade-offs between interpretability and predictive accuracy (Dziugaite et al., 2020; Deng et al., 2018; Linardatos et al., 2020).”
Zhou, Z., Jin, Y., Ye, H., Zhang, X., Liu, J., & Zhang, W. (2024) · BMC Medical Imaging · doi:10.1186/s12880-024-01347-9 · Cited by 50
“(2) Increasing the interpretability of reasoning : Current AI algorithms can detect subtle intracranial aneurysms in both arterial and venous sinuses, but lack interpretability in assessing postoperative recurrence risks or occlusion probabilities [63].”
BackgroundFlood Susceptibility Assessment in Urban Areas via Deep Neural Network Approach
Panfilova, T. A., Кукарцев, В. В., Тынченко, В. С., Tynchenko, Y. A., Kukartseva, O., Kleshko, I. I., Wu, X., & Malashin, I. P. (2024) · Sustainability · doi:10.3390/su16177489 · Cited by 40
Cybersecurity of Robotic Systems: Leading Challenges and Robotic System Design Methodology
Dutta, V., & Zielinska, T. T. (2021) · Electronics · doi:10.3390/electronics10222850 · Cited by 50
“It also prevents designers from choosing AI methods [119].”
MethodJaotombo, F., Pauly, V., Fond, G. B., Orléans, V., Auquier, P., Ghattas, B., & Boyer, L. (2022) · Journal of Market Access & Health Policy · doi:10.1080/20016689.2022.2149318 · Cited by 50
“More recently authors and researchers have made tremendous progress in the field of explainable AI, thus allowing for an interpretability of the ML predictions no less relevant than the classical LR models [57,58].”
BackgroundMachine Learning in Tremor Analysis: Critique and Directions
De, A., Bhatia, K. P., Volkmann, J., Peach, R. L., & Schreglmann, S. R. (2023) · Movement Disorders · doi:10.1002/mds.29376 · Cited by 47
“98 The absence of handcrafted custom features lends this approach more objectiveness but leads to a rather opaque view of features and the inner workings of the algorithms.”
BackgroundDu, J., Chang, X., Ye, C., Zeng, Y., Yang, S., Wu, S., & Li, L. (2023) · Scientific Reports · doi:10.1038/s41598-023-46281-y · Cited by 44
Video and Audio Deepfake Datasets and Open Issues in Deepfake Technology: Being Ahead of the Curve
Akhtar, Z., Pendyala, T. L., & Athmakuri, V. S. (2024) · Forensic Sciences · doi:10.3390/forensicsci4030021 · Cited by 60
Yoon, J. H., Lee, H., Kwon, D., Lee, D., Lee, S., Cho, E., Kim, J., & Kim, D. (2024) · Brain Communications · doi:10.1093/braincomms/fcae265 · Cited by 46
“139 Explainable artificial intelligence helps to develop trust by reinforcing the stability, predictability, and repeatability of interpretable models.”
BackgroundRecent machine learning-driven investigations into high entropy alloys: A comprehensive review
Yan, Y., Hu, X., Liao, Y., Zhou, Y., He, W., & Zhou, T. (2024) · Journal of Alloys and Compounds · doi:10.1016/j.jallcom.2024.177823 · Cited by 48
Explaining quantum circuits with Shapley values: towards explainable quantum machine learning
Heese, R., Gerlach, T., Mücke, S., Müller, S., Jakobs, M., & Piatkowski, N. (2025) · Quantum Machine Intelligence · doi:10.1007/s42484-025-00254-8 · Cited by 76
“A review of XAI exceeds the scope of this paper and we instead refer to, e.g., (Marcinkeviˇcs et al. 2020; Linardatos et al. 2020; Minh et al. 2022; Molnar 2022; Saeed and Omlin 2023) and references therein.”
Ontology Embedding: A Survey of Methods, Applications and Resources
Chen, J., Mashkova, O., Zhapa-Camacho, F., Hoehndorf, R., He, Y., & Horrocks, I. R. (2025) · IEEE Transactions on Knowledge and Data Engineering · doi:10.1109/tkde.2025.3559023 · Cited by 59
“Such embedded semantics can partially support analogical reasoning, e.g.”
Why we do need explainable AI for healthcare
Cinà, G., Röber, T. E., Goedhart, R., & Birbil, Ş. İ. (2025) · Diagnostic and Prognostic Research · doi:10.1186/s41512-025-00209-4 · Cited by 53
Zhang, K., Wang, D., Lin, F., Xie, J., & Zhou, W. (2026) · iScience · doi:10.1016/j.isci.2026.115026 · Cited by 48
“LRP-CNN 29 LRP-DNN 29 LRP-BiLRP 29 LRP-Deeplight LRP 19,29 CAM-based CAM 10,19,28,37,113 Widely applicable to various CNN models without retraining, providing visually intuitive, coarse localization maps for the predicted class.”
InfluentialArtificial intelligence in cardiovascular imaging—principles, expectations, and limitations
Antoniades, C. A., & Oikonomou, E. K. (2021) · European Heart Journal · doi:10.1093/eurheartj/ehab678 · Cited by 47
AI MSK clinical applications: cartilage and osteoarthritis
Joseph, G. B., McCulloch, C. E., Sohn, J. H., Pedoia, V., Majumdar, S., & Link, T. M. (2021) · Skeletal Radiology · doi:10.1007/s00256-021-03909-2 · Cited by 43
“Various techniques have been proposed to enhance explainability of neural networks such as integrated gradients, DeepLIFT [83], guided backpropagation [84], and deconvolution [85].”
MethodUsing Explainable Machine Learning to Improve Intensive Care Unit Alarm Systems
González‐Nóvoa, J. A., Busto, L., Rodriguez-Andina, J. J., Fariña, J., Segura, M., Gómez, V., Vila, D., & Veiga, C. (2021) · Sensors · doi:10.3390/s21217125 · Cited by 42
Feng, J., Zhang, H., Gao, K., Liao, Y., Yang, J., & Wu, G. (2022) · Case Studies in Construction Materials · doi:10.1016/j.cscm.2022.e01653 · Cited by 50
The nonlinearity of regulation in biological networks
Manicka, S., Johnson, K., Levin, M. G., & Murrugarra, D. (2023) · npj Systems Biology and Applications · doi:10.1038/s41540-023-00273-w · Cited by 41
“Methods for calculating controllability (e.g., linearity) are an important addition to recent efforts to solve the conundrum of interpretability of information structures in contexts ranging from machine learning to evolutionary developmental biology [28, 29, 30].”
BackgroundPrinzi, F., Militello, C., Scichilone, N., Gaglio, S., & Vitabile, S. (2023) · IEEE Access · doi:10.1109/access.2023.3327808 · Cited by 39
“Although Support Vector Machine (SVM) and Tree Ensemble are defined as black boxes, many techniques were developed [18], [31] for their post-hoc explanation [32].”
MethodAbraham, O. A., Ochiai, H., Hossain, M. D., Taenaka, Y., & Kadobayashi, Y. (2024) · IEEE Access · doi:10.1109/access.2024.3366493 · Cited by 38
“Although synthetic data generation is often considered a form of supervised learning owing to the creation of labels through a synthetic approach [20], [21], it applies to unsupervised methods when dealing with unlabeled data.”
BackgroundChen, J., Huang, W., Zhang, J., Debattista, K., & Han, J. (2025) · IEEE Transactions on Image Processing · doi:10.1109/tip.2025.3530787 · Cited by 48
“This alignment enhances representation smoothness, reducing the impact of noise, variability, and irrelevant information [4].”
Boujmiraz, S., Darhmaoui, H., & Maliani, A. D. E. (2026) · Computers and Education Artificial Intelligence · doi:10.1016/j.caeai.2026.100548 · Cited by 38
Support Matrix Regression for Learning Power Flow in Distribution Grid With Unobservability
Yuan, J., & Weng, Y. (2021) · IEEE Transactions on Power Systems · doi:10.1109/tpwrs.2021.3107551 · Cited by 40
“Since there is no physical degradability to explain the obtained solution, system operators find it difficult to trust the learning methods for decision-making in planning and operations [21]–[23].”
BackgroundTextual Feature Extraction Using Ant Colony Optimization for Hate Speech Classification
Gite, S., Patil, S., Dharrao, D., Yadav, M., Basak, S., Rajendran, A., & Kotecha, K. (2023) · Big Data and Cognitive Computing · doi:10.3390/bdcc7010045 · Cited by 37
Reliable interpretability of biology-inspired deep neural networks
(2023) · doi:10.1038/s41540-023-00310-8 · Cited by 37
Powershap: A Power-Full Shapley Feature Selection Method
Verhaeghe, J., Donckt, J. V. D., Ongenae, F., & Hoecke, S. V. (2023) · Lecture notes in computer science · doi:10.1007/978-3-031-26387-3_5 · Cited by 51
Feng, Z., Gani, H., Damayanti, A. D., & Gani, H. (2023) · Geoenergy Science and Engineering · doi:10.1016/j.geoen.2023.212231 · Cited by 42
Recent advances and applications of machine learning in electrocatalysis
Hu, Y., Chen, J., Wei, Z. X., He, Q., & Zhao, Y. (2023) · Journal of Materials Informatics · doi:10.20517/jmi.2023.23 · Cited by 44
Wireless Capsule Endoscopy Image Classification: An Explainable AI Approach
Varam, D., Mitra, R., Mkadmi, M., Riyas, R. A., Abuhani, D. A., Dhou, S., & Alzaatreh, A. (2023) · IEEE Access · doi:10.1109/access.2023.3319068 · Cited by 40
“SHAP values and LIME methods, as feature-based XAI techniques, are by far the most comprehensive and dominant across XAI methods for visualizing feature interactions and feature importance [58].”
MethodPandžić, F., & Capuder, T. (2023) · Energies · doi:10.3390/en17010097 · Cited by 49
Qureshi, U. R., Rashid, A., Altini, N., Bevilacqua, V., & Scala, M. L. (2024) · Smart Cities · doi:10.3390/smartcities7030053 · Cited by 42
“Two broad categories of methods are commonly employed to achieve [66,67]: perceptive explainability and mathematical interpretability.”
BackgroundMethodInfluentialBoosting efficiency in a clinical literature surveillance system with LightGBM
Lokker, C., Abdelkader, W., Bagheri, E., Parrish, R., Cotoi, C., Navarro, T., Germini, F., Linkins, L., Haynes, R. B., Chu, L., et al. (2024) · PLOS Digital Health · doi:10.1371/journal.pdig.0000299 · Cited by 45
Uddin, M. A., Islam, M. N., Maglaras, L. A., Janicke, H., & Sarker, I. H. (2025) · Digital Communications and Networks · doi:10.1016/j.dcan.2025.07.008 · Cited by 51
Roseiro, M., Henriques, J. M. O., Paredes, S., Rocha, T., & Sousa, J. P. (2023) · Computer Methods and Programs in Biomedicine · doi:10.1016/j.cmpb.2023.107347 · Cited by 41
Christie, E. H., Ertan, A., Adomaitis, L., & Klaus, M. (2023) · AI and Ethics · doi:10.1007/s43681-023-00261-0 · Cited by 44
“4 Scholars generally agree that “there is clear trade-off between the performance of a machine learning model and its ability to produce explain-able and interpretable predictions” [68].”
Explainable AI for malnutrition risk prediction from m-Health and clinical data
Martino, F. D., Delmastro, F., & Dolciotti, C. (2023) · Smart Health · doi:10.1016/j.smhl.2023.100429 · Cited by 45
Brandão, M., Mendes, F., Martins, M., Cardoso, P., Macedo, G., Mascarenhas, T., & Mascarenhas, M. (2024) · Journal of Clinical Medicine · doi:10.3390/jcm13041061 · Cited by 48
“Thus, several works have delved into the importance of explainable AI [97,98].”
BackgroundNguyen, V. G., Sharma, P., Ağbulut, Ü., Le, H. S., Cao, D. N., Dzida, M., Osman, S. M., Le, H. C., & Trần, V. D. (2024) · International Journal of Green Energy · doi:10.1080/15435075.2024.2326076 · Cited by 42
“It is possible to acquire cognitive abilities through the use of artificial intelligence in this domain (Linardatos, Papastefanopoulos, and Kotsiantis 2020).”
Masialeti, M., Talaei‐Khoei, A., & Yang, A. (2024) · International Journal of Information Management · doi:10.1016/j.ijinfomgt.2024.102779 · Cited by 51
Mishra, A. K., Chong, B., Arunachalam, S. P., Oberg, A. L., & Majumder, S. (2024) · The American Journal of Gastroenterology · doi:10.14309/ajg.0000000000002870 · Cited by 42
Opti-CAM: Optimizing saliency maps for interpretability
Zhang, H., Torres, F., Sicre, R., Avrithis, Y., & Ayache, S. (2024) · Computer Vision and Image Understanding · doi:10.1016/j.cviu.2024.104101 · Cited by 64
Confronting the data deluge: How artificial intelligence can be used in the study of plant stress
Koh, E., Sunil, R. S., Lam, H. Y. I., & Mutwil, M. (2024) · Computational and Structural Biotechnology Journal · doi:10.1016/j.csbj.2024.09.010 · Cited by 41
“Most interpretability methods for explaining deep learning models apply to image classification and feature the concept of saliency maps, which highlights the relative ‘importance ’ of the different image regions in producing the output (reviewed in [137]).”
Competing narratives in AI ethics: a defense of sociotechnical pragmatism
Watson, D., Mökander, J., & Floridi, L. (2024) · AI & Society · doi:10.1007/s00146-024-02128-2 · Cited by 56
“Methodological approaches to computing explanations vary (Linardatos et al. 2021; Rudin et al. 2021) and serve different purposes.”
Ante-Hoc Methods for Interpretable Deep Models: A Survey
Marino, A. D., Bevilacqua, V., Ciaramella, A., Falco, I. D., & Sannino, G. (2025) · ACM Computing Surveys · doi:10.1145/3728637 · Cited by 54
Explainable Artificial Intelligence: Advancements and Limitations
Aysel, H. I., Cai, X., & Prügel‐Bennett, A. (2025) · Applied Sciences · doi:10.3390/app15137261 · Cited by 44
“XAI techniques also assist practitioners in debugging their systems by identifying biases in data or in the models themselves [20,31].”
Alsharif, A. H., Wang, J., Isa, S. M., Salleh, N. Z. M., Dawas, H. A., & Alsharif, M. H. (2025) · Future Business Journal · doi:10.1186/s43093-025-00591-x · Cited by 50
“Privacy, data security, and consent issues emerge, emphasizing the need for transparency in complex AI models to address bias, fairness, and build trust [4, 16, 50, 210, 361].”
A Survey on Machine and Deep Learning Models for Childhood and Adolescent Obesity
Siddiqui, H., Rattani, A., Woods, N. K., Cure, L., Lewis, R. K., Twomey, J. M., Smith‐Campbell, B., & Hill, T. J. (2021) · IEEE Access · doi:10.1109/access.2021.3131128 · Cited by 43
“On the other hand, explainability is associated with the internal logic and mechanisms of the model [52].”
BackgroundXAI for Churn Prediction in B2B Models: A Use Case in an Enterprise Software Company
Díaz, G. M., Galán-Hernández, J. J., & Carrasco, R. A. (2022) · Mathematics · doi:10.3390/math10203896 · Cited by 41
Moussaid, A., Fkihi, S. E., Zennayi, Y., Lahlou, O., Kassou, I., Bourzeix, F., Mansouri, L. E., & Imani, Y. (2022) · Informatics · doi:10.3390/informatics9040080 · Cited by 44
Kawakura, S., Hirafuji, M., Ninomiya, S., & Shibasaki, R. (2022) · European Journal of Artificial Intelligence and Machine Learning · doi:10.24018/ejai.2022.1.3.14 · Cited by 41
Khuat, T. T., Kedziora, D. J., & Gabryś, B. (2023) · Foundations and Trends® in Human–Computer Interaction · doi:10.1561/1100000091 · Cited by 47
Kim, K., Yoon, Y., & Shin, S. (2024) · International Journal of Medical Informatics · doi:10.1016/j.ijmedinf.2024.105441 · Cited by 38
Feng, J., Li, J., Xu, C., Wang, Z., Zhang, Z., Wu, X., Lai, C., Zeng, Z., Tong, H., & Jiang, S. (2024) · Water Resources Research · doi:10.1029/2023wr036297 · Cited by 38
“Overall, the LSTM constructed in this study is deemed reliable in establishing predictive relationships and further obtaining meaningful information from the established models (Linardatos et al., 2020; Murdoch et al., 2019).”
Performance enhancement of artificial intelligence: A survey
Krichen, M., & Abdalzaher, M. S. (2024) · Journal of Network and Computer Applications · doi:10.1016/j.jnca.2024.104034 · Cited by 41
Machine learning applications in SEM-based pore analysis: a review
Papia, E.-M., Kondi, A., & Constantoudis, V. (2025) · Microporous and Mesoporous Materials · doi:10.1016/j.micromeso.2025.113675 · Cited by 44
Ahmed, H. C. H. R. (2026) · American Journal of Advanced Technology and Engineering Solutions · doi:10.63125/5xq3nd53 · Cited by 35
Doyen, S., & Dadario, N. B. (2022) · Frontiers in Digital Health · doi:10.3389/fdgth.2022.765406 · Cited by 35
“Unfortunately, as ML models have increased in complexity, this improvement has often been met with a trade-off in explainability, in which there is increasing uncertainty regarding the way these models actually operate (53).”
BackgroundInfluentialLee, K., Ayyasamy, M. V., Ji, Y., & Balachandran, P. V. (2022) · Scientific Reports · doi:10.1038/s41598-022-15618-4 · Cited by 53
“There are papers in the published literature, where the BD method is used for post-hoc model interpretability in a non-hierarchical learning setting 5,34–36 .”
BackgroundMethodDimensionality reduction of local structure in glassy binary mixtures
Coslovich, D., Jack, R. L., & Paret, J. (2022) · The Journal of Chemical Physics · doi:10.1063/5.0128265 · Cited by 35
Musacchio, N., Zilich, R., Ponzani, P., Guaita, G., Giorda, C. B., Heidbreder, R., Santin, P., & Cianni, G. D. (2023) · Journal of Diabetes · doi:10.1111/1753-0407.13361 · Cited by 40
“Furthermore, the “clear box” approach used by LLM yields “explainable AI,” which provides comprehensible and trustworthy results and output created by the ML algorithms.(23) In the present study, data were subjected to a first stage of modeling to allow ML to select automatically the most relevant factors related to i…”
MethodMeasuring responsible artificial intelligence (RAI) in banking: a valid and reliable instrument
Ratzan, J., & Rahman, N. (2023) · AI and Ethics · doi:10.1007/s43681-023-00321-5 · Cited by 42
Kokomoto, K., Kariya, R., Muranaka, A., Okawa, R., Nakano, K., & Nozaki, K. (2024) · BMC Oral Health · doi:10.1186/s12903-024-03928-0 · Cited by 44
“It is also crucial to know the decision-making process of AI for interpretability and explainability [38, 39].”
BackgroundCausal temporal graph attention network for fault diagnosis of chemical processes
Luo, J., Jin, Z., Jin, H., Li, Q., Ji, X., & Dai, Y. (2024) · Chinese Journal of Chemical Engineering · doi:10.1016/j.cjche.2024.01.019 · Cited by 34
Zirem, Y., Ledoux, L., Roussel, L., Maurage, C., Tirilly, P., Rhun, É. L., Meresse, B., Yagnik, G. B., Lim, M. J., Rothschild, K. J., et al. (2024) · Cell Reports Medicine · doi:10.1016/j.xcrm.2024.101482 · Cited by 36
“34,35 To address these limitations, we have developed a more comprehensive AI pipeline (Figure 1A) to provide reliable classification models and confident biomarker iden-tification.”
A Comparative Study and Systematic Analysis of XAI Models and their Applications in Healthcare
Gupta, J., & Seeja, K. R. (2024) · Archives of Computational Methods in Engineering · doi:10.1007/s11831-024-10103-9 · Cited by 62
“Accuracy: The actual relationship among the explanation provided by the explanation technique and the forecast from the ML model is referred to as accuracy [11, 12].”
Javid, A., & Toufigh, V. (2024) · Structural Concrete · doi:10.1002/suco.202301135 · Cited by 34
“77 It explores the variations in the input variables within a mathematical model and their influence on the predicted output.”
Uncertainty in XAI: Human Perception and Modeling Approaches
Chiaburu, T., Haußer, F., & Bießmann, F. (2024) · Machine Learning and Knowledge Extraction · doi:10.3390/make6020055 · Cited by 53
“Already, there have been exhaustive survey/review papers released aiming at structuring the wide array of XAI techniques available nowadays [9,11–13, The taxonomy of XAI techniques can be built upon various categorisation criteria (see Figure 1).”
BackgroundBai, Z., Osman, M. H. A., Brendel, M., Tangen, C. M., Flaig, T. W., Thompson, I. M., Plets, M., Lucia, M. S., Theodorescu, D., Gustafson, D. L., et al. (2025) · npj Digital Medicine · doi:10.1038/s41746-025-01560-y · Cited by 39
“This shows the inherent tradeoff between predictive power and the interpretability of the extracted features 56 .”
Syeda, A. (2025) · Plant Molecular Biology · doi:10.1007/s11103-025-01650-1 · Cited by 40
“…the inherent complexity of deep-learning frameworks often leads to "black box" models, making it difficult for researchers and breeders to under - stand the decision-making process and thereby necessitat - ing the development of more transparent and explainable AI systems (Linardatos et al. 2020 ).”
Explainable Artificial Intelligence: A systematic Review of Progress and Challenges
Mohamed, A., Abdelqader, K., & Shaalan, K. F. (2025) · Intelligent Systems with Applications · doi:10.1016/j.iswa.2025.200595 · Cited by 65
Pathak, A., Theagarajan, R., Rizqi, M. M., Nugraha, A. S., Boruah, T., Pratiksha, Kumar, H., Naik, B., Yadav, S., Jha, A. K., et al. (2025) · Discover Molecules · doi:10.1007/s44345-025-00037-5 · Cited by 43
“Complex deep learning models often provide accurate predictions but lack transparency in their decision-making processes, making it difficult for researchers and clinicians to understand and validate model outputs [223].”
A Framework and Benchmarking Study for Counterfactual Generating Methods on Tabular Data
Oliveira, R., & Martens, D. (2021) · Applied Sciences · doi:10.3390/app11167274 · Cited by 44
“To solve this deficiency, multiple strategies are proposed in a research domain commonly referred to as ‘eXplainable AI’ (XAI) [37], aimed at unveiling the high complexity of the models obtained through machine learning methodologies as deep neural networks [63, 20], ensemble methods [23, 57] and…”
MethodData-driven models for predicting community changes in freshwater ecosystems: A review
Lee, D., Lee, D., Cha, Y., Min, J.-H., & Park, Y. (2023) · Ecological Informatics · doi:10.1016/j.ecoinf.2023.102163 · Cited by 42
Ramaswami, G. S., Sušnjak, T., & Mathrani, A. (2022) · Big Data and Cognitive Computing · doi:10.3390/bdcc6040105 · Cited by 43
Requirements for Trustworthy Artificial Intelligence and its Application in Healthcare
Kim, M., Sohn, H., Choi, S. K., & Kim, S. (2023) · Healthcare Informatics Research · doi:10.4258/hir.2023.29.4.315 · Cited by 45
“Trustworthy AI in Healthcare rithm [12].”
BackgroundYaseliani, M., Maghsoodi, A. I., Hassannayebi, E., & Aickelin, U. (2023) · Computers & Industrial Engineering · doi:10.1016/j.cie.2023.109754 · Cited by 38
Artificial intelligence in corneal diseases: A narrative review
Nguyen, T. N., Ong, J., Masalkhi, M., Waisberg, E., Zaman, N., Sarker, P., Aman, S., Lin, H., Luo, M., Ambrósio, R., et al. (2024) · Contact Lens and Anterior Eye · doi:10.1016/j.clae.2024.102284 · Cited by 39
Kim, D., Jeong, J., & Choi, J. (2024) · ACS Omega · doi:10.1021/acsomega.4c04474 · Cited by 39
Investigating the Performance of the Informer Model for Streamflow Forecasting
Tepetidis, N., Koutsoyiannis, D., Iliopoulou, T., & Dimitriadis, P. (2024) · Water · doi:10.3390/w16202882 · Cited by 39
Role of Explainable AI in Crop Recommendation Technique of Smart Farming
Akkem, Y., Biswas, S. K., & Varanasi, A. (2025) · International Journal of Intelligent Systems and Applications · doi:10.5815/ijisa.2025.01.03 · Cited by 56
“XAI techniques allow stakeholders to understand why specific recommendations or predictions are made by ML models [2].”
Zeng, T., Jiang, H., Liu, Y., & Bai, Y. (2025) · Expert Systems with Applications · doi:10.1016/j.eswa.2025.126815 · Cited by 36
Enhancing Transparency in Smart Farming: Local Explanations for Crop Recommendations Using LIME
Akkem, Y., Biswas, S. K., Aruna, V., & Tripathi, D. (2025) · Procedia Computer Science · doi:10.1016/j.procs.2025.04.450 · Cited by 36
Similarity network fusion for the integration of multi-omics and microbiomes in respiratory disease
Narayana, J. K., Aogáin, M. M., Ali, N. A. B. M., Tsaneva-Atanasova, K. T., & Chotirmall, S. H. (2021) · European Respiratory Journal · doi:10.1183/13993003.01016-2021 · Cited by 35
On the risk of confusing interpretability with explicability
Herzog, C. (2021) · AI and Ethics · doi:10.1007/s43681-021-00121-9 · Cited by 35
“This is also supported by recent surveys on explainable AI that categorize published literature into post hoc approaches that create interpretable models, explain black-box deep learning models, or explain black-box models in a modelagnostic way [15].”
Wang, A., Mahmoud, M. S., Czasny, M., & Gurlo, A. (2022) · Integrating materials and manufacturing innovation · doi:10.1007/s40192-021-00247-y · Cited by 40
“This led to the development of explainable AI (XAI), which aims to introduce methods for deciphering the internal workings of black-box models and thus enabling users to understand the modeling processes and results [39, 40].”
BackgroundMethodInfluentialZhu, X., Hu, J., Xiao, T., Huang, S., Wen, Y., & Shang, D. (2022) · Frontiers in Pharmacology · doi:10.3389/fphar.2022.975855 · Cited by 37
“Thus, there is the room for improvement in techniques to interpret the results of ML methods (Linardatos et al., 2020).”
BackgroundMethod
Metadata
- Authors
- Linardatos, P., Papastefanopoulos, V., & Kotsiantis, S.
- Affiliations
- University of Patras (GR)
- Corresponding author
- Linardatos, Pantelis
- Venue
- Entropy
- Publisher
- MDPI AG
- Published
- 2020-12-25
- Volume
- 23
- Issue
- 1
- Pages
- 18
- ISSN
- 1099-4300 (ISSN-L)
- PMC
- PMC7824368
- OpenAlex
- W3116286104
- Cited by
- 2,922
- References
- 162
- Citations by year
- 2026: 485 · 2025: 702 · 2024: 701 · 2023: 565 · 2022: 370 · 2021: 97 · 2020: 1
- FWCI
- 8.89
- Type
- journal article
- Language
- en
- Open access
- gold
- doi.org
- Licence
- Locations
- Entropy (publishedVersion, cc-by)
- PubMed Central (publishedVersion, cc-by)
- PubMed (publishedVersion)
- DOAJ (DOAJ: Directory of Open Access Journals) (submittedVersion, cc-by-sa)
- Topics
- Physical Sciences › Computer Science › Artificial Intelligence › Explainable Artificial Intelligence (XAI)
- Physical Sciences › Computer Science › Software › Software Testing and Debugging Techniques
- Physical Sciences › Computer Science › Artificial Intelligence › Adversarial Robustness in Machine Learning
- Keywords
- explainable AI, model interpretability, black-box models, medical applications
About these checks
Registry, retraction, Cites and statistics results are computed, not judged, with one exception: a printed reference that no index lists is read once by a model before it counts as a citation error. Claims are extracted by a model and kept only when their quote appears verbatim in the text; each cited source is then checked, with a model’s help, for whether it says what the claim relies on. Those verdicts can be wrong — read the claim’s quote and the cited source before relying on one.
Statistics and arithmetic are recomputed, not judged.
Confidence bands are shown only for fields calibrated on our annotated test set. None is calibrated yet, so no band is shown.
What counts as a claim ›How we measure confidence ›How we check this ›
Are you an author, or do you see a problem with this page? Request a review
Data sources
Bibliographic data: Semantic Scholar, OpenAlex, Crossref.
Contains information from the Semantic Scholar Academic Graph Datasets, made available under the ODC Attribution License (ODC-BY 1.0).
Semantic Scholar’s data is described in: Kinney, R., et al. (2023). The Semantic Scholar Open Data Platform. arXiv:2301.10140.
