

The DOI matches its Crossref record; 230 of the 231 references it cites were found in a registry or an index.
Machine Learning and Integrative Analysis of Biomedical Big Data
Open accessAbstract
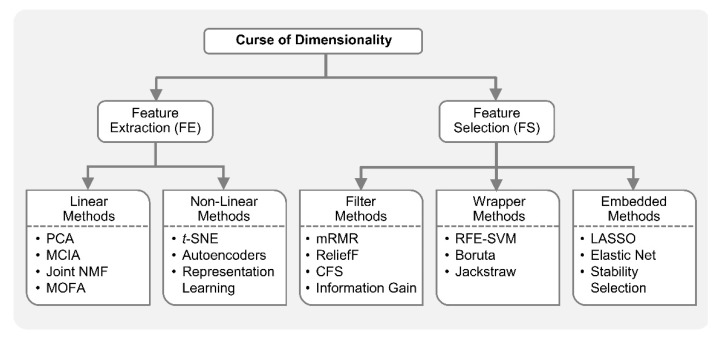
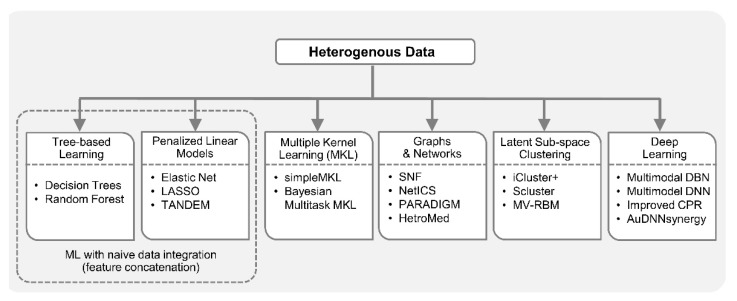
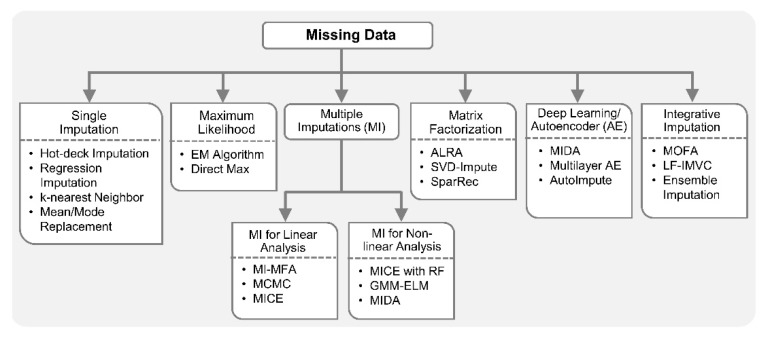
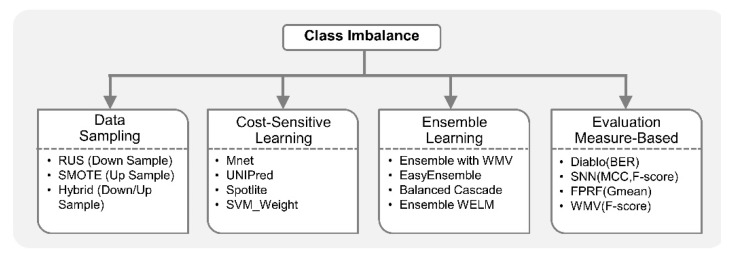
Recent developments in high-throughput technologies have accelerated the accumulation of massive amounts of omics data from multiple sources: genome, epigenome, transcriptome, proteome, metabolome, etc. Traditionally, data from each source (e.g., genome) is analyzed in isolation using statistical and machine learning (ML) methods. Integrative analysis of multi-omics and clinical data is key to new biomedical discoveries and advancements in precision medicine. However, data integration poses new computational challenges as well as exacerbates the ones associated with single-omics studies. Specialized computational approaches are required to effectively and efficiently perform integrative analysis of biomedical data acquired from diverse modalities. In this review, we discuss state-of-the-art ML-based approaches for tackling five specific computational challenges associated with integrative analysis: curse of dimensionality, data heterogeneity, missing data, class imbalance and scalability issues.
Overview
The claims and statistics of this paper haven’t been checked yet.
Run the check — free, no account needed. It reads the open-access text and checks the sources it cites.
Integrity signals
Registry
Cites
Statistics
Figures
Verification
Claims the paper makes
The claims and statistics of this paper haven’t been checked yet.
Run the check — free, no account needed. It reads the open-access text and checks the sources it cites.
Claims other papers make about this one
Each is checked against this paper’s own text: does it say what the citing paper says it does?
In the citing paper
“Machine learning (ML) and artificial intelligence (AI) have shown promise in overcoming some of these hindrances (e.g., Mirza et al., 2019; Zhu, 2020) and have gained popularity in recent years.”
From Missing data in multi-omics integration: Recent advances through artificial intelligence (2023) · cites this paper as Mirza et al., 2019
Self-check
Percentages, sums and reported differences re-computed from the paper’s own numbers.
The self-check needs the paper’s full text.
Citations
Cites
1 retracted
Rouillard, A. D., Wang, Z., & Ma’ayan, A. (2015) · Computational Biology and Chemistry · doi:10.1016/j.compbiolchem.2015.06.003 · Cited by 3
RetractedLeCun, Y., Bengio, Y., & Hinton, G. (2015) · Nature · doi:10.1038/nature14539 · Cited by 84,126
Cortes, C., & Vapnik, V. (1995) · Machine Learning · doi:10.1007/bf00994018 · Cited by 59,421
(2008) · Journal of Machine Learning Research · Cited by 33,051
SMOTE synthetic minority over-sampling technique
Chawla, N. V., Bowyer, K. W., Hall, L. O., & Kegelmeyer, W. P. (2002) · Journal of Artificial Intelligence Research · doi:10.1613/jair.953 · Cited by 32,865
Learning representations by back-propagating errors
Rumelhart, D. E., Hinton, G. E., & Williams, R. J. (1986) · Nature · doi:10.1038/323533a0 · Cited by 31,892
WGCNA: an R package for weighted correlation network analysis
Langfelder, P., & Horvath, S. (2008) · BMC Bioinformatics · doi:10.1186/1471-2105-9-559 · Cited by 27,252
The Elements of Statistical Learning
Hastie, T., Friedman, J., & Tibshirani, R. (2001) · Springer Series in Statistics · doi:10.1007/978-0-387-21606-5 · Cited by 24,162
Regularization and Variable Selection Via the Elastic Net
Zou, H., & Hastie, T. (2005) · Journal of the Royal Statistical Society Series B: Statistical Methodology · doi:10.1111/j.1467-9868.2005.00503.x · Cited by 20,957
Reducing the dimensionality of data with neural networks
Hinton, G. E., & Salakhutdinov, R. R. (2006) · Science · doi:10.1126/science.1127647 · Cited by 20,928
Research works printed but not linked: 9
- Narvaez-Bandera, I., and Sanchez, F. (2017). Integration of Multi Omics Data for Breast Cancer Subtype Classification. IIE Annual Conference Proceedings, Institute of Industrial and Systems Engineers (IISE).
- Rakotomamonjy, 2008, SimpleMKL, J. Mach. Learn. Res., 9, 2491
- Koller, D., and Friedman, N. (2009). Probabilistic Graphical Models: Principles and Techniques, MIT Press.
- Tsuyuzaki, K., and Nikaido, I. (arXiv, 2017). Biological Systems as Heterogeneous Information Networks: A Mini-review and Perspectives, arXiv.
- Rubin, D.B. (2004). Multiple Imputation for Nonresponse in Surveys, John Wiley & Sons.
- Singh, A., Gautier, B., Shannon, C.P., Rohart, F., Vacher, M., Tebutt, S.J., and Le Cao, K.-A. (2018). DIABLO: From multi-omics assays to biomarker discovery, an integrative approach. bioRxiv.
- Song, Y., Westerhuis, J.A., Aben, N., Wessels, L.F., Groenen, P.J., and Smilde, A.K. (arXiv, 2018). Generalized Simultaneous Component Analysis of Binary and Quantitative data, arXiv.
- Jaeger, 2003, Adaptive nonlinear system identification with echo state networks, Proceedings of the Advances in Neural Information Processing Systems, Volume 15, 593
- Hoi, S.C., Sahoo, D., Lu, J., and Zhao, P. (arXiv, 2018). Online Learning: A Comprehensive Survey, arXiv.
Cited by
Sorted by citations
Using machine learning approaches for multi-omics data analysis: A review
Reel, P. S., Reel, S., Pearson, E., Trucco, E., & Jefferson, E. (2021) · Biotechnology Advances · doi:10.1016/j.biotechadv.2021.107739 · Cited by 903
Loh, H. W., Ooi, C. P., Seoni, S., Barua, P. D., Molinari, F., & Acharya, U. R. (2022) · Computer Methods and Programs in Biomedicine · doi:10.1016/j.cmpb.2022.107161 · Cited by 734
Integration strategies of multi-omics data for machine learning analysis
Picard, M., Scott-Boyer, M.-P., Bodein, A., Périn, O., & Droit, A. (2021) · Computational and Structural Biotechnology Journal · doi:10.1016/j.csbj.2021.06.030 · Cited by 696
Artificial intelligence-based multi-omics analysis fuels cancer precision medicine
He, X., Liu, X., Zuo, F., Shi, H., & Jing, J. (2022) · Seminars in Cancer Biology · doi:10.1016/j.semcancer.2022.12.009 · Cited by 494
Big data and artificial intelligence modeling for drug discovery
Zhu, H. (2020) · Annual Review of Pharmacology and Toxicology · doi:10.1146/annurev-pharmtox-010919-023324 · Cited by 455
A roadmap for multi-omics data integration using deep learning
Kang, M., Ko, E., & Mersha, T. B. (2022) · Briefings in Bioinformatics · doi:10.1093/bib/bbab454 · Cited by 389
Xu, Y., Zhang, X., Li, H., Zheng, H., Zhang, J., Olsen, M. S., Varshney, R. K., Prasanna, B. M., & Qian, Q. (2022) · Molecular Plant · doi:10.1016/j.molp.2022.09.001 · Cited by 399
State of the field in multi-omics research: from computational needs to data mining and sharing
Krassowski, M., Das, V., Sahu, S. K., & Misra, B. B. (2020) · Frontiers in Genetics · doi:10.3389/fgene.2020.610798 · Cited by 351
Multi-omics integration in biomedical research – A metabolomics-centric review
Wörheide, M. A., Krumsiek, J., Kastenmüller, G., & Arnold, M. (2020) · Analytica Chimica Acta · doi:10.1016/j.aca.2020.10.038 · Cited by 373
Wani, N. A., Kumar, R., & Bedi, J. (2023) · Computer Methods and Programs in Biomedicine · doi:10.1016/j.cmpb.2023.107879 · Cited by 336
Artificial intelligence aids in development of nanomedicines for cancer management
Tan, P., Chen, X., Zhang, H., Wei, Q., & Luo, K. (2023) · Seminars in Cancer Biology · doi:10.1016/j.semcancer.2023.01.005 · Cited by 256
Liu, H., Zhang, W., Zou, B., Wang, J., Deng, Y., & Deng, L. (2019) · Nucleic Acids Research · doi:10.1093/nar/gkz1007 · Cited by 246
Self-citationBaião, A. R., Cai, Z., Poulos, R. C., Robinson, P. J., Reddel, R. R., Zhong, Q., Vinga, S., & Gonçalves, E. (2025) · Briefings in Bioinformatics · doi:10.1093/bib/bbaf355 · Cited by 274
Multi-omics data integration considerations and study design for biological systems and disease
Graw, S., Chappell, K., Washam, C. L., Gies, A. J., Bird, J. T., Robeson, M. S., & Byrum, S. D. (2020) · Molecular Omics · doi:10.1039/d0mo00041h · Cited by 231
Artificial Intelligence (AI)-Based Systems Biology Approaches in Multi-Omics Data Analysis of Cancer
Biswas, N., & Chakrabarti, S. (2020) · Frontiers in Oncology · doi:10.3389/fonc.2020.588221 · Cited by 226
Advancing Computational Toxicology by Interpretable Machine Learning
Jia, X., Wang, T., & Zhu, H. (2023) · Environmental Science & Technology · doi:10.1021/acs.est.3c00653 · Cited by 199
Web-based multi-omics integration using the Analyst software suite
Ewald, J., Zhou, G., Lu, Y. P., Kolic, J., Ellis, C. E., Johnson, J. D., MacDonald, P. E., & Xia, J. (2024) · Nature Protocols · doi:10.1038/s41596-023-00950-4 · Cited by 196
Missing data in multi-omics integration: Recent advances through artificial intelligence
Flores, J. E., Claborne, D. M., Weller, Z. D., Webb-Robertson, B.-J. M., Waters, K. M., & Bramer, L. M. (2023) · Frontiers in Artificial Intelligence · doi:10.3389/frai.2023.1098308 · Cited by 181
“Machine learning (ML) and artificial intelligence (AI) have shown promise in overcoming some of these hindrances (e.g., Mirza et al., 2019; Zhu, 2020) and have gained popularity in recent years.”
BackgroundAdvances in AI and machine learning for predictive medicine
Sharma, A. K., Lysenko, A., Jia, S., Boroevich, K. A., & Tsunoda, T. (2024) · Journal of Human Genetics · doi:10.1038/s10038-024-01231-y · Cited by 201
Metabolomics and Multi-Omics Integration: A Survey of Computational Methods and Resources
Eicher, T., Kinnebrew, G. H., Patt, A. C., Spencer, K., Ying, K. L., Ma, Q., Machiraju, R., & Mathé, E. A. (2020) · Metabolites · doi:10.3390/metabo10050202 · Cited by 191
Machine learning meets omics: applications and perspectives
Li, R., Li, L., Xu, Y., & Yang, J. (2021) · Briefings in Bioinformatics · doi:10.1093/bib/bbab460 · Cited by 186
Microbiome Multi-Omics Network Analysis: Statistical Considerations, Limitations, and Opportunities
Jiang, D., Armour, C. R., Hu, C., Meng, M., Tian, C., Sharpton, T. J., & Jiang, Y. (2019) · Frontiers in Genetics · doi:10.3389/fgene.2019.00995 · Cited by 170
Data Integration Challenges for Machine Learning in Precision Medicine
Martínez-García, M., & Hernández-Lemus, E. (2022) · Frontiers in Medicine · doi:10.3389/fmed.2021.784455 · Cited by 185
Multimodal data integration for oncology in the era of deep neural networks: a review
Waqas, A., Tripathi, A., Ramachandran, R. P., Stewart, P. A., & Rasool, G. (2024) · Frontiers in Artificial Intelligence · doi:10.3389/frai.2024.1408843 · Cited by 165
A Review of Machine Learning Algorithms for Biomedical Applications
Binson, V. A., Thomas, S., Subramoniam, M., Arun, J., Naveen, S., & Madhu, S. (2024) · Annals of Biomedical Engineering · doi:10.1007/s10439-024-03459-3 · Cited by 155
Exploration of databases and methods supporting drug repurposing: a comprehensive survey
Tanoli, Z., Seemab, U., Scherer, A., Wennerberg, K., Tang, J., & Vähä-Koskela, M. (2021) · Briefings in Bioinformatics · doi:10.1093/bib/bbaa003 · Cited by 131
Machine Learning: A New Prospect in Multi-Omics Data Analysis of Cancer
Arjmand, B., Hamidpour, S. K., Tayanloo-Beik, A., Goodarzi, P., Aghayan, H. R., Adibi, H., & Larijani, B. A. (2022) · Frontiers in Genetics · doi:10.3389/fgene.2022.824451 · Cited by 142
Sigcha, L., Borzì, L., Amato, F., Rechichi, I., Ramos-Romero, C. A., Cardenas, A. J. A., Gascó, L., & Olmo, G. (2023) · Expert Systems with Applications · doi:10.1016/j.eswa.2023.120541 · Cited by 148
Application of photoplethysmography signals for healthcare systems: An in-depth review
Loh, H. W., Xu, S., Faust, O., Ooi, C. P., Barua, P. D., Chakraborty, S., Tan, R., Molinari, F., & Acharya, U. R. (2022) · Computer Methods and Programs in Biomedicine · doi:10.1016/j.cmpb.2022.106677 · Cited by 132
Loh, H. W., Ooi, C. P., Vicnesh, J., Oh, S. L., Faust, O., Gertych, A., & Acharya, U. R. (2020) · Applied Sciences · doi:10.3390/app10248963 · Cited by 138
Loh, H. W., Hong, W., Ooi, C. P., Chakraborty, S., Barua, P. D., Deo, R. C., Soar, J., Palmer, E. E., & Acharya, U. R. (2021) · Sensors · doi:10.3390/s21217034 · Cited by 137
A Review of Integrative Imputation for Multi-Omics Datasets
Song, M., Greenbaum, J., Luttrell, J., Zhou, W., Wu, C., Shen, H., Gong, P., Zhang, C., & Deng, H.-W. (2020) · Frontiers in Genetics · doi:10.3389/fgene.2020.570255 · Cited by 127
Malik, V., Kalakoti, Y., & Sundar, D. (2021) · BMC Genomics · doi:10.1186/s12864-021-07524-2 · Cited by 117
Tasci, E., Zhuge, Y., Camphausen, K., & Krauze, A. V. (2022) · Cancers · doi:10.3390/cancers14122897 · Cited by 117
Morabito, A., Simone, G. D., Pastorelli, R., Brunelli, L., & Ferrario, M. (2025) · Journal of Translational Medicine · doi:10.1186/s12967-025-06446-x · Cited by 143
Naghib, A., Gharehchopogh, F. S., & Zamanifar, A. (2025) · Artificial Intelligence Review · doi:10.1007/s10462-024-11101-w · Cited by 135
Clark, C., Dayon, L., Masoodi, M., Bowman, G. L., & Popp, J. (2021) · Alzheimer s Research & Therapy · doi:10.1186/s13195-021-00814-7 · Cited by 120
Hassan, S. U., Abdulkadir, S. J., Zahid, M. S. M., & Al-Selwi, S. M. (2024) · Computers in Biology and Medicine · doi:10.1016/j.compbiomed.2024.109569 · Cited by 123
Multi-omics strategies for biomarker discovery and application in personalized oncology
Jiang, Z., Zhang, H., Gao, Y., & Sun, Y. (2025) · Molecular Biomedicine · doi:10.1186/s43556-025-00340-0 · Cited by 143
Loh, H. W., Ooi, C. P., Aydemir, E., Tuncer, T., Doğan, Ş., & Acharya, U. R. (2021) · Expert Systems · doi:10.1111/exsy.12773 · Cited by 104
Yoram Vodovotz, B., Barnard, N. D., Hu, F. B., Jakicic, J. M., Lianov, L. S., Loveland, D., Buysse, D. J., Szigethy, E., Finkel, T., Sowa, G., et al. (2020) · Frontiers in Medicine · doi:10.3389/fmed.2020.585744 · Cited by 116
Zanfardino, M., Franzese, M., Pane, K., Cavaliere, C., Monti, S., Esposito, G., Salvatore, M., & Aiello, M. (2019) · Journal of Translational Medicine · doi:10.1186/s12967-019-2073-2 · Cited by 99
Recent Developments along the Analytical Process for Metabolomics Workflows
González-Riaño, C., Dudzik, D., Garcı́a, A., Gil-de-la-Fuente, A., Gradillas, A., Godzień, J., López‐Gonzálvez, Á., Rey-Stolle, F., Rojo, D., Rupérez, F. J., et al. (2019) · Analytical Chemistry · doi:10.1021/acs.analchem.9b04553 · Cited by 96
Raufaste-Cazavieille, V., Santiago, R., & Droit, A. (2022) · Frontiers in Molecular Biosciences · doi:10.3389/fmolb.2022.962743 · Cited by 101
Franco, E. F., Rana, P., Cruz, A., Calderón, V. V., Azevedo, V., Ramos, R. T. J., & Ghosh, P. (2021) · Cancers · doi:10.3390/cancers13092013 · Cited by 92
Artificial intelligence in food science and nutrition: A narrative review
Miyazawa, T., Hiratsuka, Y., Toda, M., Hatakeyama, N., Ozawa, H., Abe, C., Cheng, T.-Y., Matsushima, Y., Miyawaki, Y., Ashida, K., et al. (2022) · Nutrition Reviews · doi:10.1093/nutrit/nuac033 · Cited by 91
Machine learning: its challenges and opportunities in plant system biology
Hesami, M., Alizadeh, M., Jones, A. M. P., & Torkamaneh, D. (2022) · Applied Microbiology and Biotechnology · doi:10.1007/s00253-022-11963-6 · Cited by 91
Multi-Omics Approaches in Immunological Research
Chu, X., Zhang, B., Koeken, V. A. C. M., Gupta, M. K., & Li, Y. (2021) · Frontiers in Immunology · doi:10.3389/fimmu.2021.668045 · Cited by 87
Recent advances in machine learning applications in metabolic engineering
Patra, P., Disha, B. R., Kundu, P., Das, M., & Ghosh, A. (2022) · Biotechnology Advances · doi:10.1016/j.biotechadv.2022.108069 · Cited by 90
Big data and artificial intelligence (AI) methodologies for computer-aided drug design (CADD)
Lee, J. W., Maria‐Solano, M. A., Vu, T. N. L., Yoon, S.-H., & Choi, S. (2022) · Biochemical Society Transactions · doi:10.1042/bst20211240 · Cited by 82
Big data: Historic advances and emerging trends in biomedical research
Cremin, C. J., Dash, S., & Huang, X. (2022) · Current Research in Biotechnology · doi:10.1016/j.crbiot.2022.02.004 · Cited by 91
Genome-Scale Metabolic Modeling of the Human Microbiome in the Era of Personalized Medicine
Heinken, A., Basile, A., Hertel, J., Thinnes, C. C., & Thiele, I. (2021) · Annual Review of Microbiology · doi:10.1146/annurev-micro-060221-012134 · Cited by 76
Pharmacometabonomics: data processing and statistical analysis
Fu, J., Zhang, Y., Liu, J., Lian, X., Tang, J., & Zhu, F. (2021) · Briefings in Bioinformatics · doi:10.1093/bib/bbab138 · Cited by 69
Combining Molecular, Imaging, and Clinical Data Analysis for Predicting Cancer Prognosis
Lobato-Delgado, B., Priego, B., & Morillo, D. (2022) · Cancers · doi:10.3390/cancers14133215 · Cited by 74
Deep neural network technique for automated detection of ADHD and CD using ECG signal
Loh, H. W., Ooi, C. P., Oh, S. L., Barua, P. D., Tan, Y. R., Molinari, F., March, S., Acharya, U. R., & Fung, D. S. S. (2023) · Computer Methods and Programs in Biomedicine · doi:10.1016/j.cmpb.2023.107775 · Cited by 71
Khaleghi, M. K., Savizi, I. S. P., Lewis, N. E., & Shojaosadati, S. A. (2021) · Biotechnology Journal · doi:10.1002/biot.202100212 · Cited by 70
Ji, L., Jazwinski, S. M., & Kim, S. (2021) · Annals of Geriatric Medicine and Research · doi:10.4235/agmr.21.0080 · Cited by 70
Kortbeek, R., Galland, M., Muras, A., van der Kloet, F. M., André, B., Heilijgers, M., van Hijum, S. A. F. T., Haring, M. A., Schuurink, R. C., & Bleeker, P. (2021) · BMC Plant Biology · doi:10.1186/s12870-021-03070-x · Cited by 58
Loh, H. W., Ooi, C. P., Dhok, S. G., Sharma, M. D., Bhurane, A. A., & Acharya, U. R. (2021) · Applied Intelligence · doi:10.1007/s10489-021-02597-8 · Cited by 60
From Multi-Omics Approaches to Precision Medicine in Amyotrophic Lateral Sclerosis
Morello, G., Salomone, S., D’Agata, V., Conforti, F. L., & Cavallaro, S. (2020) · Frontiers in Neuroscience · doi:10.3389/fnins.2020.577755 · Cited by 60
P4 Medicine as a model for precision periodontal care
Bartold, P. M., & Ivanovski, S. (2022) · Clinical Oral Investigations · doi:10.1007/s00784-022-04469-y · Cited by 65
Big data in biology: The hope and present-day challenges in it
Pal, S., Mondal, S., Das, G., Khatua, S., & Ghosh, Z. (2020) · Gene Reports · doi:10.1016/j.genrep.2020.100869 · Cited by 56
Artificial intelligence in the analysis of glycosylation data
Li, H., Chiang, A. W. T., & Lewis, N. E. (2022) · Biotechnology Advances · doi:10.1016/j.biotechadv.2022.108008 · Cited by 53
Boroni, M., Zonari, A. A. C., de Oliveira, C. R., Al-Katib, K., Cruz, E. A. O., Brace, L. E., & Carvalho, J. L. (2020) · Clinical Epigenetics · doi:10.1186/s13148-020-00899-1 · Cited by 56
Artificial Intelligence Models and Tools for the Assessment of Drug–Herb Interactions
Spanakis, M., Tzamali, E., Tzedakis, G., Koumpouzi, C., Pediaditis, M., Tsatsakis, A. M., & Sakkalis, V. (2025) · Pharmaceuticals · doi:10.3390/ph18030282 · Cited by 54
Metabolomics and modelling approaches for systems metabolic engineering
Khanijou, J. K., Kulyk, H., Bergès, C., Khoo, L. W., Ng, P., Yeo, H. C., Helmy, M., Bellvert, F., Chew, W., & Selvarajoo, K. (2022) · Metabolic Engineering Communications · doi:10.1016/j.mec.2022.e00209 · Cited by 48
Multi-omics data integration approaches for precision oncology
Aguila, R. C., Alonso-Pupo, N., & Hernández‐Rodríguez, E. W. (2022) · Molecular Omics · doi:10.1039/d1mo00411e · Cited by 52
Kunze, K. N., Polce, E. M., Nwachukwu, B. U., Chahla, J. A., & Nho, S. J. (2021) · Arthroscopy The Journal of Arthroscopic and Related Surgery · doi:10.1016/j.arthro.2021.01.005 · Cited by 47
Machine learning-based prediction of cognitive outcomes in de novo Parkinson’s disease
Harvey, J., Reijnders, R. A., Cavill, R., Duits, A., Köhler, S., Eijssen, L., Rutten, B. P. F., Shireby, G. L., Torkamani, A., Creese, B., et al. (2022) · npj Parkinson s Disease · doi:10.1038/s41531-022-00409-5 · Cited by 50
Multi-omics integration and epilepsy: Towards a better understanding of biological mechanisms
Chong, D., Jones, N. C., Schittenhelm, R. B., Anderson, A., & Casillas-Espinosa, P. M. (2023) · Progress in Neurobiology · doi:10.1016/j.pneurobio.2023.102480 · Cited by 45
Artificial Intelligence and Laryngeal Cancer: From screening to prognosis: A state of the art review
Bensoussan, Y., Vanstrum, E. B., Johns, M. M., & Rameau, A. (2023) · Otolaryngology–Head and Neck Surgery · doi:10.1177/01945998221110839 · Cited by 44
Multi-omics subtyping pipeline for chronic obstructive pulmonary disease
Gillenwater, L. A., Helmi, S., Stene, E., Pratte, K., Zhuang, Y., Schuyler, R. P., Lange, L. A., Castaldi, P. J., Hersh, C. P., Banaei‐Kashani, F., et al. (2021) · PLoS ONE · doi:10.1371/journal.pone.0255337 · Cited by 43
An Improved Method for Prediction of Cancer Prognosis by Network Learning
Kim, M., Oh, I., & Ahn, J. (2018) · Genes · doi:10.3390/genes9100478 · Cited by 43
Single‐Cell Multi‐Omics and Its Prospective Application in Cancer Biology
Peng, A., Mao, X., Zhong, J., Fan, S., & Hu, Y. (2020) · PROTEOMICS · doi:10.1002/pmic.201900271 · Cited by 44
Shokhirev, M. N., & Johnson, A. A. (2022) · Ageing Research Reviews · doi:10.1016/j.arr.2022.101721 · Cited by 42
Computational Methods for Single-Cell Imaging and Omics Data Integration
Watson, E. R., Fard, A. T., & Mar, J. C. (2022) · Frontiers in Molecular Biosciences · doi:10.3389/fmolb.2021.768106 · Cited by 46
Loh, H. W., Ooi, C. P., Oh, S. L., Barua, P. D., Tan, Y. R., Acharya, U. R., & Fung, D. S. S. (2023) · Cognitive Neurodynamics · doi:10.1007/s11571-023-10028-2 · Cited by 44
Resolving Clinical Phenotypes into Endotypes in Allergy: Molecular and Omics Approaches
Baye, T. M., Afanador, Y., Johansson, E., Proper, S. P., Bernstein, J. A., Rothenberg, M. E., & Hershey, G. K. K. (2020) · Clinical Reviews in Allergy & Immunology · doi:10.1007/s12016-020-08787-5 · Cited by 40
Rise of Deep Learning Clinical Applications and Challenges in Omics Data: A Systematic Review
Mohammed, M. A., Abdulkareem, K. H., Dinar, A. M., & García-Zapirain, B. (2023) · Diagnostics · doi:10.3390/diagnostics13040664 · Cited by 46
Capturing the latent space of an Autoencoder for multi-omics integration and cancer subtyping
Madhumita, M., & Paul, S. (2022) · Computers in Biology and Medicine · doi:10.1016/j.compbiomed.2022.105832 · Cited by 42
Multi-omics approaches to improve malaria therapy
Zhou, M., Varol, A., & Efferth, T. (2021) · Pharmacological Research · doi:10.1016/j.phrs.2021.105570 · Cited by 41
Yee, T. S., Shrifan, N. H. M. M., Al-Gburi, A. J. A., Isa, N. A. M., & Akbar, M. F. (2022) · IEEE Access · doi:10.1109/access.2022.3197291 · Cited by 37
An 8-gene machine learning model improves clinical prediction of severe dengue progression
Liu, Y. E., Saul, S., Rao, A., Robinson, M., Rojas, O. L. A., Sanz, A. M., Verghese, M., Solis, D., Sibai, M., Huang, C., et al. (2022) · Genome Medicine · doi:10.1186/s13073-022-01034-w · Cited by 35
Majeed, A., & Hwang, S. O. (2023) · IEEE Access · doi:10.1109/access.2023.3303509 · Cited by 35
Cho, B., Kim, K. M., Bilegsaikhan, S.-E., & Suh, Y. J. (2020) · Scientific Reports · doi:10.1038/s41598-020-71927-6 · Cited by 35
Capturing and querying fine-grained provenance of preprocessing pipelines in data science
Chapman, A. P., Missier, P., Simonelli, G., & Torlone, R. (2020) · Proceedings of the VLDB Endowment · doi:10.14778/3436905.3436911 · Cited by 35
Murarka, S., Wadichar, A., Bhurane, A. A., Sharma, M. D., & Acharya, U. R. (2022) · Computers in Biology and Medicine · doi:10.1016/j.compbiomed.2022.105594 · Cited by 35
Artificial Intelligence in Forensic Medicine and Toxicology: The Future of Forensic Medicine
Wankhade, T. D., Ingale, S., Mohite, P. M., & Bankar, N. J. (2022) · Cureus · doi:10.7759/cureus.28376 · Cited by 35
Bobo, W. V., Ommeren, B. V., & Athreya, A. P. (2022) · Expert Review of Clinical Pharmacology · doi:10.1080/17512433.2022.2112949 · Cited by 39
Martin, J. J. J., Song, Y., Hou, M., Zhou, L., Liu, X., Li, X., Fu, D., Li, Q., Cao, H., & Li, R. (2024) · International Journal of Molecular Sciences · doi:10.3390/ijms25147695 · Cited by 31
Mining nucleic acid “omics” to boost liquid biopsy in cancer
Tivey, A., Lee, R. J., Clipson, A., Hill, S. M., Lorigan, P. C., Rothwell, D. G., Dive, C., & Mouliere, F. C. (2024) · Cell Reports Medicine · doi:10.1016/j.xcrm.2024.101736 · Cited by 34
Bahado-Singh, R. O., Vishweswaraiah, S., Aydas, B., Yılmaz, A., Metpally, R. P. R., Carey, D. J., Crist, R. C., Berrettini, W. H., Wilson, G. D., Imam, K., et al. (2021) · PLoS ONE · doi:10.1371/journal.pone.0248375 · Cited by 32
Application of Machine Learning Algorithms to Predict Lymph Node Metastasis in Early Gastric Cancer
Tian, H., Ning, Z., Zong, Z., Liu, J., Hu, C., Ying, H., & Li, H. (2022) · Frontiers in Medicine · doi:10.3389/fmed.2021.759013 · Cited by 31
DeePathNet: A Transformer-Based Deep Learning Model Integrating Multiomic Data with Cancer Pathways
Cai, Z., Poulos, R. C., Aref, A., Robinson, P. J., Reddel, R. R., & Zhong, Q. (2024) · Cancer Research Communications · doi:10.1158/2767-9764.crc-24-0285 · Cited by 36
Integration of solutions and services for multi-omics data analysis towards personalized medicine
Reska, D., Czajkowski, M., Jurczuk, K., Bołdak, C., Kwedlo, W., Bauer, W., Koszelew, J., & Krętowski, M. (2021) · Journal of Applied Biomedicine · doi:10.1016/j.bbe.2021.10.005 · Cited by 30
Repurposing Drugs via Network Analysis: Opportunities for Psychiatric Disorders
Truong, T. T. T., Panizzutti, B., Kim, J. H., & Walder, K. R. (2022) · Pharmaceutics · doi:10.3390/pharmaceutics14071464 · Cited by 33
Knowledge Generation with Rule Induction in Cancer Omics
Scala, G., Federico, A., Fortino, V., Greco, D., & Majello, B. (2019) · International Journal of Molecular Sciences · doi:10.3390/ijms21010018 · Cited by 29
Lu, C., Lubin, J. H., Sarma, V., Stentz, S. Z., Wang, G., Wang, S., & Khare, S. D. (2023) · Proceedings of the National Academy of Sciences · doi:10.1073/pnas.2303590120 · Cited by 28
A Brief Review of Machine Learning-Based Bioactive Compound Research
Park, J., Beck, B. R., Kim, H. H., Lee, S.-B., & Kang, K. (2022) · Applied Sciences · doi:10.3390/app12062906 · Cited by 30
Mengelkoch, S., Rose, S. M. S., Lautman, Z., Alley, J. C., Roos, L. G., Ehlert, B., Moriarity, D. P., Lancaster, S. M., Snyder, M. P., & Slavich, G. M. (2023) · Brain Behavior and Immunity · doi:10.1016/j.bbi.2023.07.022 · Cited by 30
Metadata
- Authors
- Mirza, B., Wang, W., Wang, J., Choi, H., Chung, N. C., & Ping, P.
- Affiliations
- University of California, Los Angeles (US)
- Corresponding author
- Mirza, Bilal
- Ping, Peipei
- Venue
- Genes
- Publisher
- MDPI AG
- Published
- 2019-01-28
- Volume
- 10
- Issue
- 2
- Pages
- 87
- ISSN
- 2073-4425 (ISSN-L)
- PMC
- PMC6410075
- OpenAlex
- W2912411326
- Cited by
- 380
- References
- 231
- Citations by year
- 2026: 36 · 2025: 68 · 2024: 51 · 2023: 58 · 2022: 72 · 2021: 54 · 2020: 31 · 2019: 9
- FWCI
- 3.66
- Type
- journal article
- Language
- en
- Open access
- gold
- dx.doi.org
- Licence
- Locations
- Genes (publishedVersion, cc-by)
- Europe PMC (PubMed Central) (publishedVersion, cc-by)
- PubMed Central (publishedVersion, cc-by)
- PubMed (publishedVersion)
- eScholarship (California Digital Library) (submittedVersion, cc-by)
- DOAJ (DOAJ: Directory of Open Access Journals) (submittedVersion, cc-by-sa)
- eScholarship (California Digital Library) (submittedVersion)
- Funders
- National Institutes of Health (R35-HL135772, U54-GM114833)
- Topics
- Life Sciences › Biochemistry, Genetics and Molecular Biology › Molecular Biology › Bioinformatics and Genomic Networks
- Life Sciences › Biochemistry, Genetics and Molecular Biology › Molecular Biology › Gene expression and cancer classification
- Health Sciences › Health Professions › Health Information Management › Artificial Intelligence in Healthcare
- Keywords
- multi-omics integration, integrative analysis, machine learning, precision medicine, curse of dimensionality, data heterogeneity, missing data, class imbalance, scalability, omics data, clinical data
- MeSH terms
- Machine Learning, Big Data, Animals, Humans, Computational Biology
About these checks
Registry, retraction, Cites and statistics results are computed, not judged, with one exception: a printed reference that no index lists is read once by a model before it counts as a citation error. Claims are extracted by a model and kept only when their quote appears verbatim in the text; each cited source is then checked, with a model’s help, for whether it says what the claim relies on. Those verdicts can be wrong — read the claim’s quote and the cited source before relying on one.
Statistics and arithmetic are recomputed, not judged.
Confidence bands are shown only for fields calibrated on our annotated test set. None is calibrated yet, so no band is shown.
What counts as a claim ›How we measure confidence ›How we check this ›
Are you an author, or do you see a problem with this page? Request a review
