

Mindfulness-Based Interventions for People with Schizophrenia: A Systematic Review and Meta-Analysis
Open accessThe DOI matches its Crossref record; 60 of the 60 references it cites were found in a registry or an index; 7 of the 54 sources its claims cite were checked for support.
Abstract
(1) Background: There is increasing interest in the practice of mindfulness-based interventions (MBIs) to treat people with schizophrenia, as evidenced by the publication of different randomized controlled trials (RCTs). However, no meta-analysis of RCTs has been carried out to date with the exclusive inclusion of this type of interventions. (2) Objective: To analyze empirical evidence regarding the effectiveness of MBIs for the improvement of clinical parameters associated with schizophrenia. Method: A systematic review and meta-analysis was conducted of RCTs published in the databases PsycINFO, PubMed, WOS, and Cochrane Library. (3) Results: A total of 10 articles (n = 1094) fulfilled the criteria for inclusion in the review. The analysis of these studies suggests that MBIs combined with standard interventions are able to generate significant improvements in a variety of clinical schizophrenia-related parameters, such as the intensity of overall symptomatology (g = 0.72), positive symptoms (g = 0.32), negative symptoms (g = 0.40), functioning level (g = 1.28), and awareness of illness (g = 0.65). (4) Conclusions: There is evidence that supports the effectiveness and safety of MBIs for the treatment of people with schizophrenia. The results obtained by MBIs are comparable to those obtained by cognitive-behavioral therapy for psychosis. However, given the heterogeneity of the applied interventions and the methodological limitations found in the reviewed trials, the results should be interpreted with caution.
Overview
CoChat Summary
TL;DR
This systematic review and meta-analysis of 10 RCTs (n = 1094) found that mindfulness-based interventions (MBIs) added to treatment as usual produced significant improvements in schizophrenia-related clinical parameters, with moderate-to-large effects on overall symptomatology and small-to-moderate effects on positive and negative symptoms. The authors conclude MBIs are effective and safe for people with schizophrenia, but caution that heterogeneity and methodological limitations require cautious interpretation.
Key findings
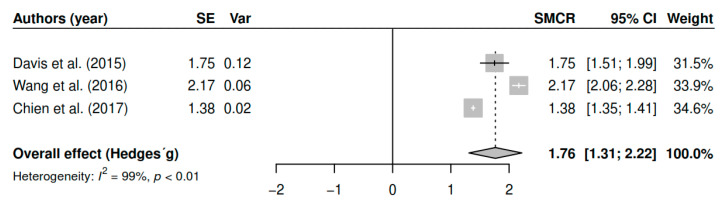
- Across 10 RCTs (n = 1094; 420 participants, 38.4%, received an MBI), MBIs plus standard interventions significantly improved overall symptomatology at posttest (k = 9; n = 726; g = 0.72, p < 0.01) and at 6-month follow-up (k = 3; n = 344; g = 1.76, p < 0.01).
- Significant posttest effects were also reported for positive symptoms (k = 5; n = 506; g = 0.32, p = 0.03), negative symptoms (k = 5; n = 506; g = 0.40, p < 0.01), mindfulness abilities (k = 4; n = 178; g = 1.48, p = 0.01), functioning (k = 4; n = 493; g = −1.28, p < 0.01), and awareness of illness (k = 4; n = 493; g = −0.65, p < 0.01).
- Heterogeneity was high for all analyzed outcomes (e.g., overall symptomatology posttest I² = 99.60; positive symptoms I² = 99.20; negative symptoms I² = 82.50).
- No reviewed study reported harmful effects related to MBIs; average dropout rate in MBIs was 15.6%, and the authors state MBI results were comparable to those obtained by cognitive-behavioral therapy for psychosis.
Methods
- Systematic review and meta-analysis of RCTs published up to 25 March 2020, searched in PsycINFO, PubMed, WOS, and Cochrane Library; protocol registered in PROSPERO (CRD42019128466).
- Inclusion criteria: adults diagnosed with schizophrenia or related disorders (schizophrenia, schizoaffective, or delusional disorder per DSM/ICD); intervention group received an MBI similar to MBSR or MBCT; control group was waitlist or treatment as usual; outcomes were psychological variables related to schizophrenia.
- Effect sizes were calculated using standardized mean change with raw score standardization (SMCR), with bias correction; random-effects models used restricted maximum likelihood (REML); heterogeneity assessed with Cochran’s Q and I²; meta-regression, sensitivity analyses, and publication-bias assessments (funnel plots, Egger’s test, trim-and-fill) were conducted where sufficient studies were available.
Limitations
- Stated by the authors: five of the ten studies had methodological quality issues that threaten validity; high heterogeneity was found and may relate to differences in MBI protocols, psychoeducational contents, geographic locations, and ethnic backgrounds; four studies used samples exclusively of recently diagnosed volunteers, limiting generalizability.
- Stated by the authors: psychoeducational contents in the MBIs are active ingredients, so results cannot be attributed to mindfulness with absolute certainty.
- Evident from the text: several outcomes were based on few studies (k = 3–5), and heterogeneity was very high (I² often > 95%), which limits confidence in pooled estimates; the authors also note that empirical evidence is still scarce and further methodologically rigorous studies are needed.
Model-written summary. Check it against the paper before relying on it.
Integrity signals
Registry
Cites
Statistics
Figures




Verification
Claims the paper makes
5 Valid · 0 Not valid · 25 Not checked · 50 Own results and interpretations
None of the sources cited for this claim have been checked yet.
In the paper
“The results obtained with these three methods lead to similar results in all the variables analyzed.”
§ Mindfulness-Based Interventions for People with Schizophrenia: A Systematic Review and Meta-Analysis > 3. Results > 3.8. Additional Analyses
What the sources say
- Could not verifycites [40] Veroniki A.A. Jackson D. Viechtbauer W. Bender R. Bowden J. Knapp G. Kuss O. Higgins J.P.T. Langan D. Salanti G. Methods to estimate the between-study variance and its uncertainty in meta-analysis Res. Synth. Methods 2016 7 55 79 10.1002/jrsm.1164 26332144 PMC4950030 sourceExperimental — accuracy not yet measured
Our copy of Veroniki et al. (2016) is a review of 16 estimators of the between-study variance (tau2) plus seven ways to quantify its uncertainty; nowhere does it describe 'three robust methods of effect size estimation' or report that such methods agreed across analysed variables (searched: robust methods of effect size estimation, similar results across variables/outcomes, illustrative examples). Its Illustrative examples section applies many tau2 estimators to four meta-analyses that all concern the same outcome (overall survival, log hazard ratio), not several variables, and its Comparative evaluation opening states the opposite tendency — that 'the different estimators can provide noticeably different or even conflicting results'. The similarity claim therefore cannot be checked against this source; it appears to be the citing authors' own analysis result. (LLM, conf=0.72)
- Not checked yetcites [44] Ausina J.B. Meca J.S. Meta-Análisis en Ciencias Sociales y de la Salud Síntesis Madrid, Spain 2015 978-84-9077-124-2
plain- Asserted: passes — The authors put it forward as true.
- Checkable: passes — It can be checked against evidence.
- Load-bearing: unclear — It is unclear whether the paper’s conclusions depend on it.
- Based: passes — The paper gives a reason why it holds.
- Could not verify
The sources with a verdict support this claim; the rest weren’t checked yet, have no full text we could read, or their verdicts aren’t rated yet.
In the paper
“However, it is relevant to note that the four meta-analyses cited included in their analyses both MBI’s and acceptance-based approaches (ACT or DBT), which, as mentioned, have significant differences between them.”
§ Mindfulness-Based Interventions for People with Schizophrenia: A Systematic Review and Meta-Analysis > 1. Introduction
What the sources say
- Not checked yetcites [27] Khoury B. Lecomte T. Gaudiano B.A. Paquin K. Mindfulness interventions for psychosis: A meta-analysis Schizophr. Res. 2013 150 176 184 10.1016/j.schres.2013.07.055 23954146 source
- Supportedcites [28] Cramer H. Lauche R. Haller H. Langhorst J. Dobos G. Mindfulness-and acceptance-based interventions for psychosis: A systematic review and meta-analysis Glob. Adv. Health Med. 2016 5 30 43 10.7453/gahmj.2015.083 26937312 PMC4756771 source
The Methods (Eligibility Criteria; page unavailable) allow both mindfulness-based interventions and acceptance-based approaches such as ACT. The Results (Study Characteristics; page unavailable) report four RCTs of each type, confirming that this cited meta-analysis included both. (LLM, conf=0.92)
- Not checked yetcites [29] Louise S. Fitzpatrick M. Strauss C. Rossell S.L. Thomas N. Mindfulness- and acceptance-based interventions for psychosis: Our current understanding and a meta-analysis Schizophr. Res. 2018 192 57 63 10.1016/j.schres.2017.05.023 28545945 source
plain- Asserted: passes — The authors put it forward as true.
- Checkable: passes — It can be checked against evidence.
- Load-bearing: passes — The paper’s conclusions depend on it.
- Based: passes — The paper gives a reason why it holds.
The sources with a verdict support this claim; the rest weren’t checked yet, have no full text we could read, or their verdicts aren’t rated yet.
In the paper
“They all included studies in which participants had psychotic symptoms but not necessarily a diagnosis of schizophrenia spectrum disorder (e.g., major depression with psychotic symptoms).”
§ Mindfulness-Based Interventions for People with Schizophrenia: A Systematic Review and Meta-Analysis > 1. Introduction
What the sources say
- Not checked yetcites [27] Khoury B. Lecomte T. Gaudiano B.A. Paquin K. Mindfulness interventions for psychosis: A meta-analysis Schizophr. Res. 2013 150 176 184 10.1016/j.schres.2013.07.055 23954146 source
- Supportedcites [28] Cramer H. Lauche R. Haller H. Langhorst J. Dobos G. Mindfulness-and acceptance-based interventions for psychosis: A systematic review and meta-analysis Glob. Adv. Health Med. 2016 5 30 43 10.7453/gahmj.2015.083 26937312 PMC4756771 source
The Results (Study Characteristics) show that this meta-analysis included patients with an affective disorder with psychotic symptoms, not only patients diagnosed with schizophrenia-spectrum disorders. Table 1 specifically lists a mood disorder with psychotic features among the diagnoses in an included study. This confirms the claim as it applies to this cited meta-analysis; the paper does not establish the inclusion criteria of the other three. (LLM, conf=0.91)
- Not checked yetcites [29] Louise S. Fitzpatrick M. Strauss C. Rossell S.L. Thomas N. Mindfulness- and acceptance-based interventions for psychosis: Our current understanding and a meta-analysis Schizophr. Res. 2018 192 57 63 10.1016/j.schres.2017.05.023 28545945 source
plain- Asserted: passes — The authors put it forward as true.
- Checkable: passes — It can be checked against evidence.
- Load-bearing: passes — The paper’s conclusions depend on it.
- Based: passes — The paper gives a reason why it holds.
The cited sources support only part of this claim — read each source’s verdict below.
In the paper
“The effects obtained from MBIs in this review were comparable to those obtained in meta-analytic studies regarding the effectiveness of CBT in the reduction of positive and negative symptoms [23,66,67].”
§ Mindfulness-Based Interventions for People with Schizophrenia: A Systematic Review and Meta-Analysis > 4. Discussion
What the sources say
- Supportedcites [23] Hazell C.M. Hayward M. Cavanagh K. Strauss C. A systematic review and meta-analysis of low intensity CBT for psychosis Clin. Psychol. Rev. 2016 45 183 192 10.1016/j.cpr.2016.03.004 27048980 source
Section 4.1, “Effects on psychosis,” compares this meta-analysis’s CBTp effect with reported meta-analytic effects for positive and negative symptoms and describes them as consistent. It cautions that comparability between low- and high-intensity CBTp would require a direct comparison. The citing authors’ MBI results are their own comparison, not a finding attributed to this source. (LLM, conf=0.93)
- Not checked yetcites [66] Jauhar S. McKenna P.J. Radua J. Fung E. Salvador R. Laws K.R. Cognitive–behavioural therapy for the symptoms of schizophrenia: Systematic review and meta-analysis with examination of potential bias Br. J. Psychiatry 2014 204 20 29 10.1192/bjp.bp.112.116285 24385461 source
- Partly supportedcites [67] Lutgens D. Gariepy G. Malla A. Psychological and psychosocial interventions for negative symptoms in psychosis: Systematic review and meta-analysis Br. J. Psychiatry 2017 210 324 332 10.1192/bjp.bp.116.197103 28302699 sourceExperimental — accuracy not yet measured
The Cognitive-behavioural therapies (CBT) section reports a pooled benefit of CBT for negative symptoms in psychosis. This paper does not establish CBT’s effectiveness for positive symptoms. The comparison with MBI effects is the citing authors’ own conclusion, not a finding attributed to this source. (LLM, conf=0.86)
plain- Asserted: passes — The authors put it forward as true.
- Checkable: passes — It can be checked against evidence.
- Load-bearing: passes — The paper’s conclusions depend on it.
- Based: passes — The paper gives a reason why it holds.
- Supported
The sources with a verdict support this claim; the rest weren’t checked yet, have no full text we could read, or their verdicts aren’t rated yet.
In the paper
“This is possibly partly due to a cautious reaction to a few early research papers, which found a relationship between meditation practice and the emergence of psychotic-type symptoms [14,15].”
§ Mindfulness-Based Interventions for People with Schizophrenia: A Systematic Review and Meta-Analysis > 1. Introduction
What the sources say
- Not checked yetcites [14] Epstein M.D. Lieff J.D. Psychiatric complications of meditation practice J. Transpers. Psychol. 1981 13 137 147
- Supportedcites [15] Walsh R. Roche L. Precipitation of acute psychotic episodes by intensive meditation in individuals with a history of schizophrenia Am. J. Psychiatry 1979 136 1085 1086 10.1176/ajp.136.8.1085 380368 source
Walsh & Roche (1979) is exactly one of the early papers reporting such a relationship: its case reports (p. 2-3) describe three acute schizophrenic/psychotic episodes arising during intensive meditation retreats, and the Discussion (p. 3) concludes that 'the combination of intensive meditation, fasting, sleep deprivation, a history of schizophrenia... can be hazardous.' The introduction (p. 2) also reviews 'several reports of adverse meditation effects, including depersonalization, altered reality testing.' The claim asserts only a relationship (not causation, and at the same hedged level as the source), so it is supported; the source's population is narrower (individuals with a history of schizophrenia, with fasting/sleep deprivation), which the citing sentence does not carry as a qualifier. (LLM, conf=0.85)
plainstates an association- Asserted: passes — The authors put it forward as true.
- Checkable: passes — It can be checked against evidence.
- Load-bearing: unclear — It is unclear whether the paper’s conclusions depend on it.
- Based: passes — The paper gives a reason why it holds.
36 more claims · 1 with their cited sources checked
Create a free account to see all 80 claims and to verify the 47 references still open.
- The quote only partly states this claim. 8
- It may state two separate claims as one. 26
- Probably not a substantial claim. 15
Claims other papers make about this one
Each is checked against this paper’s own text: does it say what the citing paper says it does?
The source backs part of the claim, not all of it — or backs it for a different population, condition or comparison.
In the citing paper
“Recent randomised control studies and meta-analyses showed that mindfulness-based interventions significantly improved DM, negative emotions, positive symptoms and negative symptoms compared with control groups.43–49”
From Dispositional Mindfulness and Psychotic Symptoms in Schizophrenia Spectrum Disorders: The Mediating Roles of Rumination and Negative Emotion (2022) · cites this paper as [48]
Experimental — accuracy not yet measuredThe cited source says what the claim attributes to it.
In the citing paper
“Systematic reviews and meta-analyses of mindfulness-based programs for psychosis have found a range of improvements for psychotic symptoms, with larger improvements for functioning and illness awareness and smaller improvements for the positive symptoms, such as delusions and hallucinations (Yip et al., 2024; Hodann-Caudevilla et al., 2020).”
From “I was trying to save the world”: delusion-like ideation and associated impacts reported by Western practitioners of Buddhist meditation (2025) · cites this paper as Hodann-Caudevilla et al., 2020
The cited source says what the claim attributes to it.
In the citing paper
“The low dropout rate of 6%, compared to the 15.6% average found in a systematic review of MBIs for SSD supports the intervention’s acceptability.53”
Statistics recomputed
Every reported test result, recomputed from its test statistic and degrees of freedom. A result shows as not adding up only once an independent check has confirmed it.
- ConsistentQ(8) = 1910.8reported p < .01 · recomputed p < .001
“Q (8) = 1910.8, p < .01”
- ConsistentQ(2) = 187.72reported p < .01 · recomputed p < .001
“Q (2) = 187.72, p < .01”
- ConsistentQ(4) = 484.1reported p < .01 · recomputed p < .001
“Q (4) = 484.10, p < .01”
- ConsistentQ(4) = 22.8reported p < .01 · recomputed p < .001
“Q (4) = 22.80, p < .01”
- ConsistentQ(3) = 220.19reported p < .01 · recomputed p < .001
“Q (3) = 220.19, p < .01”
5 more recomputed tests
Create a free account to see every test the Stats check recomputed.
Self-check
Percentages, sums and reported differences re-computed from the paper’s own numbers.
Each contradiction between two passages listed here was confirmed by an independent check.
Rated major: it would touch a result — a value a result rests on, reported and recomputed p-values on opposite sides of the significance level, two passages that conflict with no sign which is right, or a cited work retracted before this paper was published.
In the paper
§ Mindfulness-Based Interventions for People with Schizophrenia: A Systematic Review and Meta-Analysis > 2. Method > 2.2. Selection Criteria
“(4) the control group consisted of a waitlist or treatment as usual (TAU);”
§ Mindfulness-Based Interventions for People with Schizophrenia: A Systematic Review and Meta-Analysis > 3. Results > 3.3. Design of the Studies
“Two different types of control conditions were identified: (a) active treatments of a psychological type: psychoeducational or social support interventions (n = 272) and (b) non-psychological standard interventions (treatment as usual, TAU): medical-pharmacological treatments (n = 402).”
Rated minor: it would not touch a result — a value no result rests on, a p-value that stays on the same side of the significance level, or a conflict that is clerical, resolved elsewhere in the paper, or outside its own findings.
In the paper
§ Mindfulness-Based Interventions for People with Schizophrenia: A Systematic Review and Meta-Analysis > 1. Introduction
“Thus, only one reported large effects on overall symptomology [30], and two reported small effects [28,29].”
§ Mindfulness-Based Interventions for People with Schizophrenia: A Systematic Review and Meta-Analysis > 4. Discussion
“In the reviews by Cramer et al. [28], Louise et al., [29] and Jansen et al. [30], treatments produced small to moderate effects on overall symptomatology, which is in line with our findings;”
Citations
Cites
Diagnostic and Statistical Manual of Mental Disorders
American Psychiatric Association (2013) · doi:10.1176/appi.books.9780890425596 · Cited by 116,369
Measuring inconsistency in meta-analyses
Higgins, J. P. T., Thompson, S. G., Deeks, J. J., & Altman, D. G. (2003) · BMJ · doi:10.1136/bmj.327.7414.557 · Cited by 63,139 · cited 2×
“This procedure allows the generalization of the findings, considering the individual studies as a random sample of the population [41].”
MethodBias in meta-analysis detected by a simple, graphical test
Egger, M., Smith, G. D., Schneider, M., & Minder, C. (1997) · BMJ · doi:10.1136/bmj.315.7109.629 · Cited by 56,722 · cited 1×
“The publication bias was assessed when there were five or more studies, through the inspection of funnel plots, together with Egger’s test [45].”
MethodLiberati, A., Altman, D. G., Tetzlaff, J., Mulrow, C., Gøtzsche, P. C., Ioannidis, J. P. A., Clarke, M., Devereaux, P. J., Kleijnen, J., & Moher, D. (2009) · PLoS Medicine · doi:10.1371/journal.pmed.1000100 · Cited by 28,164 · cited 1×
“The bibliographic search was conducted according to the protocol guidelines of the Preferred Reporting Items for Systematic Reviews and Meta-Analyses (PRISMA) [31].”
MethodBorenstein, M., Hedges, L. V., Higgins, J. P. T., & Rothstein, H. R. (2009) · doi:10.1002/9780470743386 · Cited by 14,225
Duval, S., & Tweedie, R. (2000) · Biometrics · doi:10.1111/j.0006-341x.2000.00455.x · Cited by 14,099 · cited 1×
“In the cases were previous appraisals had detected publication bias, it was corrected employing the trim-and-fill method (TaF) [46].”
MethodStatistical Methods for Meta-Analysis
Wasserman, S., Hedges, L. V., & Olkin, I. (1988) · Journal of Educational Statistics · doi:10.2307/1164953 · Cited by 10,326
Borenstein, M., Hedges, L. V., Higgins, J. P. T., & Rothstein, H. R. (2021) · doi:10.1002/9781119558378 · Cited by 9,799
Mindfulness-based interventions in context: Past, present, and future
Kabat-Zinn, J. (2003) · Clinical Psychology: Science and Practice · doi:10.1093/clipsy.bpg016 · Cited by 8,615 · cited 1×
“However, all MBIs have, as a common point, the systematic training in meditation practices for the development of mindfulness, which is at the heart of the intervention [8].”
BackgroundMindfulness-based interventions in context: Past, present, and future.
Kabat-Zinn, J. (2003) · Clinical Psychology: Science and Practice · doi:10.1093/clipsy/bpg016 · Cited by 8,612
A basic introduction to fixed-effect and random-effects models for meta-analysis
Borenstein, M., Hedges, L. V., Higgins, J. P. T., & Rothstein, H. R. (2010) · Research Synthesis Methods · doi:10.1002/jrsm.12 · Cited by 6,793 · cited 1×
“When a study yielded several measurements for the same psychological construct, only one effect size was calculated applying aggregation method [37], using the MAd package [38] for R (R Foundation for Statistical Computing, Vienna, Austria) [39].”
Method(1999) · Cited by 5,934
Kabat-Zinn, J. (1982) · General Hospital Psychiatry · doi:10.1016/0163-8343(82)90026-3 · Cited by 4,255 · cited 7×
“In the studies by Chien and colleagues [55–57], Lee [58], Wang et al. [59], and Yilmaz and Kavak [50], MBIs were based on the MBSR program and included psychoeducational contents for people with schizophrenia.”
BackgroundInfluentialLiberati, A., Altman, D. G., Tetzlaff, J., Mulrow, C., Gøtzsche, P. C., Ioannidis, J. P. A., Clarke, M., Devereaux, P. J., Kleijnen, J., & Moher, D. (2009) · Italian Journal of Public Health · doi:10.2427/5768 · Cited by 3,374
Morris, S. B., & DeShon, R. P. (2002) · Psychological Methods · doi:10.1037/1082-989x.7.1.105 · Cited by 2,502 · cited 2×
“The estimation of treatment effects on the dependent variables, for each study, was based on the calculation of the standardized mean change using raw score standardization (SMCR; see Appendix A), taking the standard deviations of the pretest [33,34].”
MethodMethods to estimate the between‐study variance and its uncertainty in meta‐analysis
Veroniki, A. A., Jackson, D., Viechtbauer, W., Bender, R., Bowden, J., Knapp, G., Kuss, O., Higgins, J. P., Langan, D., & Salanti, G. (2016) · Research Synthesis Methods · doi:10.1002/jrsm.1164 · Cited by 1,685 · cited 3×
“Due to the expected heterogeneity, a random-effects model was estimated employing a restricted maximum likelihood method (REML) [40].”
MethodMindfulness-based interventions for psychiatric disorders: A systematic review and meta-analysis
Goldberg, S. B., Tucker, R. P., Greene, P. A., Davidson, R. J., Wampold, B. E., Kearney, D. J., & Simpson, T. L. (2018) · Clinical Psychology Review · doi:10.1016/j.cpr.2017.10.011 · Cited by 1,145 · cited 1×
“The popularity of MBIs has increased exponentially over the last 30 years, alongside the volume of research conducted on their effectiveness in the treatment of different psychological conditions [13].”
BackgroundSynthesizing standardized mean‐change measures
Becker, B. J. (1988) · British Journal of Mathematical and Statistical Psychology · doi:10.1111/j.2044-8317.1988.tb00901.x · Cited by 889 · cited 1×
“The estimation of treatment effects on the dependent variables, for each study, was based on the calculation of the standardized mean change using raw score standardization (SMCR; see Appendix A), taking the standard deviations of the pretest [33,34].”
MethodWhat defines mindfulness-based programs? The warp and the weft
Crane, R. S., Brewer, J., Feldman, C., Kabat-Zinn, J., Santorelli, S., Williams, J. M. G., & Kuyken, W. (2017) · Psychological Medicine · doi:10.1017/s0033291716003317 · Cited by 868 · cited 1×
“Other distinctive aspects of MBIs have to do with the way they are administered: usually in group format and through one or more teachers who are not necessarily therapists or mental health professionals [9].”
BackgroundBach, P., & Hayes, S. C. (2002) · Journal of Consulting and Clinical Psychology · doi:10.1037/0022-006x.70.5.1129 · Cited by 839 · cited 1×
“Despite this, some studies published in the early 2000s found that the application of therapies which included mindfulness practice resulted in improvements in patients with schizophrenia [17].”
ResultJauhar, S., McKenna, P. J., Radua, J., Fung, E., Salvador, R., & Laws, K. R. (2014) · British Journal of Psychiatry · doi:10.1192/bjp.bp.112.116285 · Cited by 517 · cited 1×
“The effects obtained from MBIs in this review were comparable to those obtained in meta-analytic studies regarding the effectiveness of CBT in the reduction of positive and negative symptoms [23,66,67].”
ResultPsychological interventions for psychosis: A meta-analysis of comparative outcome studies
Turner, D. T., van der Gaag, M., Karyotaki, E., & Cuijpers, P. (2014) · American Journal of Psychiatry · doi:10.1176/appi.ajp.2013.13081159 · Cited by 350
Mindfulness interventions for psychosis: A meta-analysis
Khoury, B., Lecomte, T., Gaudiano, B. A., & Paquin, K. (2013) · Schizophrenia Research · doi:10.1016/j.schres.2013.07.055 · Cited by 292 · cited 1×
“Regarding the characteristic symptoms of schizophrenia, only one found moderate effects on positive symptoms [28] and two found modest effects on negative symptoms [27,30].”
BackgroundPerson‐Based Cognitive Therapy for Distressing Psychosis
Chadwick, P. (2006) · Wiley eBooks · doi:10.1002/9780470713075 · Cited by 253
The Wiley Blackwell Handbook of Mindfulness
(2014) · doi:10.1002/9781118294895 · Cited by 221
Chadwick, P., Hughes, S., Russell, D., Russell, I., & Dagnan, D. (2009) · Behavioural and Cognitive Psychotherapy · doi:10.1017/s1352465809990166 · Cited by 219 · cited 1×
“The MBIs in the studies by Chadwick and colleagues [48,60] and Langer et al.”
ResultWhat Are the Components of CBT for Psychosis? A Delphi Study
Morrison, A. P., & Barratt, S. (2010) · Schizophrenia Bulletin · doi:10.1093/schbul/sbp118 · Cited by 212 · cited 1×
“Nevertheless, the effectiveness of MBIs in the reduction of psychotic symptoms is noteworthy, given that the objective of these interventions is not to modify this type of symptoms—an aspect on which CBT does tend to focus [68,69]—but rather to manage the psychological discomfort they may cause by modifying the relati…”
BackgroundCognitive-behavioral therapy for medication-resistant psychosis: A meta-analytic review
Burns, A. M. N., Erickson, D. H., & Brenner, C. A. (2014) · Psychiatric Services · doi:10.1176/appi.ps.201300213 · Cited by 199
deVibe, M., Bjørndal, A., Fattah, S., Dyrdal, G. M., Halland, E., & Tanner-Smith, E. E. (2017) · Campbell Systematic Reviews: Better Evidence for a Better World · doi:10.4073/csr.2017.11 · Cited by 198 · cited 1×
“Both are widely used and have remarkable empirical support [6,7].”
Unwanted effects: is there a negative side of meditation? A multicentre survey
Cebolla, A., Demarzo, M., Martins, P., Soler, J., & Garcia-Campayo, J. (2017) · PLOS ONE · doi:10.1371/journal.pone.0183137 · Cited by 192 · cited 1×
“A recent study has, in fact, found that these three factors—structured protocol, group, and short-duration practice—were associated with a lower occurrence of the unwanted side effects linked to mindfulness practice in the general population [65].”
BackgroundLutgens, D., Gariepy, G., & Malla, A. (2017) · British Journal of Psychiatry · doi:10.1192/bjp.bp.116.197103 · Cited by 181 · cited 1×
“The effects obtained from MBIs in this review were comparable to those obtained in meta-analytic studies regarding the effectiveness of CBT in the reduction of positive and negative symptoms [23,66,67].”
ResultConducting a meta-analysis: Basics and good practices
Cheung, M. W. ‐., Ho, R. C. M., Lim, Y., & Mak, A. (2012) · International Journal of Rheumatic Diseases · doi:10.1111/j.1756-185x.2012.01712.x · Cited by 172 · cited 1×
“The calculation of heterogeneity was based on Cochran’s Q test, supplemented with the I2 index and was considered null with values of 0%, mild with values of 25%, moderate with values of 50%, and high with values of 75% [42].”
MethodGoldberg, S. B., Tucker, R. P., Greene, P. A., Davidson, R. J., Kearney, D. J., & Simpson, T. L. (2019) · Cognitive Behaviour Therapy · doi:10.1080/16506073.2018.1556330 · Cited by 171 · cited 1×
“Both are widely used and have remarkable empirical support [6,7].”
BackgroundKuijpers, H. J. H., van der Heijden, F. M. M. A., Tuinier, S., & Verhoeven, W. M. A. (2007) · Psychopathology · doi:10.1159/000108125 · Cited by 164
(2009) · PubMed · Cited by 160
Louise, S., Fitzpatrick, M., Strauss, C., Rossell, S. L., & Thomas, N. (2018) · Schizophrenia Research · doi:10.1016/j.schres.2017.05.023 · Cited by 160 · cited 3×
“[29], with 10 studies; and Jansen et al.”
BackgroundResponding mindfully to distressing psychosis: A grounded theory analysis
Abba, N., Chadwick, P., & Stevenson, C. (2008) · Psychotherapy Research · doi:10.1080/10503300701367992 · Cited by 159 · cited 1×
“, control efforts and escape-avoidance coping—to adopt a response style fundamentally based on acceptance, which, although counterintuitive, may result in a reduction of the generated distress [25,26].”
BackgroundRehabilitation Interventions to Promote Recovery from Schizophrenia: A Systematic Review
Morin, L., & Franck, N. (2017) · Frontiers in Psychiatry · doi:10.3389/fpsyt.2017.00100 · Cited by 155
Jansen, J. E., Gleeson, J., Bendall, S., Rice, S., & Alvarez-Jimenez, M. (2020) · Schizophrenia Research · doi:10.1016/j.schres.2019.11.016 · Cited by 144 · cited 5×
“[30], treatments produced small to moderate effects on overall symptomatology, which is in line with our findings; Khoury et al.”
BackgroundResultInfluential(1979) · American Journal of Psychiatry · doi:10.1176/ajp.136.8.1085 · Cited by 137
A systematic review and meta-analysis of low intensity CBT for psychosis
Hazell, C. M., Hayward, M., Cavanagh, K., & Strauss, C. (2016) · Clinical Psychology Review · doi:10.1016/j.cpr.2016.03.004 · Cited by 120 · cited 2×
“In both senses, MBIs tend to be highly efficient because they are applied to groups, unlike CBT which tends to be applied to individual patients [23] as recommended by relevant clinical practice guidelines for the psychosocial treatment of schizophrenia [71,72].”
BackgroundResultGroup mindfulness-based intervention for distressing voices: A pragmatic randomised controlled trial
Chadwick, P., Strauss, C., Jones, A.-M., Kingdon, D., Ellett, L., Dannahy, L., & Hayward, M. (2016) · Schizophrenia Research · doi:10.1016/j.schres.2016.04.001 · Cited by 116 · cited 1×
“The MBIs in the studies by Chadwick and colleagues [48,60] and Langer et al.”
ResultChien, W. T., & Thompson, D. R. (2014) · British Journal of Psychiatry · doi:10.1192/bjp.bp.113.134635 · Cited by 115
Mindfulness-and acceptance-based interventions for psychosis: A systematic review and meta-analysis
Cramer, H., Lauche, R., Haller, H., Langhorst, J., & Dobos, G. (2016) · Global Advances in Health and Medicine · doi:10.7453/gahmj.2015.083 · Cited by 96 · cited 2×
“Thus, only one reported large effects on overall symptomology [30], and two reported small effects [28,29].”
BackgroundApplying Mindfulness Therapy in a Group of Psychotic Individuals: A Controlled Study
Langer, Á. I., Cangas, A. J., Salcedo, E., & Fuentes, B. (2012) · Behavioural and Cognitive Psychotherapy · doi:10.1017/s1352465811000464 · Cited by 86 · cited 1×
“[49] were based on the MBSR program and included elements of PBCT [18].”
MethodNaeem, F., Khoury, B., Munshi, T., Ayub, M., Lecomte, T., Kingdon, D., & Farooq, S. (2016) · International Journal of Cognitive Therapy · doi:10.1521/ijct_2016_09_04 · Cited by 80 · cited 1×
“CBT is one of the most widespread and empirically supported treatments for schizophrenia [19] used to specifically address psychotic symptoms, such as hallucinations and delusions, and which aims to modify patient held beliefs [20] (pp.”
BackgroundPalmer, E. C., Gilleen, J., & David, A. S. (2015) · Schizophrenia Research · doi:10.1016/j.schres.2015.05.032 · Cited by 66 · cited 1×
“Despite this, we consider that this result is noteworthy from a clinical point of view since improvements in the levels of psychosocial functioning and awareness of illness are highly relevant objectives in the treatment and recovery of people with schizophrenia [62,63].”
Background(1981) · The Journal of transpersonal psychology · Cited by 61
Chien, W. T., Bressington, D., Yip, A., & Karatzias, T. (2017) · Psychological Medicine · doi:10.1017/s0033291717000526 · Cited by 57
CBT for schizophrenia: a critical viewpoint
Jauhar, S., Laws, K. R., & McKenna, P. J. (2019) · Psychological Medicine · doi:10.1017/s0033291718004166 · Cited by 52 · cited 1×
“Although there is a certain amount of controversy regarding its effectiveness in the treatment of schizophrenia [21], on the whole, research yields positive results, especially in the decrease of positive symptoms [22–24].”
ResultChien, W. T., Cheng, H. Y., McMaster, T. W., Yip, A. L. K., & Wong, J. C. L. (2019) · Schizophrenia Research · doi:10.1016/j.schres.2019.07.053 · Cited by 48
Mindfulness groups for early psychosis: A qualitative study
Ashcroft, K., Barrow, F., Lee, R., & MacKinnon, K. (2012) · Psychology and Psychotherapy Theory Research and Practice · doi:10.1111/j.2044-8341.2011.02031.x · Cited by 45 · cited 1×
“, control efforts and escape-avoidance coping—to adopt a response style fundamentally based on acceptance, which, although counterintuitive, may result in a reduction of the generated distress [25,26].”
BackgroundEffect of mindfulness on vocational rehabilitation outcomes in stable phase schizophrenia
Davis, L. W., Lysaker, P. H., Kristeller, J. L., Salyers, M. P., Kovach, A. C., & Woller, S. (2015) · Psychological Services · doi:10.1037/ser0000028 · Cited by 43
A randomized controlled trial of mindfulness in patients with schizophrenia✰
Lee, K.-H. (2019) · Psychiatry Research · doi:10.1016/j.psychres.2019.02.079 · Cited by 38
Meta-análisis en ciencias sociales y de la salud
Ausina, J. B., & Sánchez‐Meca, J. (2015) · Dialnet (Universidad de la Rioja) · Cited by 36
Wang, X., Petrini, M. A., & Morisky, D. E. (2015) · Archives of Psychiatric Nursing · doi:10.1016/j.apnu.2015.10.006 · Cited by 32 · cited 1×
“[59], and Yilmaz and Kavak [50], MBIs were based on the MBSR program and included psychoeducational contents for people with schizophrenia.”
MethodYılmaz, E., & Kavak, F. (2020) · Clinical Nursing Research · doi:10.1177/1054773818797871 · Cited by 31 · cited 2×
“In the studies by Chien and colleagues [55–57], Lee [58], Wang et al. [59], and Yilmaz and Kavak [50], MBIs were based on the MBSR program and included psychoeducational contents for people with schizophrenia.”
MethodPsychotherapies for Schizophrenia: A Review
Birchwood, M., & Spencer, E. (2002) · Schizophrenia · doi:10.1002/0470861649.ch3 · Cited by 20 · cited 1×
“Nevertheless, the effectiveness of MBIs in the reduction of psychotic symptoms is noteworthy, given that the objective of these interventions is not to modify this type of symptoms—an aspect on which CBT does tend to focus [68,69]—but rather to manage the psychological discomfort they may cause by modifying the relati…”
BackgroundPsychotherapies for Schizophrenia: A Review
Birchwood, M. J., & Spencer, E. A. (1999) · Wiley eBooks · doi:10.1002/0470842334.ch3 · Cited by 13
Hodann-Caudevilla, R. M., & Serrano-Pintado, I. (2016) · Ansiedad y Estrés · doi:10.1016/j.anyes.2016.04.001 · Cited by 5 · cited 1×
“Now, considering these results, in which both therapeutic approaches—MBIs and CBT—are similar in terms of efficacy and safety, the choice between one or the other could be based—as suggested in a previous review [70]—on factors concerning their effectiveness in terms of cost and time.”
BackgroundSelf-citation
Research works printed but not linked: 5
- Hanh T.N. Kornfield J. Being Peace 2nd ed. Parallax Press Berkeley, CA, USA 2005 978-1-888375-40-4
- Segal Z.V. Mark G.W. John D.T. Mindfulness-Based Cognitive Therapy for Depression: A New Approach to Preventing Relapse 2nd ed. Guilford Press New York, NY, USA 2012 978-1-4625-0750-4
- Linehan M. Cognitive-Behavioral Treatment of Borderline Personality Disorder 1st ed. The Guilford Press New York, NY, USA 1993 978-0-89862-183-9
- Cohen J. Statistical Power Analysis for the Behavioral Sciences 2nd ed. Routledge Hillsdale, NJ, USA 1988 978-0-8058-0283-2
- Schwarzer G. Meta: An R package for meta-analysis R News 2007 7 40 45
Cited by
Evidence-based psychosocial interventions in schizophrenia: a critical review
Barlati, S., Nibbio, G., & Vita, A. (2024) · Current Opinion in Psychiatry · doi:10.1097/yco.0000000000000925 · Cited by 115
Yao, B., & Thakkar, K. (2022) · Neuroscience & Biobehavioral Reviews · doi:10.1016/j.neubiorev.2021.11.016 · Cited by 69
“Under the influence of the strong prior that “something is in the air,” noisy exteroceptive signals may be unduly influenced by this prior, resulting in an expectancy that engenders hallucinations (Corlett et al., 2019; Hoffman, 2010; Leptourgos and Corlett, 2020).”
BackgroundCella, M., Roberts, S., Pillny, M., Riehle, M., O'Donoghue, B. N., Lyne, J., Tomlin, P., Valmaggia, L., & Preti, A. (2023) · The British Journal of Psychiatry · doi:10.1192/bjp.2023.21 · Cited by 86
“Four of these found significant small-to-moderate effects for reducing negative symptoms when comparing mindfulness-based therapies with TAU with 39,65 and without an active control condition.”
Leucht, S., Siafis, S., McGrath, J. J., McGorry, P. D., Howes, O. D., Tamminga, C. A., Carr, R., Bighelli, I., Schneider‐Thoma, J., Priller, J., et al. (2025) · Nature Reviews Disease Primers · doi:10.1038/s41572-025-00667-6 · Cited by 82
“Mindfulness has also shown encouraging results for multiple outcomes 228 .”
Aberrant Interoceptive Accuracy in Patients With Schizophrenia Performing a Heartbeat Counting Task
Koreki, A., Funayama, M., Terasawa, Y., Onaya, M., & Mimura, M. (2020) · Schizophrenia Bulletin Open · doi:10.1093/schizbullopen/sgaa067 · Cited by 56
“73,74”
Metadata
- Authors
- Hodann-Caudevilla, R. M., Díaz-Silveira, C., Burgos-Julián, F. A., & Santed, M. A.
- Affiliations
- San Juan de Dios Hospital, 28350 Ciempozuelos, Spain
- Psychology Department, Rey Juan Carlos University, 28922 Madrid, Spain
- Universidad Rey Juan Carlos (ES)
- Personality, Psychological Assessment and Treatment Department, Faculty of Psychology, Universidad Nacional de Educación a Distancia (UNED), 28040 Madrid, Spain
- Corresponding author
- Hodann-Caudevilla, Ricardo M.
- Venue
- International Journal of Environmental Research and Public Health
- Publisher
- MDPI AG
- Published
- 2020-06-30
- Volume
- 17
- Issue
- 13
- Pages
- 4690
- ISSN
- 1660-4601 (ISSN-L)
- PMC
- PMC7369977
- OpenAlex
- W3037642386
- Cited by
- 60
- References
- 60
- Citations by year
- 2026: 5 · 2025: 14 · 2024: 9 · 2023: 8 · 2022: 10 · 2021: 9 · 2020: 5
- FWCI
- 0.63
- Type
- journal article
- Language
- en
- Open access
- gold
- dx.doi.org
- Licence
- Locations
- International Journal of Environmental Research and Public Health (publishedVersion, cc-by)
- PubMed Central (publishedVersion, cc-by)
- PubMed (publishedVersion)
- RePEc: Research Papers in Economics (submittedVersion)
- BURJC Digital (King Juan Carlos University) (submittedVersion, cc-by)
- DOAJ (DOAJ: Directory of Open Access Journals) (submittedVersion, cc-by-sa)
- Hispana (submittedVersion, cc-by)
- Topics
- Social Sciences › Psychology › Clinical Psychology › Mindfulness and Compassion Interventions
- Health Sciences › Medicine › Psychiatry and Mental health › Schizophrenia research and treatment
- Social Sciences › Psychology › Clinical Psychology › Psychotherapy Techniques and Applications
- Keywords
- mindfulness-based interventions, schizophrenia, symptom severity, positive symptoms, negative symptoms, functioning, disease awareness, cognitive behavioural therapy for psychosis, treatment effectiveness
- MeSH terms
- Humans, Psychotic Disorders, Schizophrenia, Cognitive Behavioral Therapy, Mindfulness
About these checks
Registry, retraction, Cites and statistics results are computed, not judged, with one exception: a printed reference that no index lists is read once by a model before it counts as a citation error. Claims are extracted by a model and kept only when their quote appears verbatim in the text; each cited source is then checked, with a model’s help, for whether it says what the claim relies on. Those verdicts can be wrong — read the claim’s quote and the cited source before relying on one.
The claim verdicts this report counts are experimental: their accuracy is not yet measured.
A language model drew the claims from the paper on 2026-10-07, under version 3 of the claim definition (model deepseek-v4.1-flash, prompt extract-v3).
A second model labelled each claim on 2026-10-07 (model jev-1.13-20260917, definition revision gold-guideline-v0.2).
Cited sources are checked with a language model’s help (qwen3.8-omni-flash and gpt-6-sol).
Statistics and arithmetic are recomputed, not judged.
Confidence bands are shown only for fields calibrated on our annotated test set. None is calibrated yet, so no band is shown.
What counts as a claim ›How we measure confidence ›How we check this ›
Are you an author, or do you see a problem with this page? Request a review
Data sources
Bibliographic data: Semantic Scholar, OpenAlex, Crossref.
Contains information from the Semantic Scholar Academic Graph Datasets, made available under the ODC Attribution License (ODC-BY 1.0).
Semantic Scholar’s data is described in: Kinney, R., et al. (2023). The Semantic Scholar Open Data Platform. arXiv:2301.10140.
