

The DOI matches its Crossref record; 113 of the 113 references it cites were found in a registry or an index.
Investigating the Psychological Impact of COVID-19 among Healthcare Workers: A Meta-Analysis
Open accessAbstract
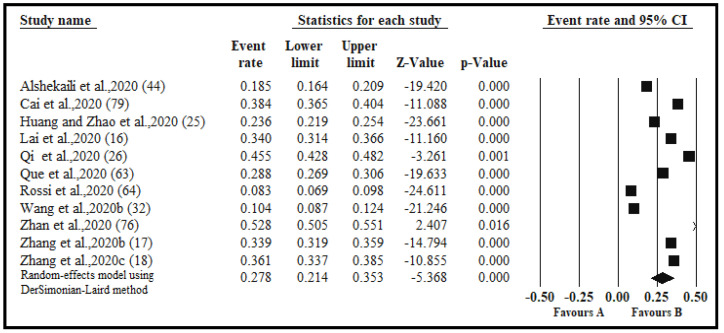
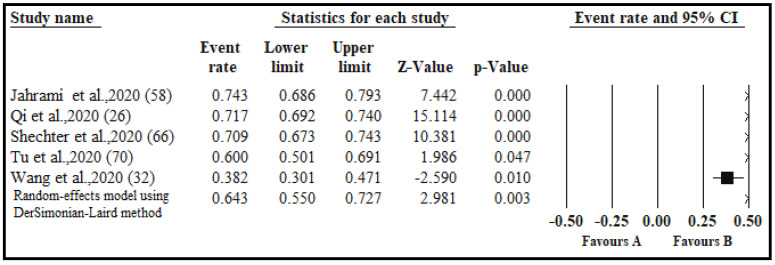
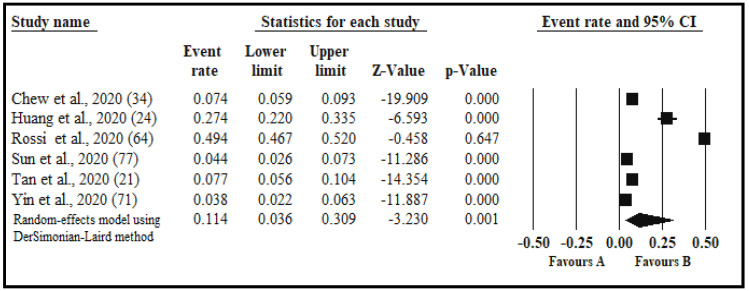
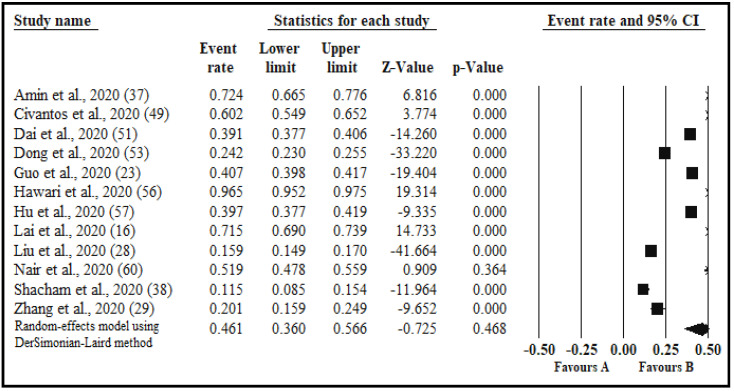
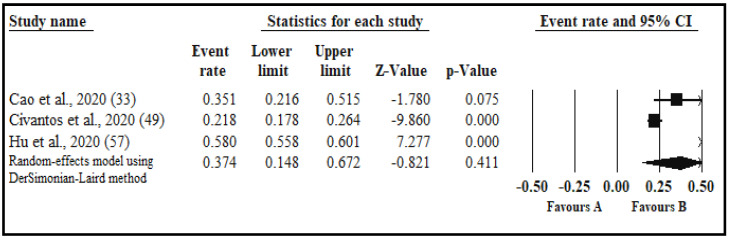
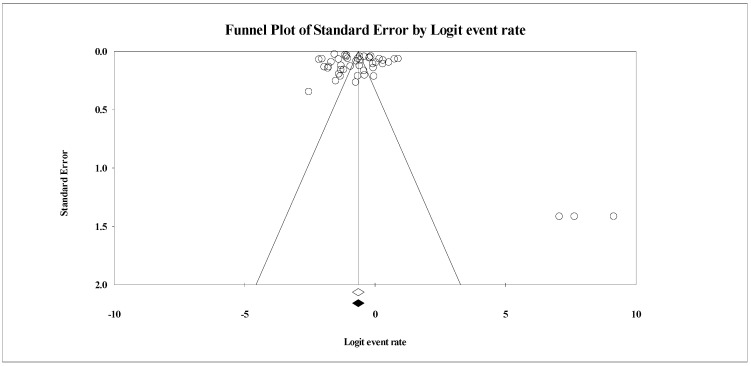
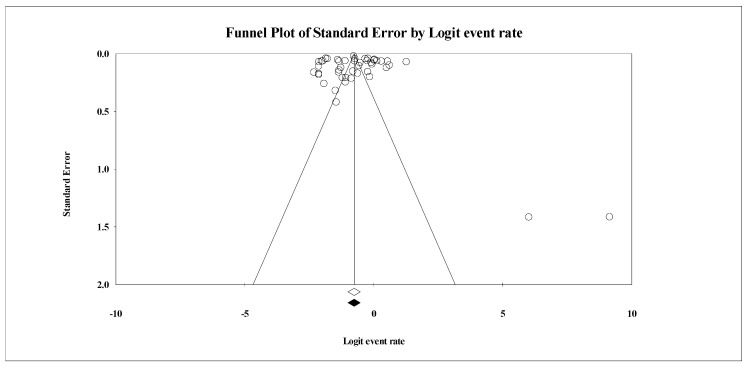
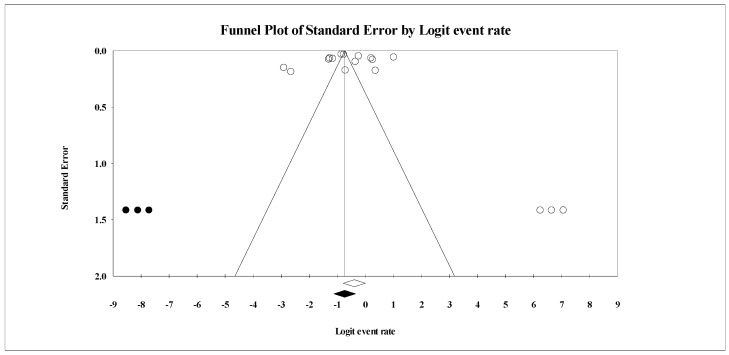
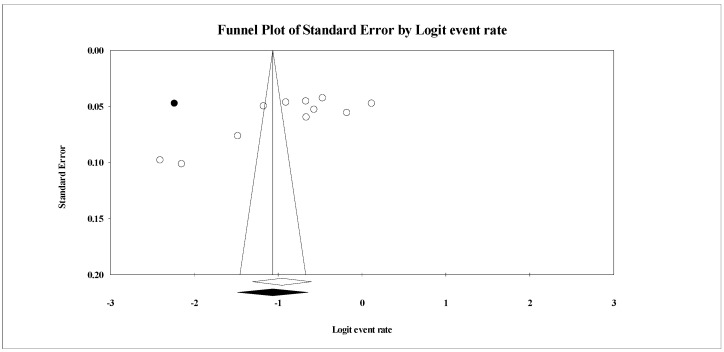
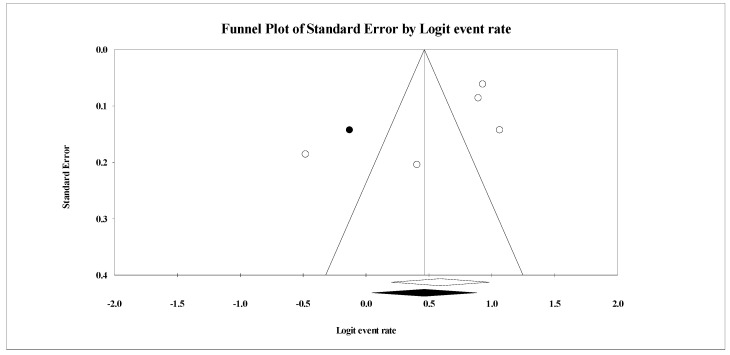
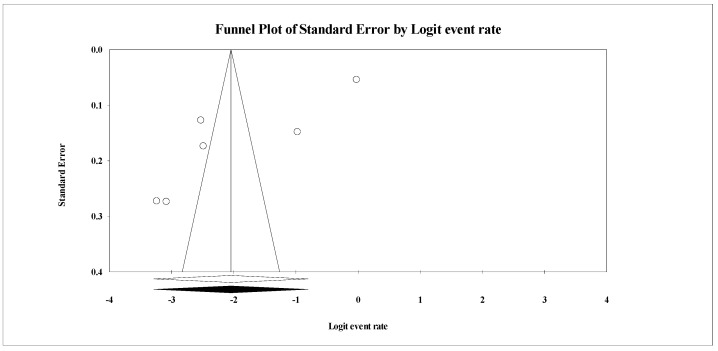
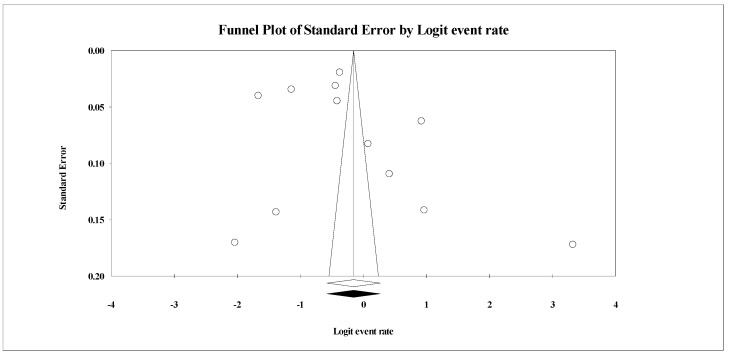
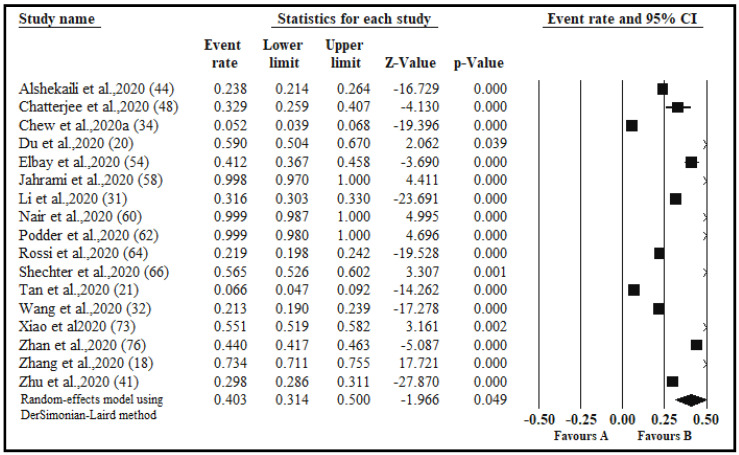
Previous meta-analyses were conducted during the initial phases of the COVID-19 pandemic, which utilized a smaller pool of data. The current meta-analysis aims to provide additional (and updated) evidence related to the psychological impact among healthcare workers. The search strategy was developed by a medical librarian and bibliographical databases, including Medline, Embase, CINAHL, PsycINFO, and Scopus were searched for studies examining the impact of the COVID-19 pandemic on the psychological health of healthcare workers. Articles were screened by three reviewers. Heterogeneity among studies was assessed by I2 statistic. The random-effects model was utilized to obtain the pooled prevalence. A subgroup analysis by region, gender, quality of study, assessment methods, healthcare profession, and exposure was performed. Publication bias was assessed by Funnel plot and Egger linear regression test. Sixty-five studies met the inclusion criteria and the total sample constituted 79,437 participants. The pooled prevalence of anxiety, depression, stress, post-traumatic stress syndrome, insomnia, psychological distress, and burnout was 34.4%, 31.8%, 40.3%, 11.4%, 27.8%, 46.1%, and 37.4% respectively. The subgroup analysis indicated higher anxiety and depression prevalence among females, nurses, and frontline responders than males, doctors, and second-line healthcare workers. This study highlights the need for designing a targeted intervention to improve resilience and foster post-traumatic growth among frontline responders.
Overview
The claims and statistics of this paper haven’t been checked yet.
Run the check — free, no account needed. It reads the open-access text and checks the sources it cites.
Integrity signals
Registry
Cites
Statistics
Figures
Verification
Claims the paper makes
The claims and statistics of this paper haven’t been checked yet.
Run the check — free, no account needed. It reads the open-access text and checks the sources it cites.
Claims other papers make about this one
Each is checked against this paper’s own text: does it say what the citing paper says it does?
The source backs part of the claim, not all of it — or backs it for a different population, condition or comparison.
In the citing paper
“A systematic review showed that the pooled prevalence rate of psychological distress among nurses during the COVID-19 outbreak was 46.1% (7).”
From Translation, adaptation, and initial evaluation of a guided self-help intervention to reduce psychological distress among nurses during COVID-19 in China (2023) · cites this paper as [7]
Experimental — accuracy not yet measured
Self-check
Percentages, sums and reported differences re-computed from the paper’s own numbers.
The self-check needs the paper’s full text.
Citations
Cites
Bias in meta-analysis detected by a simple, graphical test
Egger, M., Smith, G. D., Schneider, M., & Minder, C. (1997) · BMJ · doi:10.1136/bmj.315.7109.629 · Cited by 56,722 · cited 1×
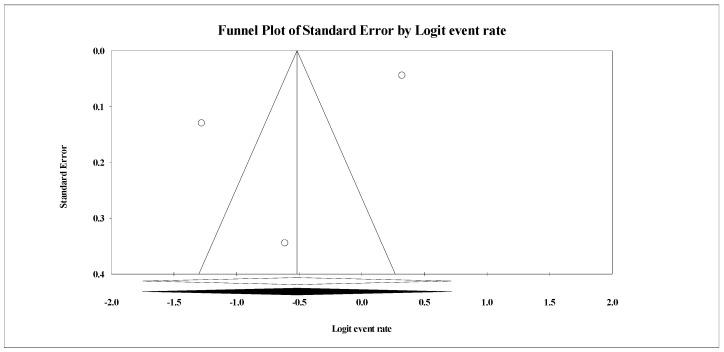
“Funnel plot and Egger linear regression test was used to assess publication bias [85].”
MethodClinical features of patients infected with 2019 novel coronavirus in Wuhan, China
Huang, C., Wang, Y., Li, X., Ren, L., Zhao, J., Hu, Y., Zhang, L., Fan, G., Xu, J., Gu, X., et al. (2020) · The Lancet · doi:10.1016/s0140-6736(20)30183-5 · Cited by 48,884
Meta-analysis in clinical trials
DerSimonian, R., & Laird, N. (1986) · Controlled Clinical Trials · doi:10.1016/0197-2456(86)90046-2 · Cited by 39,552 · cited 1×
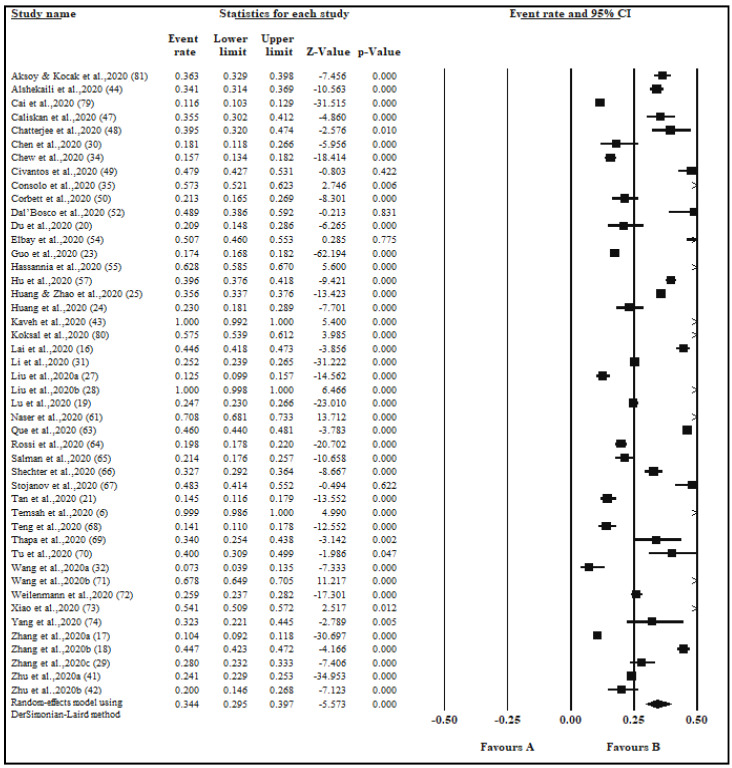
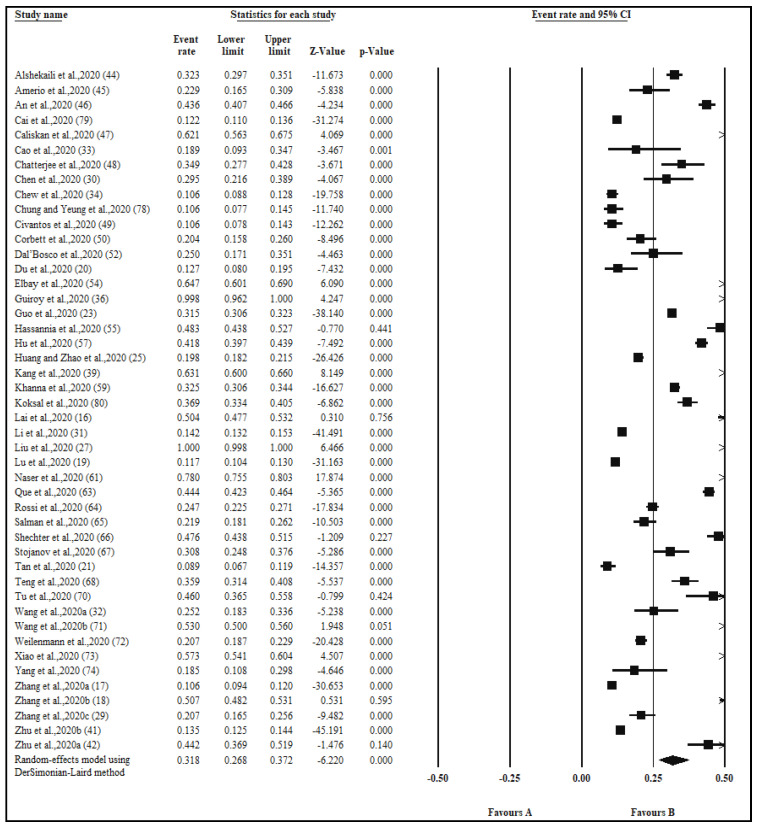
“Due to methodologic variations and sample diversity across studies, the random-effects model was used to extract the pooled estimate [83].”
MethodLiberati, A., Altman, D. G., Tetzlaff, J., Mulrow, C., Gøtzsche, P. C., Ioannidis, J. P. A., Clarke, M., Devereaux, P. J., Kleijnen, J., & Moher, D. (2009) · PLoS Medicine · doi:10.1371/journal.pmed.1000100 · Cited by 28,164
Cochrane Handbook for Systematic Reviews of Interventions: Cochrane Book Series
(2008) · doi:10.1002/9780470712184 · Cited by 25,048
Liberati, A., Altman, D. G., Tetzlaff, J., Mulrow, C., Gotzsche, P. C., Ioannidis, J. P. A., Clarke, M., Devereaux, P. J., Kleijnen, J., & Moher, D. (2009) · BMJ · doi:10.1136/bmj.b2700 · Cited by 17,648
Lai, J., Ma, S., Wang, Y., Cai, Z., Hu, J., Wei, N., Wu, J., Du, H., Chen, T., Li, R., et al. (2020) · JAMA Network Open · doi:10.1001/jamanetworkopen.2020.3976 · Cited by 8,015
Presumed Asymptomatic Carrier Transmission of COVID-19
Bai, Y., Yao, L., Wei, T., Tian, F., Jin, D., Chen, L., & Wang, M. (2020) · JAMA · doi:10.1001/jama.2020.2565 · Cited by 4,496
Qiu, J., Shen, B., Zhao, M., Wang, Z., Xie, B., & Xu, Y. (2020) · General Psychiatry · doi:10.1136/gpsych-2020-100213 · Cited by 4,307
COVID-19 infection: Emergence, transmission, and characteristics of human coronaviruses
Shereen, M. A., Khan, S., Kazmi, A., Bashir, N., & Siddique, R. (2020) · Journal of Advanced Research · doi:10.1016/j.jare.2020.03.005 · Cited by 3,743
Research works printed but not linked: 2
- Nair, A.K.R., Chellaswamy, K.S., Kattula, D., Thavarajah, R., and Mohandoss, A.A. (2020). Perceived stress and psychological distress among indian endodontists during COVID-19 pandemic lockdown. MedRxiv.
- Higgins, J.P., and Green, S. (2011). Cochrane Handbook for Systematic Reviews of Interventions, John Wiley & Sons.
Cited by
Sorted by citations
Alnazly, E. K., Khraisat, O. M. A., Al-Bashaireh, A. M., & Bryant, C. L. (2021) · PLoS ONE · doi:10.1371/journal.pone.0247679 · Cited by 452
“[22] conducted a meta-analysis to provide new evidence related to COVID-19 impact on health-care workers’ psychological well-being.”
MethodSaragih, I. D., Tonapa, S. I., Saragih, I. S., Advani, S., Batubara, S. O., Suarilah, I., & Lin, C. (2021) · International Journal of Nursing Studies · doi:10.1016/j.ijnurstu.2021.104002 · Cited by 427
A Systematic Review and Meta-Analysis of Burnout Among Healthcare Workers During COVID-19
Ghahramani, S., Lankarani, K. B., Yousefi, M., Heydari, K., Shahabi, S., & Azmand, S. (2021) · Frontiers in Psychiatry · doi:10.3389/fpsyt.2021.758849 · Cited by 293
Finstad, G. L., Giorgi, G., Lulli, L. G., Pandolfi, C., Foti, G., León-Perez, J. M., Cantero-Sánchez, F. J., & Mucci, N. (2021) · International Journal of Environmental Research and Public Health · doi:10.3390/ijerph18189453 · Cited by 273
“Indeed, health promotion and prevention strategies are essential to foster successful adaptation to challenging environmental conditions [4,5,83].”
BackgroundInfluentialAssessing the Psychological Impact of COVID-19 among College Students: An Evidence of 15 Countries
Batra, K., Sharma, M., Batra, R., Singh, T. P., & Schvaneveldt, N. (2021) · Healthcare · doi:10.3390/healthcare9020222 · Cited by 212
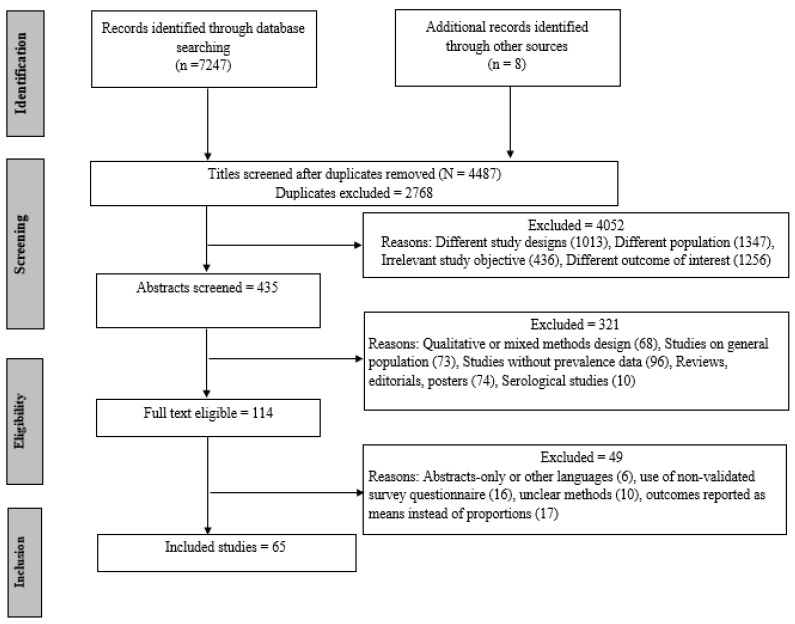
“Sources of Information A search strategy was adapted from previous reports [27].”
MethodInfluential
Metadata
- Authors
- Batra, K., Singh, T. P., Sharma, M., Batra, R., & Schvaneveldt, N.
- Affiliations
- University of Nevada, Las Vegas (US)
- University of Utah (US)
- Department of Information Technology and Testing Center of Excellence, Coforge, Atlanta, GA 30338, USA
- Corresponding author
- Batra, Kavita
- Venue
- International Journal of Environmental Research and Public Health
- Publisher
- MDPI AG
- Published
- 2020-12-05
- Volume
- 17
- Issue
- 23
- Pages
- 9096
- ISSN
- 1660-4601 (ISSN-L)
- PMC
- PMC7730003
- OpenAlex
- W3111432422
- Cited by
- 342
- References
- 107
- Citations by year
- 2026: 9 · 2025: 30 · 2024: 36 · 2023: 86 · 2022: 108 · 2021: 73
- FWCI
- 5.22
- Type
- journal article
- Language
- en
- Open access
- gold
- doi.org
- Licence
- Locations
- International Journal of Environmental Research and Public Health (publishedVersion, cc-by)
- PubMed Central (publishedVersion, cc-by)
- PubMed (publishedVersion)
- Digital Scholarship - UNLV (University of Nevada Reno) (submittedVersion, cc-by)
- DOAJ (DOAJ: Directory of Open Access Journals) (submittedVersion)
- Topics
- Social Sciences › Psychology › Clinical Psychology › COVID-19 and Mental Health
- Health Sciences › Health Professions › General Health Professions › Healthcare professionals’ stress and burnout
- Health Sciences › Medicine › Public Health, Environmental and Occupational Health › Occupational Health and Burnout
- Keywords
- COVID-19 pandemic, healthcare workers, psychological impact, anxiety, depression, stress, post-traumatic stress disorder, insomnia, psychological distress, burnout, nurses, gender differences, prevalence
- MeSH terms
- COVID-19, Anxiety, Depression, Female, Health Personnel, Humans, Male, Stress, Psychological, Pandemics
About these checks
Registry, retraction, Cites and statistics results are computed, not judged, with one exception: a printed reference that no index lists is read once by a model before it counts as a citation error. Claims are extracted by a model and kept only when their quote appears verbatim in the text; each cited source is then checked, with a model’s help, for whether it says what the claim relies on. Those verdicts can be wrong — read the claim’s quote and the cited source before relying on one.
Statistics and arithmetic are recomputed, not judged.
Confidence bands are shown only for fields calibrated on our annotated test set. None is calibrated yet, so no band is shown.
What counts as a claim ›How we measure confidence ›How we check this ›
Are you an author, or do you see a problem with this page? Request a review
