

The DOI matches its Crossref record; 2 of the 2 references it cites were found in a registry or an index.
Reduced Levels of ABCA1 Transporter Are Responsible for the Cholesterol Efflux Impairment in β-Amyloid-Induced Reactive Astrocytes: Potential Rescue from Biomimetic HDLs
Abstract
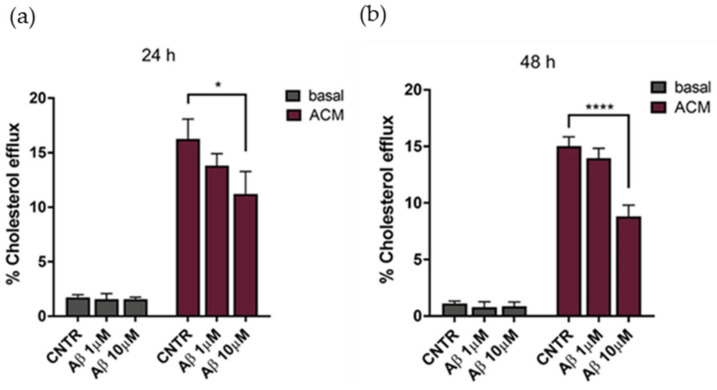
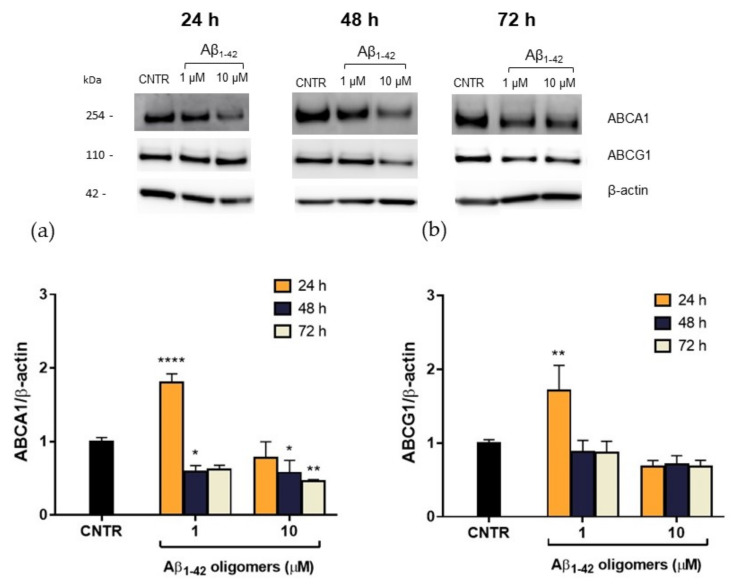
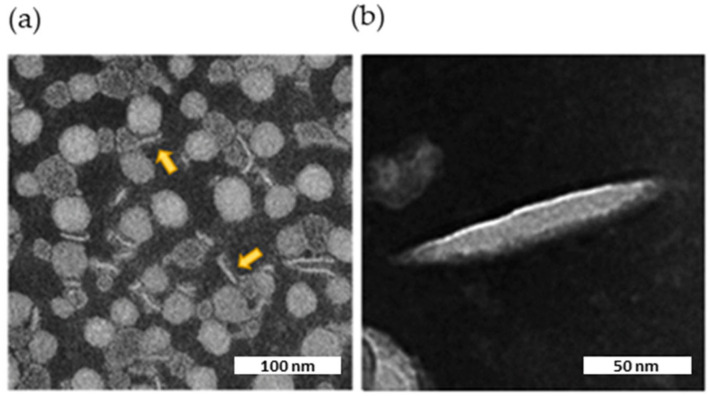
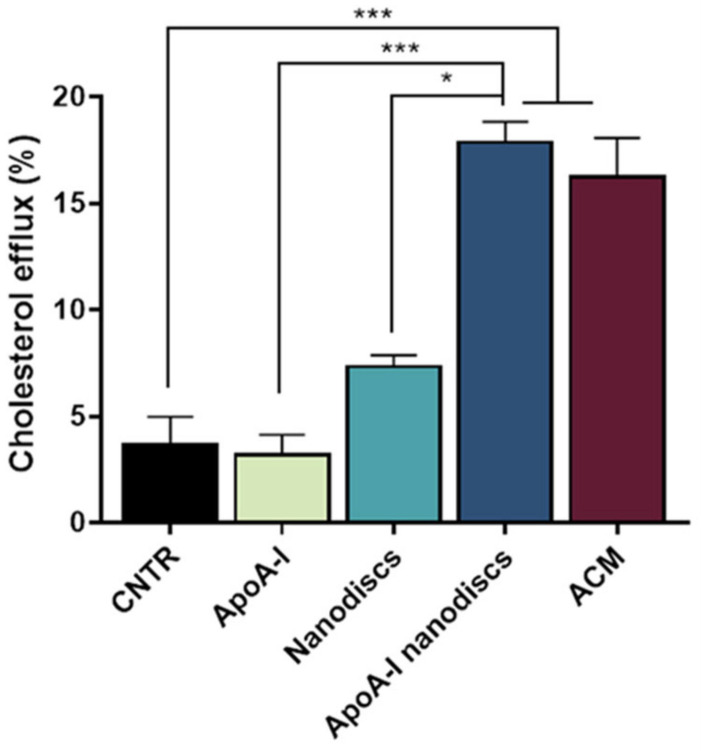
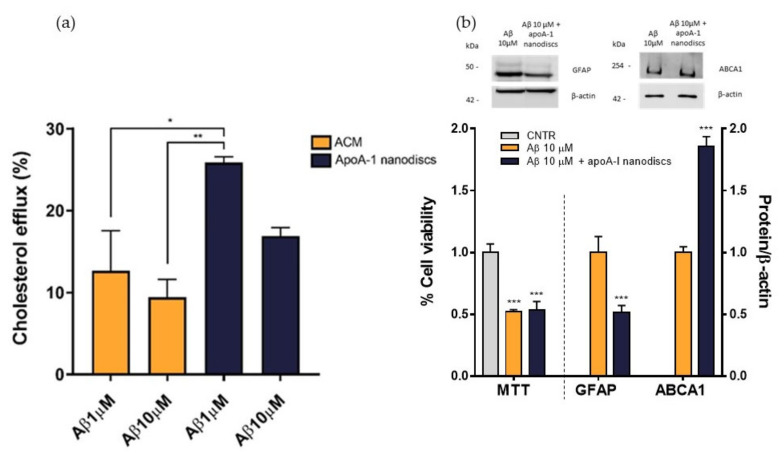
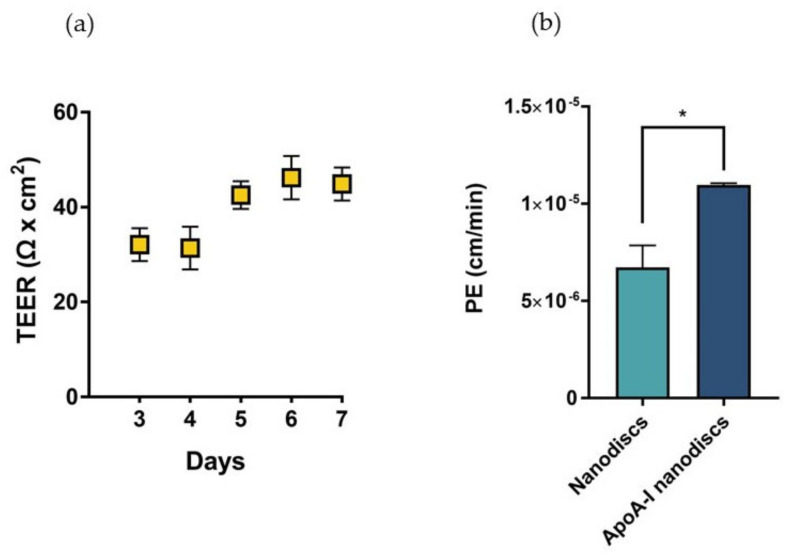
The cerebral synthesis of cholesterol is mainly handled by astrocytes, which are also responsible for apoproteins’ synthesis and lipoproteins’ assembly required for the cholesterol transport in the brain parenchyma. In Alzheimer disease (AD), these processes are impaired, likely because of the astrogliosis, a process characterized by morphological and functional changes in astrocytes. Several ATP-binding cassette transporters expressed by brain cells are involved in the formation of nascent discoidal lipoproteins, but the effect of beta-amyloid (Aβ) assemblies on this process is not fully understood. In this study, we investigated how of Aβ1-42-induced astrogliosis affects the metabolism of cholesterol in vitro. We detected an impairment in the cholesterol efflux of reactive astrocytes attributable to reduced levels of ABCA1 transporters that could explain the decreased lipoproteins’ levels detected in AD patients. To approach this issue, we designed biomimetic HDLs and evaluated their performance as cholesterol acceptors. The results demonstrated the ability of apoA-I nanodiscs to cross the blood–brain barrier in vitro and to promote the cholesterol efflux from astrocytes, making them suitable as a potential supportive treatment for AD to compensate the depletion of cerebral HDLs.
Overview
The claims and statistics of this paper haven’t been checked yet.
Run the check — free, no account needed. It reads the open-access text and checks the sources it cites.
Integrity signals
Registry
Cites
Statistics
Figures
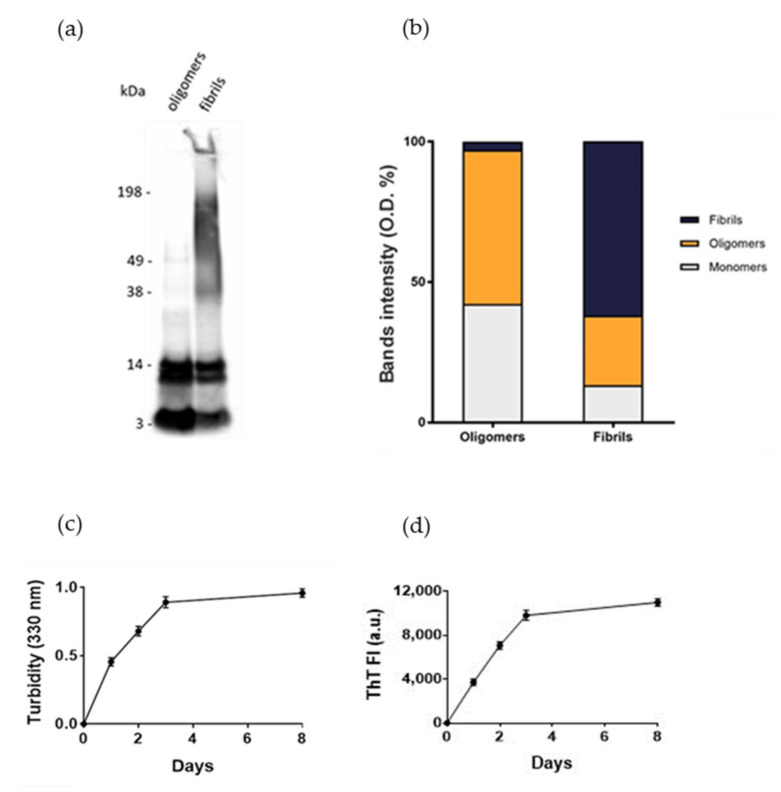
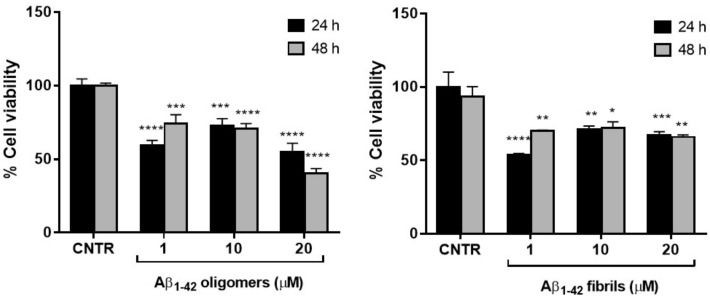
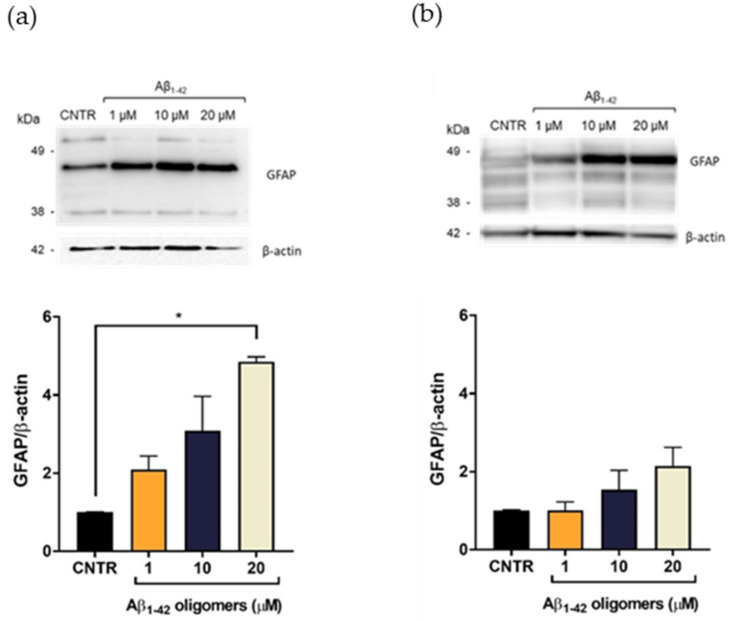
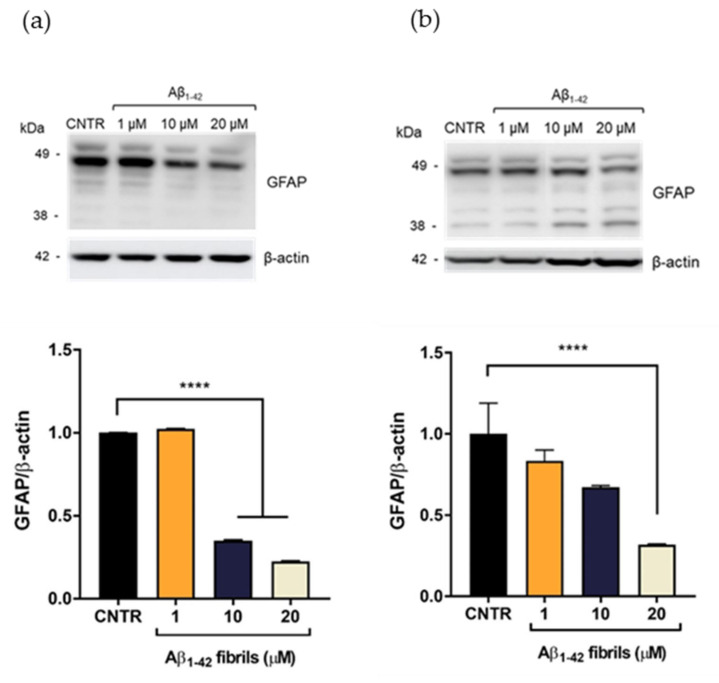
Verification
Claims the paper makes
The claims and statistics of this paper haven’t been checked yet.
Run the check — free, no account needed. It reads the open-access text and checks the sources it cites.
Claims other papers make about this one
Each is checked against this paper’s own text: does it say what the citing paper says it does?
The check wasn’t confident either way, so it gives no verdict — never disputed.
In the citing paper
“Finally, in neurons, PCSK9 overexpression led to a worsening of neurotoxicity induced by different aggregation forms of Aβ, which have previously been demonstrated to have toxic effects in these cells [31,52].”
From PCSK9 affects astrocyte cholesterol metabolism and reduces neuron cholesterol supplying in vitro: potential implications in Alzheimer’s disease (2022) · cites this paper as [31]
Experimental — accuracy not yet measured
Self-check
Percentages, sums and reported differences re-computed from the paper’s own numbers.
The self-check needs the paper’s full text.
Citations
Cites
ATP-binding cassette transporter A1: From metabolism to neurodegeneration
Koldamova, R., Fitz, N. F., & Lefterov, I. (2014) · Neurobiology of Disease · doi:10.1016/j.nbd.2014.05.007 · Cited by 144 · cited 2×
“Experiments on AD-like transgenic mice have demonstrated that silencing ABCA1 decreases the lipidation of apoE, increases the deposition of Aβ, and reduces drastically high-density lipoproteins’ (HDLs) levels in the brain parenchyma and in the cerebrospinal fluid (CSF) [8,9].”
BackgroundAkram, A., Schmeidler, J., Katsel, P., Hof, P. R., & Haroutunian, V. (2010) · Brain Research · doi:10.1016/j.brainres.2010.01.006 · Cited by 50
Research works printed but not linked: 38
- Hussain, 2019, Role of Cholesterol and Sphingolipids in Brain Development and Neurological Diseases, Lipids Health Dis., 18, 26, 10.1186/s12944-019-0965-z · DOI
- Gosselet, 2019, Oxysterols and the NeuroVascular Unit (NVU): A Far True Love with Bright and Dark Sides, J. Steroid Biochem. Mol. Biol., 191, 105368, 10.1016/j.jsbmb.2019.04.017 · DOI
- Chen, 2013, Cholesterol Efflux Is Differentially Regulated in Neurons and Astrocytes: Implications for Brain Cholesterol Homeostasis, Biochim. Biophys. Acta, 1831, 263, 10.1016/j.bbalip.2012.09.007 · DOI · Paper page
- Vitali, 2014, HDL and Cholesterol Handling in the Brain, Cardiovasc. Res., 103, 405, 10.1093/cvr/cvu148 · DOI · Paper page
- Arenas, 2017, Intracellular Cholesterol Trafficking and Impact in Neurodegeneration, Front. Mol. Neurosci., 10, 382, 10.3389/fnmol.2017.00382 · DOI
- Meaney, 2004, Brain Cholesterol: Long Secret Life behind a Barrier, Arterioscler. Thromb. Vasc. Biol., 24, 806, 10.1161/01.ATV.0000120374.59826.1b · DOI · Paper page
- Kamphuis, W., Mamber, C., Moeton, M., Kooijman, L., Sluijs, J.A., Jansen, A.H., Verveer, M., de Groot, L.R., Smith, V.D., and Rangarajan, S. (2012). GFAP Isoforms in Adult Mouse Brain with a Focus on Neurogenic Astrocytes and Reactive Astrogliosis in Mouse Models of Alzheimer Disease. PLoS ONE, 7. · DOI
- Wahrle, 2004, ABCA1 Is Required for Normal Central Nervous System apoE Levels and for Lipidation of Astrocyte-Secreted apoE, J. Biol. Chem., 279, 40987, 10.1074/jbc.M407963200 · DOI · Paper page
- Liu, 2013, Apolipoprotein E and Alzheimer Disease: Risk, Mechanisms, and Therapy, Nat. Rev. Neurosci., 9, 106
- Roheim, 1979, Apolipoproteins in Human Cerebrospinal Fluid, Proc. Natl. Acad. Sci. USA, 76, 4646, 10.1073/pnas.76.9.4646 · DOI · Paper page
- Elliott, 2010, Apolipoproteins in the Brain: Implications for Neurological and Psychiatric Disorders, Clin. Lipidol., 51, 555, 10.2217/clp.10.37 · DOI · Paper page
- Merched, 2000, Decreased High-Density Lipoprotein Cholesterol and Serum Apolipoprotein AI Concentrations Are Highly Correlated with the Severity of Alzheimer’s Disease, Neurobiol. Aging, 21, 27, 10.1016/S0197-4580(99)00103-7 · DOI
- Zetterberg, 2010, Biochemical Markers in Alzheimer’s Disease Clinical Trials, Biomark. Med., 4, 91, 10.2217/bmm.09.80 · DOI
- Nardo, 2016, Fluorimetric Detection of the Earliest Events in Amyloid β Oligomerization and Its Inhibition by Pharmacologically Active Liposomes, Biochim. Biophys. Acta, 1860, 746, 10.1016/j.bbagen.2016.01.003 · DOI
- Balducci, 2014, Multifunctional Liposomes Reduce Brain β-Amyloid Burden and Ameliorate Memory Impairment in Alzheimer’s Disease Mouse Models, J. Neurosci. Off. J. Soc. Neurosci., 34, 14022, 10.1523/JNEUROSCI.0284-14.2014 · DOI · Paper page
- Bana, 2014, Liposomes Bi-Functionalized with Phosphatidic Acid and an ApoE-Derived Peptide Affect Aβ Aggregation Features and Cross the Blood-Brain-Barrier: Implications for Therapy of Alzheimer Disease, Nanomed. Nanotechnol. Biol. Med., 10, 1583, 10.1016/j.nano.2013.12.001 · DOI
- Sengupta, 2016, The Role of Amyloid-β Oligomers in Toxicity, Propagation, and Immunotherapy, EBioMedicine, 6, 42, 10.1016/j.ebiom.2016.03.035 · DOI · Paper page
- Chafekar, 2008, Oligomer-Specific Abeta Toxicity in Cell Models Is Mediated by Selective Uptake, Biochim. Biophys. Acta. Sep., 1782, 523, 10.1016/j.bbadis.2008.06.003 · DOI
- Korolainen, 2005, Proteomic Analysis of Glial Fibrillary Acidic Protein in Alzheimer’s Disease and Aging Brain, Neurobiol. Dis., 20, 858, 10.1016/j.nbd.2005.05.021 · DOI
- Jacque, 1978, Determination of Glial Fibrillary Acidic Protein (GFAP) in Human Brain Tumors, J. Neurol. Sci., 35, 147, 10.1016/0022-510X(78)90107-7 · DOI
- Hara, 1991, Proliferative Assessment of GFAP-Positive and GFAP-Negative Glioma Cells by Nucleolar Organizer Region Staining, Surg. Neurol., 36, 190, 10.1016/0090-3019(91)90111-L · DOI
- Fünfschilling, U., Saher, G., Xiao, L., Möbius, W., and Nave, K.A. (2007). Survival of Adult Neurons Lacking Cholesterol Synthesis in vivo. BMC Neurosci., 8. · DOI · Paper page
- Fitz, 2015, Opposing Effects of Apoe/Apoa1 Double Deletion on Amyloid-β Pathology and Cognitive Performance in APP Mice, Brain, 138, 3699, 10.1093/brain/awv293 · DOI
- Slot, 2017, Apolipoprotein A1 in Cerebrospinal Fluid and Plasma and Progression to Alzheimer′s Disease in Non-Demented Elderly, J. Alzheimer’s Dis., 56, 687, 10.3233/JAD-151068 · DOI
- Dai, 2018, Liposomes and Lipid Disks Traverse the BBB and BBTB as Intact Forms as Revealed by Two-Step Förster Resonance Energy Transfer Imaging, Acta Pharm. Sinica B, 8, 261, 10.1016/j.apsb.2018.01.004 · DOI
- Wu, 2009, Double Superhelix Model of High Density Lipoprotein, J. Biol. Chem., 284, 36605, 10.1074/jbc.M109.039537 · DOI
- Rizzuto, 2021, H-Ferritin Nanoparticle-Mediated Delivery of Antibodies Across a BBB in vitro Model for Treatment of Brain Malignancies, Biomater. Sci., 9, 2032, 10.1039/D0BM01726D · DOI
- Weksler, 2005, Blood-Brain Barrier-Specific Properties of a Human Adult Brain Endothelial Cell Line, FASEB J., 19, 1872, 10.1096/fj.04-3458fje · DOI
- Simonelli, 2019, The Extent of Human Apolipoprotein a-i Lipidation Strongly Affects the β-Amyloid Efflux Across the Blood-Brain Barrier in vitro, Front. Neurosci., 13, 419, 10.3389/fnins.2019.00419 · DOI
- Zhou, 2012, Apolipoprotein A-I Crosses the Blood-Brain Barrier through Clathrin-Independent and Cholesterol-Mediated Endocytosis, Cancer Res., 369, 282
- Balazs, 2004, Uptake and Transport of High-Density Lipoprotein (HDL) and HDL-Associated Alpha-Tocopherol by an in vitro Blood-Brain Barrier Model, J. Neurochem., 89, 939, 10.1111/j.1471-4159.2004.02373.x · DOI
- Dal Magro, R., Vitali, A., Fagioli, S., Casu, A., Falqui, A., Formicola, B., Taiarol, L., Cassina, V., Marrano, C.A., and Mantegazza, F. (2021). Oxidative Stress Boosts the Uptake of Cerium Oxide Nanoparticles by Changing Brain Endothelium Microvilli Pattern. Antioxidants, 10. · DOI
- Mancini, 2016, The Hunt for Brain Aβ Oligomers by Peripherally Circulating Multi-Functional Nanoparticles: Potential Therapeutic Approach for Alzheimer Disease, Nanomed. Nanotechnol. Biol. Med., 12, 43, 10.1016/j.nano.2015.09.003 · DOI
- Smith, 1985, Measurement of Protein Using Bicinchoninic Acid, Anal. Biochem., 150, 76, 10.1016/0003-2697(85)90442-7 · DOI · Paper page
- Robinson, 2014, Quantification of Quaternary Structure Stability in Aggregation-Prone Proteins under Physiological Conditions: The Transthyretin Case, Biochemistry, 53, 6496, 10.1021/bi500739q · DOI
- Stewart, 1980, Colorimetric Determination of Phospholipids with Ammonium Ferrothiocyanate, Anal. Biochem., 104, 10, 10.1016/0003-2697(80)90269-9 · DOI
- Gobbi, 2010, Lipid-Based Nanoparticles with High Binding Affinity for Amyloid-Beta1–42 Peptide, Biomaterials, 31, 6519, 10.1016/j.biomaterials.2010.04.044 · DOI · Paper page
- Omidi, 2003, Evaluation of the Immortalised Mouse Brain Capillary Endothelial Cell Line, b.End3, as an in vitro Blood-Brain Barrier Model for Drug Uptake and Transport Studies, Brain Res., 990, 95, 10.1016/S0006-8993(03)03443-7 · DOI · Paper page
Cited by
Sorted by citations
Papotti, B., Adorni, M. P., Marchi, C., Zimetti, F., Ronda, N., Panighel, G., Lupo, M. G., Vilella, A., Giuliani, D., Ferri, N., et al. (2022) · International Journal of Molecular Sciences · doi:10.3390/ijms232012192 · Cited by 41
Metadata
- Authors
- Sierri, G., Dal Magro, R., Vergani, B., Leone, B. E., Formicola, B., Taiarol, L., Fagioli, S., Kravicz, M., Tremolizzo, L., Calabresi, L., & Re, F.
- Affiliations
- BioNanoMedicine Center NANOMIB, School of Medicine and Surgery, University of Milano-Bicocca, 20900 Monza, Italy
- School of Medicine and Surgery, University of Milano-Bicocca, 20900 Monza, Italy
- Department of Pharmacological and Biomolecular Science, Centro Grossi Paoletti, University of Milan, 20133 Milan, Italy
- ORCID
- Venue
- International Journal of Molecular Sciences
- Publisher
- MDPI AG
- Published
- 2021-12-22
- Volume
- 23
- Issue
- 1
- Pages
- 102
- ISSN
- 1422-0067
- PMC
- PMC8745016
- Cited by
- 16
- References
- 2
- Language
- en
- Funders
- PRIN Research Italy (2017PFYK27)
About these checks
Registry, retraction, Cites and statistics results are computed, not judged, with one exception: a printed reference that no index lists is read once by a model before it counts as a citation error. Claims are extracted by a model and kept only when their quote appears verbatim in the text; each cited source is then checked, with a model’s help, for whether it says what the claim relies on. Those verdicts can be wrong — read the claim’s quote and the cited source before relying on one.
Statistics and arithmetic are recomputed, not judged.
Confidence bands are shown only for fields calibrated on our annotated test set. None is calibrated yet, so no band is shown.
What counts as a claim ›How we measure confidence ›How we check this ›
Are you an author, or do you see a problem with this page? Request a review
