

The DOI matches its Crossref record; 7 of the 7 references it cites were found in a registry or an index.
Targeted Suppression of Lipoprotein Receptor LSR in Astrocytes Leads to Olfactory and Memory Deficits in Mice
Abstract
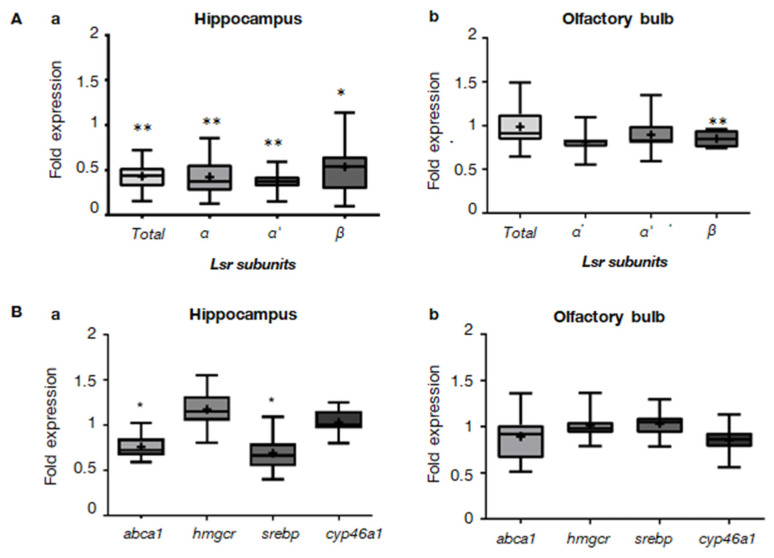
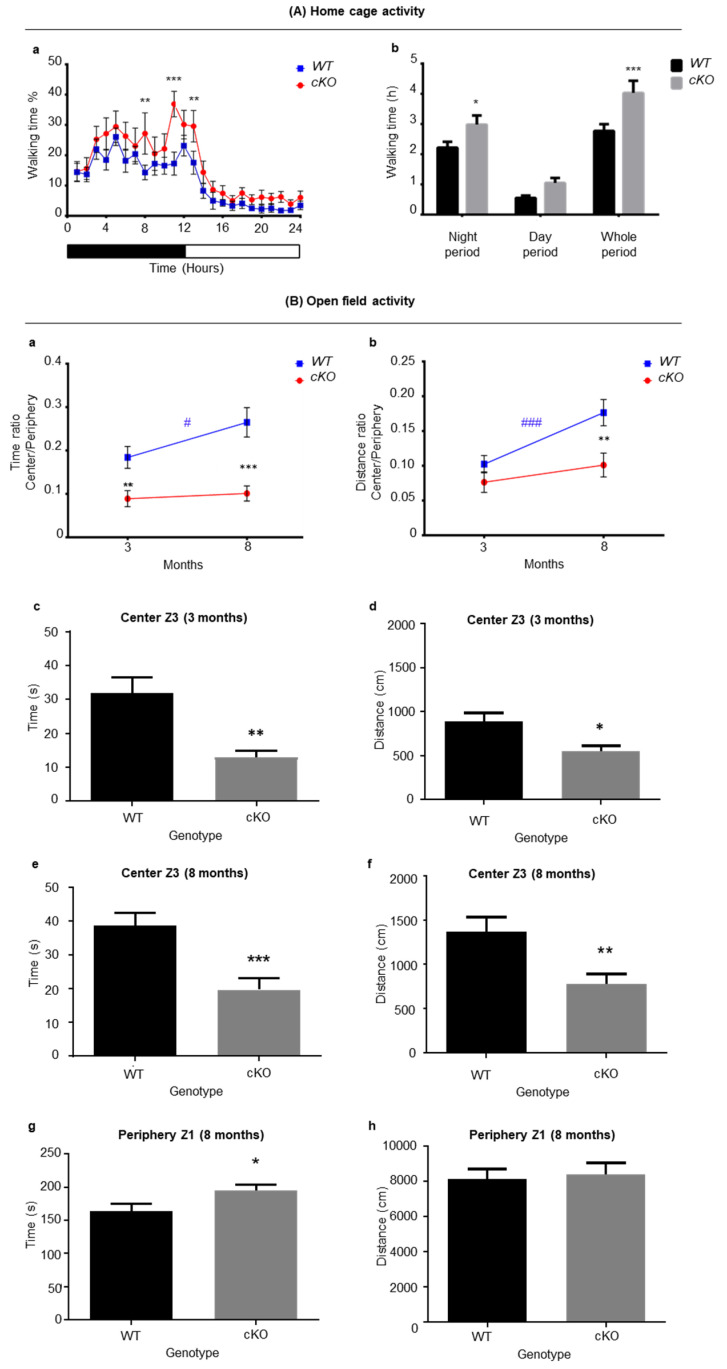
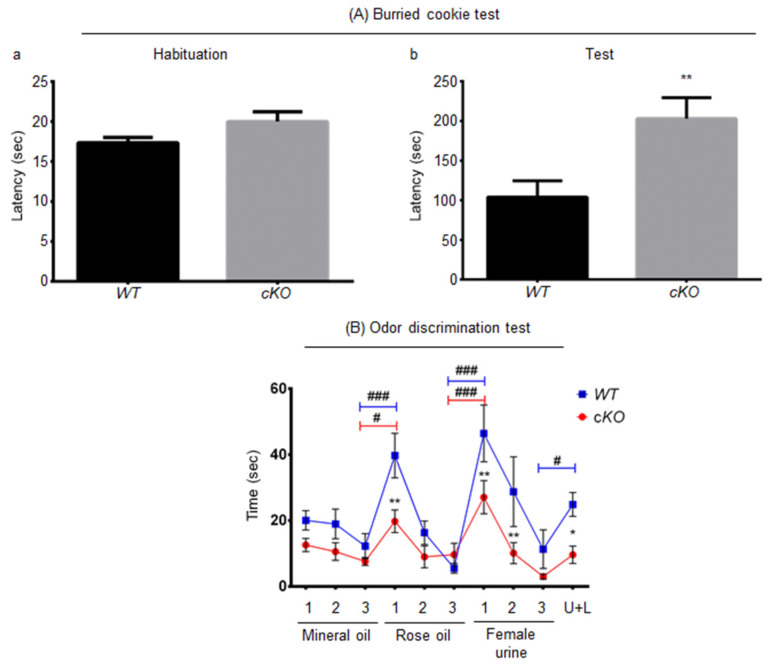
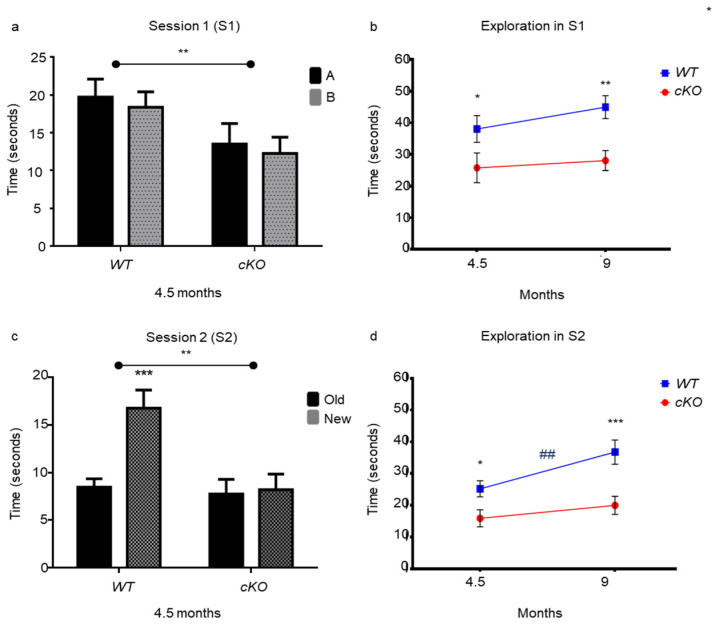
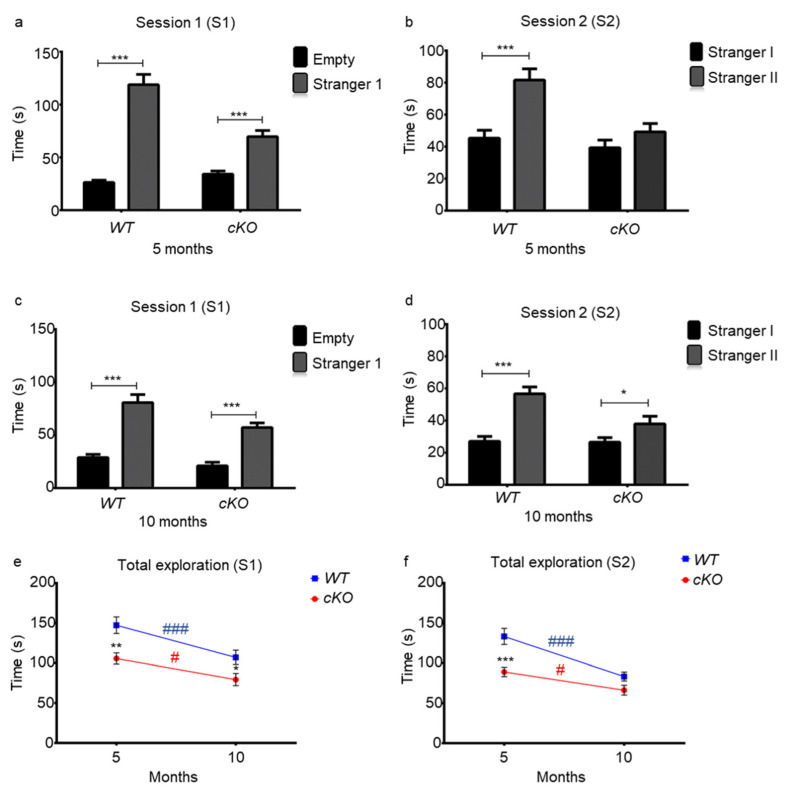
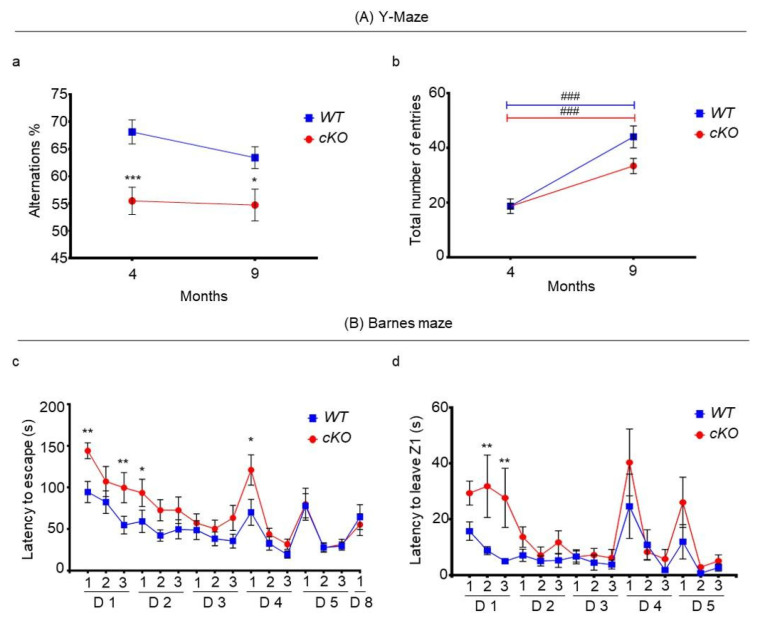
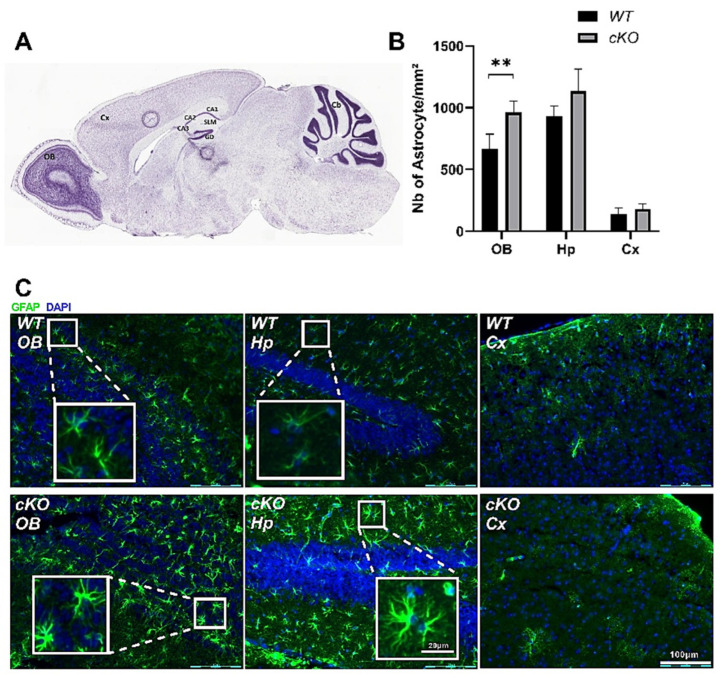
Perturbations of cholesterol metabolism have been linked to neurodegenerative diseases. Glia–neuron crosstalk is essential to achieve a tight regulation of brain cholesterol trafficking. Adequate cholesterol supply from glia via apolipoprotein E-containing lipoproteins ensures neuronal development and function. The lipolysis-stimulated lipoprotein receptor (LSR), plays an important role in brain cholesterol homeostasis. Aged heterozygote Lsr+/− mice show altered brain cholesterol distribution and increased susceptibility to amyloid stress. Since LSR expression is higher in astroglia as compared to neurons, we sought to determine if astroglial LSR deficiency could lead to cognitive defects similar to those of Alzheimer’s disease (AD). Cre recombinase was activated in adult Glast-CreERT/lsrfl/fl mice by tamoxifen to induce astroglial Lsr deletion. Behavioral phenotyping of young and old astroglial Lsr KO animals revealed hyperactivity during the nocturnal period, deficits in olfactory function affecting social memory and causing possible apathy, as well as visual memory and short-term working memory problems, and deficits similar to those reported in neurodegenerative diseases, such as AD. Furthermore, GFAP staining revealed astroglial activation in the olfactory bulb. Therefore, astroglial LSR is important for working, spatial, and social memory related to sensory input, and represents a novel pathway for the study of brain aging and neurodegeneration.
Overview
The claims and statistics of this paper haven’t been checked yet.
Run the check — free, no account needed. It reads the open-access text and checks the sources it cites.
Integrity signals
Registry
Cites
Statistics
Figures
Verification
Claims the paper makes
The claims and statistics of this paper haven’t been checked yet.
Run the check — free, no account needed. It reads the open-access text and checks the sources it cites.
Claims other papers make about this one
Each is checked against this paper’s own text: does it say what the citing paper says it does?
The source backs part of the claim, not all of it — or backs it for a different population, condition or comparison.
In the citing paper
“On the other hand, the cholesterol depletion hypothesis is in full accordance with the results of in vivo animal studies, in which silencing of lipoprotein receptors, implicated in cholesterol uptake and target of PCSK9, led to cognitive impairment [55,56,57,58,59], which was likely related to neuronal loss.”
From PCSK9 affects astrocyte cholesterol metabolism and reduces neuron cholesterol supplying in vitro: potential implications in Alzheimer’s disease (2022) · cites this paper as [56]
Experimental — accuracy not yet measured
Self-check
Percentages, sums and reported differences re-computed from the paper’s own numbers.
The self-check needs the paper’s full text.
Citations
Cites
Neuropsychiatric symptoms in Alzheimer's disease
Lyketsos, C. G., Carrillo, M. C., Ryan, J. M., Khachaturian, A. S., Trzepacz, P., Amatniek, J., Cedarbaum, J., Brashear, R., & Miller, D. S. (2011) · Alzheimer's & Dementia · doi:10.1016/j.jalz.2011.05.2410 · Cited by 1,139
Memory loss in Alzheimer's disease
Jahn, H. (2013) · Dialogues in Clinical Neuroscience · doi:10.31887/dcns.2013.15.4/hjahn · Cited by 653
Isoform-specific binding of apolipoprotein E to beta-amyloid.
LaDu, M. J., Falduto, M. T., Manelli, A. M., Reardon, C. A., Getz, G. S., & Frail, D. E. (1994) · Journal of Biological Chemistry · doi:10.1016/s0021-9258(17)31529-6 · Cited by 540
Visual memory predicts Alzheimer's disease more than a decade before diagnosis
Kawas, C. H., Corrada, M. M., Brookmeyer, R., Morrison, A., Resnick, S. M., Zonderman, A. B., & Arenberg, D. (2003) · Neurology · doi:10.1212/01.wnl.0000055813.36504.bf · Cited by 247
Djelti, F., Braudeau, J., Hudry, E., Dhenain, M., Varin, J., Bièche, I., Marquer, C., Chali, F., Ayciriex, S., Auzeil, N., et al. (2015) · Brain · doi:10.1093/brain/awv166 · Cited by 223
Fagan, A. M., Holtzman, D. M., Munson, G., Mathur, T., Schneider, D., Chang, L. K., Getz, G. S., Reardon, C. A., Lukens, J., Shah, J. A., et al. (1999) · Journal of Biological Chemistry · doi:10.1074/jbc.274.42.30001 · Cited by 222
Faure, A., Verret, L., Bozon, B., El Tannir El Tayara, N., Ly, M., Kober, F., Dhenain, M., Rampon, C., & Delatour, B. (2011) · Neurobiology of Aging · doi:10.1016/j.neurobiolaging.2009.03.009 · Cited by 112
Research works printed but not linked: 50
- Edlund, 1990, Lipid compositions of different regions of the human brain during aging, J. Neurochem., 54, 415, 10.1111/j.1471-4159.1990.tb01889.x · DOI
- Svennerholm, 1994, Membrane lipids, selectively diminished in Alzheimer brains, suggest synapse loss as a primary event in early-onset form (type I) and demyelination in late-onset form (type II), J. Neurochem., 62, 1039, 10.1046/j.1471-4159.1994.62031039.x · DOI
- Fabelo, 2018, “Lipid raft aging” in the human frontal cortex during nonpathological aging: Gender influences and potential implications in Alzheimer’s disease, Neurobiol. Aging, 67, 42, 10.1016/j.neurobiolaging.2018.02.022 · DOI
- Ledesma, 2012, Lipid changes in the aged brain: Effect on synaptic function and neuronal survival, Prog. Lipid Res., 51, 23, 10.1016/j.plipres.2011.11.004 · DOI
- Martin, 2010, Brain cholesterol in normal and pathological aging, Biochim. Biophys. Acta, 1801, 934, 10.1016/j.bbalip.2010.03.011 · DOI · Paper page
- Hicks, 2012, Lipid rafts and Alzheimer’s disease: Protein-lipid interactions and perturbation of signaling, Front. Physiol., 3, 189, 10.3389/fphys.2012.00189 · DOI
- Pitas, 1987, Lipoproteins and their receptors in the central nervous system. Characterization of the lipoproteins in cerebrospinal fluid and identification of apolipoprotein B,E(LDL) receptors in the brain, J. Biol. Chem., 262, 14352, 10.1016/S0021-9258(18)47945-8 · DOI · Paper page
- Jeske, 1980, Regulation of rates of cholesterol synthesis in vivo in the liver and carcass of the rat measured using [3H]water, J. Lipid Res., 21, 364, 10.1016/S0022-2275(20)39816-3 · DOI · Paper page
- Chen, 2013, Cholesterol efflux is differentially regulated in neurons and astrocytes: Implications for brain cholesterol homeostasis, Biochim. Biophys. Acta, 1831, 263, 10.1016/j.bbalip.2012.09.007 · DOI · Paper page
- Bihain, 1998, The lipolysis stimulated receptor: A gene at last, Curr. Opin. Lipidol., 9, 221, 10.1097/00041433-199806000-00006 · DOI
- Yen, 2008, Lipolysis stimulated lipoprotein receptor: A novel molecular link between hyperlipidemia, weight gain, and atherosclerosis in mice, J. Biol. Chem., 283, 25650, 10.1074/jbc.M801027200 · DOI
- Stenger, 2012, Brain region-specific immunolocalization of the lipolysis-stimulated lipoprotein receptor (LSR) and altered cholesterol distribution in aged LSR+/− mice, J. Neurochem., 123, 467, 10.1111/j.1471-4159.2012.07922.x · DOI
- Narvekar, 2009, Liver-specific loss of lipolysis-stimulated lipoprotein receptor triggers systemic hyperlipidemia in mice, Diabetes, 58, 1040, 10.2337/db08-1184 · DOI
- Mesli, 2004, Distribution of the lipolysis stimulated receptor in adult and embryonic murine tissues and lethality of LSR−/− embryos at 12.5 to 14.5 days of gestation, Eur. J. Biochem., 271, 3103, 10.1111/j.1432-1033.2004.04223.x · DOI
- Sohet, 2015, LSR/angulin-1 is a tricellular tight junction protein involved in blood-brain barrier formation, J. Cell Biol., 208, 703, 10.1083/jcb.201410131 · DOI · Paper page
- Martin, 2006, Lipid droplets: A unified view of a dynamic organelle, Nat. Rev. Mol. Cell Biol., 7, 373, 10.1038/nrm1912 · DOI
- El Hajj, A., Yen, F.T., Oster, T., Malaplate, C., Pauron, L., Corbier, C., Lanhers, M.C., and Claudepierre, T. (2019). Age-related changes in regiospecific expression of Lipolysis Stimulated Receptor (LSR) in mice brain. PLoS ONE, 14. · DOI
- Slezak, 2007, Transgenic mice for conditional gene manipulation in astroglial cells, Glia, 55, 1565, 10.1002/glia.20570 · DOI
- Streicher, 1996, SREBP-1 mediates activation of the low-density lipoprotein receptor promoter by insulin and insulin-like growth factor-I, J. Biol. Chem., 271, 7128, 10.1074/jbc.271.12.7128 · DOI · Paper page
- Horton, 2002, SREBPs: Activators of the complete program of cholesterol and fatty acid synthesis in the liver, J. Clin. Investig., 109, 1125, 10.1172/JCI0215593 · DOI · Paper page
- Liu, 2002, Shear stress activation of SREBP1 in endothelial cells is mediated by integrins, Arterioscler. Thromb. Vasc. Biol., 22, 76, 10.1161/hq0102.101822 · DOI
- Thomas, 2015, Increased susceptibility of dyslipidemic LSR+/− mice to amyloid stress is associated with changes in cortical cholesterol levels, J. Alzheimer’s Dis., 45, 195, 10.3233/JAD-142127 · DOI
- Filali, 2011, Anomalies in social behaviors and exploratory activities in an APPswe/PS1 mouse model of Alzheimer’s disease, Physiol. Behav., 104, 880, 10.1016/j.physbeh.2011.05.023 · DOI
- Ruthirakuhan, 2019, The roles of apathy and depression in predicting Alzheimer Disease: A longitudinal analysis in older adults with Mild Cognitive Impairment, Am. J. Geriatr. Psychiatry, 27, 873, 10.1016/j.jagp.2019.02.003 · DOI
- Liang, 2016, Visual short-term memory binding deficit in familial Alzheimer’s disease, Cortex, 78, 150, 10.1016/j.cortex.2016.01.015 · DOI
- Didic, 2013, Impaired visual recognition memory predicts Alzheimer’s disease in amnestic mild cognitive impairment, Dement. Geriatr. Cogn. Disord., 35, 291, 10.1159/000347203 · DOI
- Kirova, 2015, Working memory and executive function decline across normal aging, mild cognitive impairment, and Alzheimer’s disease, Biomed. Res. Int., 2015, 748212, 10.1155/2015/748212 · DOI · Paper page
- Zou, 2016, Olfactory dysfunction in Alzheimer’s disease, Neuropsychiatr. Dis. Treat., 12, 869, 10.2147/NDT.S104886 · DOI
- Starkstein, 2006, A prospective longitudinal study of apathy in Alzheimer’s disease, J. Neurol. Neurosurg. Psychiatry, 77, 8, 10.1136/jnnp.2005.069575 · DOI
- Nobis, 2018, Apathy in Alzheimer’s disease, Curr. Opin. Behav. Sci., 22, 7, 10.1016/j.cobeha.2017.12.007 · DOI
- Liu, 2013, Apolipoprotein E and Alzheimer disease: Risk, mechanisms and therapy, Nat. Rev. Neurol., 9, 106, 10.1038/nrneurol.2012.263 · DOI · Paper page
- Bales, 2000, Neuroinflammation and Alzheimer’s disease: Critical roles for cytokine/Abeta-induced glial activation, NF-kappaB, and apolipoprotein E, Neurobiol. Aging., 21, 427, 10.1016/S0197-4580(00)00143-3 · DOI · Paper page
- Rapp, 2006, Implication of apoE isoforms in cholesterol metabolism by primary rat hippocampal neurons and astrocytes, Biochimie, 88, 473, 10.1016/j.biochi.2005.10.007 · DOI · Paper page
- Klein, 2010, Progressive loss of synaptic integrity in human apolipoprotein E4 targeted replacement mice and attenuation by apolipoprotein E2, Neuroscience, 171, 1265, 10.1016/j.neuroscience.2010.10.027 · DOI · Paper page
- Sen, 2012, Apolipoprotein E3 (ApoE3) but not ApoE4 protects against synaptic loss through increased expression of protein kinase C epsilon, J. Biol. Chem., 287, 15947, 10.1074/jbc.M111.312710 · DOI
- Zhao, 2020, Selective Loss of Brain-Derived Neurotrophic Factor Exacerbates Brain Injury by Enhancing Neuroinflammation in Experimental Streptococcus pneumoniae Meningitis, Front Immunol., 11, 1357, 10.3389/fimmu.2020.01357 · DOI
- Seo, 2018, Microglial involvement in the development of olfactory dysfunction, J. Vet. Sci., 19, 319, 10.4142/jvs.2018.19.3.319 · DOI
- Belhaj, 2013, Anxiolytic-like effect of a salmon phospholipopeptidic complex composed of polyunsaturated fatty acids and bioactive peptides, Mar. Drugs., 11, 4294, 10.3390/md11114294 · DOI
- Misslin, 1981, Effects of lateral amygdala lesions on the responses to novelty in mice, Behav. Processes., 6, 329, 10.1016/0376-6357(81)90050-4 · DOI
- Elhabazi, 2006, Preliminary study on immunological and behavioural effects of Thymus broussonetii Boiss., an endemic species in Morocco, J. Ethnopharmacol., 103, 413, 10.1016/j.jep.2005.08.034 · DOI
- Fleming, 2008, Olfactory deficits in mice overexpressing human wildtype alpha-synuclein, Eur. J. Neurosci., 28, 247, 10.1111/j.1460-9568.2008.06346.x · DOI
- Yang, 2009, Simple behavioral assessment of mouse olfaction, Curr Protoc Neurosci., 8, 8
- Meunier, 2020, The olfactory mucosa, first actor of olfactory detection, is sensitive to glucocorticoid hormone, Eur. J. Neurosci., 51, 1403, 10.1111/ejn.14564 · DOI
- Leger, 2013, Object recognition test in mice, Nat. Protoc., 8, 2531, 10.1038/nprot.2013.155 · DOI · Paper page
- Lo, 2016, Characterization of social behaviors in caspase-3 deficient mice, Sci Rep., 6, 18335, 10.1038/srep18335 · DOI
- Barnes, 1979, Memory deficits associated with senescence: A neurophysiological and behavioral study in the rat, J. Comp. Physiol. Psychol., 93, 74, 10.1037/h0077579 · DOI · Paper page
- Youn, 2012, Finding the right motivation: Genotype-dependent differences in effective reinforcements for spatial learning, Behav. Brain Res., 226, 397, 10.1016/j.bbr.2011.09.034 · DOI
- Pfaffl, 2001, A new mathematical model for relative quantification in real-time RT-PCR, Nucleic Acids Res., 29, e45, 10.1093/nar/29.9.e45 · DOI · Paper page
- Boda, 2009, Selection of reference genes for quantitative real-time RT-PCR studies in mouse brain, J. Mol. Neurosci., 37, 238, 10.1007/s12031-008-9128-9 · DOI
- Livak, 2001, Analysis of relative gene expression data using real-time quantitative PCR and the 2−∆∆Ct method, Methods, 25, 402, 10.1006/meth.2001.1262 · DOI · Paper page
Cited by
Sorted by citations
Papotti, B., Adorni, M. P., Marchi, C., Zimetti, F., Ronda, N., Panighel, G., Lupo, M. G., Vilella, A., Giuliani, D., Ferri, N., et al. (2022) · International Journal of Molecular Sciences · doi:10.3390/ijms232012192 · Cited by 41
Metadata
- Authors
- El Hajj, A., Herzine, A., Calcagno, G., Désor, F., Djelti, F., Bombail, V., Denis, I., Oster, T., Malaplate, C., Vigier, M., Kaminski, S., Pauron, L., Corbier, C., Yen, F. T., Lanhers, M.-C., & Claudepierre, T.
- Affiliations
- UR AFPA Laboratory, Qualivie Team, University of Lorraine, 54505 Vandoeuvre-lès-Nancy, France
- UR 7300, Stress Immunity Pathogens Laboratory, Faculty of Medicine, University of Lorraine, 54500 Vandœuvre-lès-Nancy, France
- UMR 914, Physiology of Nutrition and Feeding Behaviour, INRAE-Agroparistech-Université Paris-Saclay, 78352 Jouy-en-Josas, France
- ORCID
- Venue
- International Journal of Molecular Sciences
- Publisher
- MDPI AG
- Published
- 2022-02-12
- Volume
- 23
- Issue
- 4
- Pages
- 2049
- ISSN
- 1422-0067
- PMC
- PMC8878779
- Cited by
- 9
- References
- 7
- Language
- en
- Funders
- Region Lorraine (N/A)
- FEDER (N/A)
- Fondation Alzheimer (N/A)
- LUE Impact Biomolecules (N/A)
- Ministry of Higher Education Research and Innovation (N/A)
- Inserm (N/A)
About these checks
Registry, retraction, Cites and statistics results are computed, not judged, with one exception: a printed reference that no index lists is read once by a model before it counts as a citation error. Claims are extracted by a model and kept only when their quote appears verbatim in the text; each cited source is then checked, with a model’s help, for whether it says what the claim relies on. Those verdicts can be wrong — read the claim’s quote and the cited source before relying on one.
Statistics and arithmetic are recomputed, not judged.
Confidence bands are shown only for fields calibrated on our annotated test set. None is calibrated yet, so no band is shown.
What counts as a claim ›How we measure confidence ›How we check this ›
Are you an author, or do you see a problem with this page? Request a review
