

The DOI matches its Crossref record; 5 of the 5 references it cites were found in a registry or an index.
Temporal Shifts in MicroRNAs Signify the Inflammatory State of Primary Murine Microglial Cells
Published version of a preprint
Abstract
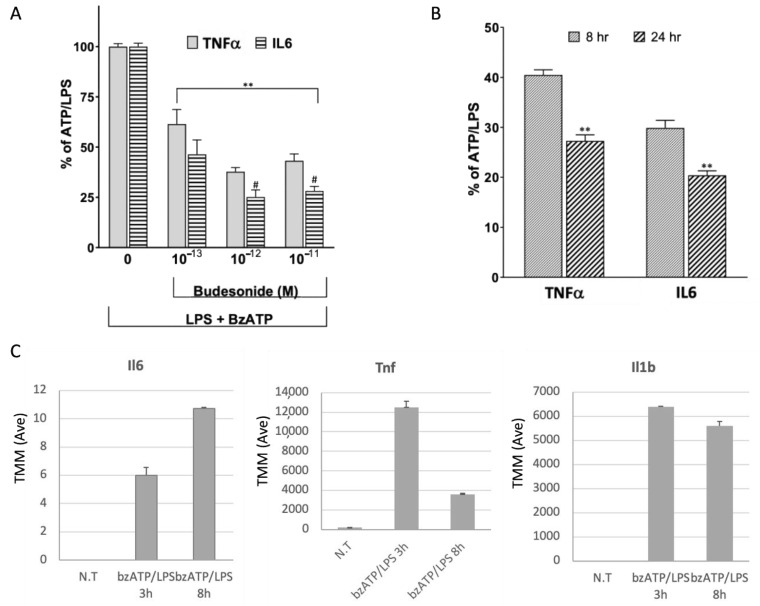
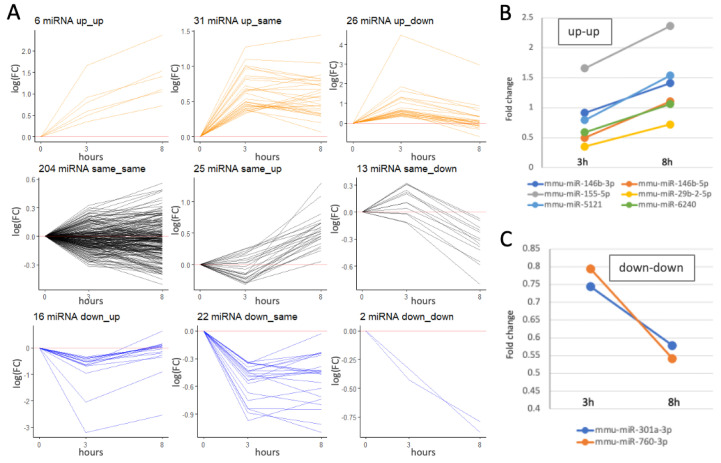
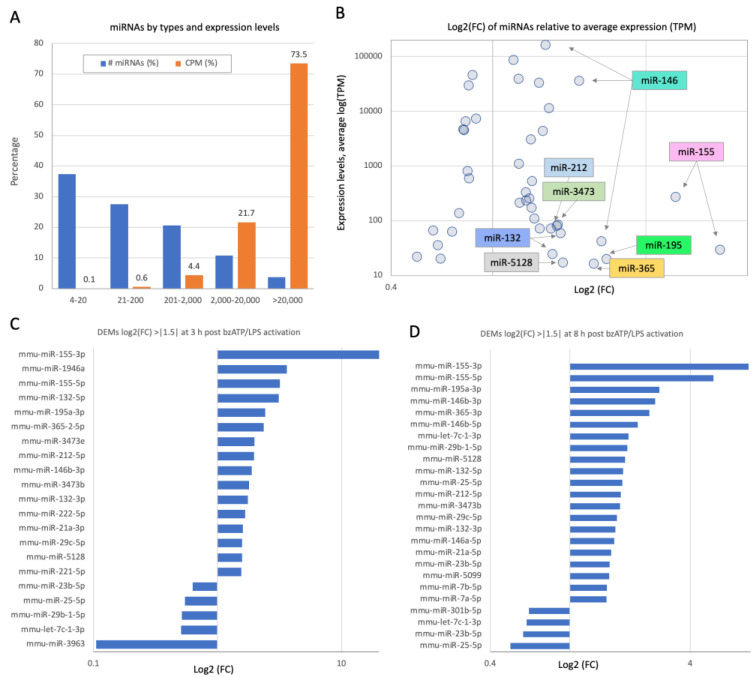
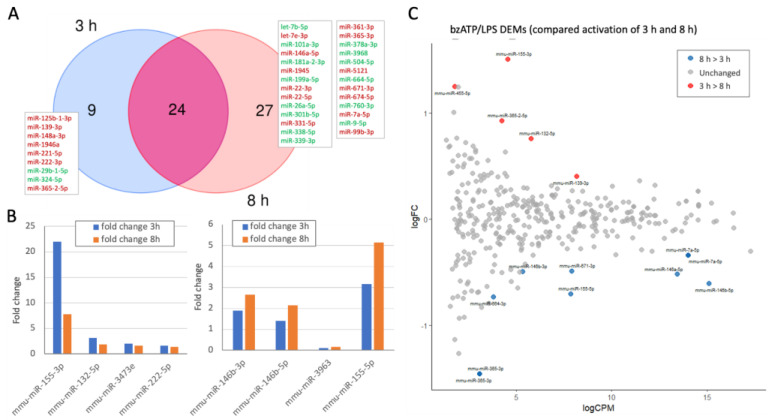
The primary function of microglia is to maintain brain homeostasis. In neurodegenerative diseases like Alzheimer’s, microglia contribute to neurotoxicity and inflammation. In this study, we exposed neonatal murine primary microglial cultures to stimuli mimicking pathogens, injury, or toxins. Treatment with benzoyl ATP (bzATP) and lipopolysaccharide (LPS) triggered a coordinated increase in interleukin and chemokine expression. We analyzed statistically significant differentially expressed microRNAs (DEMs) at 3 and 8 h post-activation, identifying 33 and 57 DEMs, respectively. Notably, miR-155, miR-132, miR-3473e, miR-222, and miR-146b showed strong temporal regulation, while miR-3963 was sharply downregulated by bzATP. These DEMs regulate inflammatory pathways, including TNFα and NFκB signaling. We also examined the effect of ladostigil, a neuroprotective agent known to reduce oxidative stress and inflammation. At 8 h post-activation, ladostigil induced upregulation of anti-inflammatory miRNAs, such as miR-27a, miR-27b, and miR-23b. Our findings suggest that miRNA profiles reflect microglial responses to inflammatory cues and that ladostigil modulates these responses. This model of controlled microglial activation offers a powerful tool with which to study inflammation in the aging brain and the progression of neurodegenerative diseases.
Overview
The claims and statistics of this paper haven’t been checked yet.
Run the check — free, no account needed. It reads the open-access text and checks the sources it cites.
Integrity signals
Registry
Cites
Statistics
Figures
Verification
Claims the paper makes
The claims and statistics of this paper haven’t been checked yet.
Run the check — free, no account needed. It reads the open-access text and checks the sources it cites.
Claims other papers make about this one
Each is checked against this paper’s own text: does it say what the citing paper says it does?
The source backs part of the claim, not all of it — or backs it for a different population, condition or comparison.
In the citing paper
“Interestingly, miR-132-5p was recently reported to be among a small set of temporally responsive core miRNAs that drive the establishment and resolution of the inflammatory response upon exposure of healthy murine microglia to LPS [135].”
From microRNA-132 attenuates inflammation in induced pluripotent stem cell-derived microglia from Alzheimer’s disease patients (2026) · cites this paper as [135]
Experimental — accuracy not yet measured
Self-check
Percentages, sums and reported differences re-computed from the paper’s own numbers.
The self-check needs the paper’s full text.
Citations
Cites
Identification of a unique TGF-β–dependent molecular and functional signature in microglia
Butovsky, O., Jedrychowski, M. P., Moore, C. S., Cialic, R., Lanser, A. J., Gabriely, G., Koeglsperger, T., Dake, B., Wu, P. M., Doykan, C. E., et al. (2014) · Nature Neuroscience · doi:10.1038/nn.3599 · Cited by 2,543
Role of neuroinflammation in neurodegeneration development
Zhang, W., Xiao, D., Mao, Q., & Xia, H. (2023) · Signal Transduction and Targeted Therapy · doi:10.1038/s41392-023-01486-5 · Cited by 1,668 · cited 1×
“Microglia, the resident immune cells of the CNS, play a central role in responding to injury and pathological stimuli [3].”
MiR-155: An Important Regulator of Neuroinflammation
Zingale, V. D., Gugliandolo, A., & Mazzon, E. (2021) · International Journal of Molecular Sciences · doi:10.3390/ijms23010090 · Cited by 163
Harrison, E. B., Hochfelder, C. G., Lamberty, B. G., Meays, B. M., Morsey, B. M., Kelso, M. L., Fox, H. S., & Yelamanchili, S. V. (2016) · FEBS Open Bio · doi:10.1002/2211-5463.12092 · Cited by 151
Absence of miRNA-146a Differentially Alters Microglia Function and Proteome
Martin, N. A., Hyrlov, K. H., Elkjaer, M. L., Thygesen, E. K., Wlodarczyk, A., Elbaek, K. J., Aboo, C., Okarmus, J., Benedikz, E., Reynolds, R., et al. (2020) · Frontiers in Immunology · doi:10.3389/fimmu.2020.01110 · Cited by 36
Research works printed but not linked: 55
- Thakur, 2023, Neuroinflammation in Alzheimer’s disease: Current progress in molecular signaling and therapeutics, Inflammation, 46, 1, 10.1007/s10753-022-01721-1 · DOI · Paper page
- Voet, 2019, Inflammasomes in neuroinflammatory and neurodegenerative diseases, EMBO Mol. Med., 11, e10248, 10.15252/emmm.201810248 · DOI · Paper page
- Leng, 2021, Neuroinflammation and microglial activation in Alzheimer disease: Where do we go from here?, Nat. Rev. Neurol., 17, 157, 10.1038/s41582-020-00435-y · DOI · Paper page
- Von Bernhardi, R., Eugenín-von Bernhardi, L., and Eugenín, J. (2015). Microglial cell dysregulation in brain aging and neurodegeneration. Front. Aging Neurosci., 7. · DOI · Paper page
- Raffaele, S., Lombardi, M., Verderio, C., and Fumagalli, M. (2020). TNF production and release from microglia via extracellular vesicles: Impact on brain functions. Cells, 9. · DOI
- Rajendran, 2018, Microglia-mediated synapse loss in Alzheimer’s disease, J. Neurosci., 38, 2911, 10.1523/JNEUROSCI.1136-17.2017 · DOI · Paper page
- Zhang, G., Wang, Z., Hu, H., Zhao, M., and Sun, L. (2021). Microglia in Alzheimer’s disease: A target for therapeutic intervention. Front. Cell. Neurosci., 15. · DOI
- Shoham, 2019, Age-induced spatial memory deficits in rats are correlated with specific brain region alterations in microglial morphology and gene expression, J. Neuroimmune Pharmacol., 14, 251, 10.1007/s11481-018-9817-2 · DOI
- Colonna, 2017, Microglia Function in the Central Nervous System During Health and Neurodegeneration, Annu. Rev. Immunol., 35, 441, 10.1146/annurev-immunol-051116-052358 · DOI · Paper page
- Hemonnot, A.-L., Hua, J., Ulmann, L., and Hirbec, H. (2019). Microglia in Alzheimer disease: Well-known targets and new opportunities. Front. Aging Neurosci., 11. · DOI · Paper page
- Al-Ghraiybah, N.F., Wang, J., Alkhalifa, A.E., Roberts, A.B., Raj, R., Yang, E., and Kaddoumi, A. (2022). Glial Cell-Mediated Neuroinflammation in Alzheimer’s Disease. Int. J. Mol. Sci., 23. · DOI
- Potru, P.S., Vidovic, N., Wiemann, S., Russ, T., Trautmann, M., and Spittau, B. (2024). A Custom Panel for Profiling Microglia Gene Expression. Cells, 13. · DOI
- Zohar, K., Lezmi, E., Reichert, F., Eliyahu, T., Rotshenker, S., Weinstock, M., and Linial, M. (2023). Coordinated Transcriptional Waves Define the Inflammatory Response of Primary Microglial Culture. Int. J. Mol. Sci., 24. · DOI
- Linial, 2020, Effect of ladostigil treatment of aging rats on gene expression in four brain areas associated with regulation of memory, Neuropharmacology, 177, 108229, 10.1016/j.neuropharm.2020.108229 · DOI
- Reichert, F., Zohar, K., Lezmi, E., Eliyahu, T., Rotshenker, S., Linial, M., and Weinstock, M. (2024). Ladostigil Reduces the Adenoside Triphosphate/Lipopolysaccharide-Induced Secretion of Pro-Inflammatory Cytokines from Microglia and Modulate-Immune Regulators, TNFAIP3, and EGR1. Biomolecules, 14. · DOI
- He, 2018, RNA sequencing analysis reveals quiescent microglia isolation methods from postnatal mouse brains and limitations of BV2 cells, J. Neuroinflamm., 15, 153, 10.1186/s12974-018-1195-4 · DOI
- Thounaojam, 2013, MicroRNAs in the brain: It’s regulatory role in neuroinflammation, Mol. Neurobiol., 47, 1034, 10.1007/s12035-013-8400-3 · DOI
- Hussein, 2021, MicroRNAs in central nervous system disorders: Current advances in pathogenesis and treatment, Egypt. J. Neurol. Psychiatry Neurosurg., 57, 36, 10.1186/s41983-021-00289-1 · DOI
- Guo, Y., Hong, W., Wang, X., Zhang, P., Korner, H., Tu, J., and Wei, W. (2019). MicroRNAs in Microglia: How do MicroRNAs Affect Activation, Inflammation, Polarization of Microglia and Mediate the Interaction Between Microglia and Glioma?. Front. Mol. Neurosci., 12. · DOI
- Mahlab-Aviv, S., Linial, N., and Linial, M. (2021). miRNA Combinatorics and its Role in Cell State Control—A Probabilistic Approach. Front. Mol. Biosci., 8. · DOI
- Iwakawa, 2015, The Functions of MicroRNAs: mRNA Decay and Translational Repression, Trends Cell Biol., 25, 651, 10.1016/j.tcb.2015.07.011 · DOI
- Zohar, K., Lezmi, E., Eliyahu, T., and Linial, M. (2021). Ladostigil attenuates induced oxidative stress in human neuroblast-like SH-SY5Y cells. Biomedicines, 9. · DOI
- Schneider, 2019, Low-dose ladostigil for mild cognitive impairment: A phase 2 placebo-controlled clinical trial, Neurology, 93, e1474, 10.1212/WNL.0000000000008239 · DOI · Paper page
- van Wijk, N., Zohar, K., and Linial, M. (2022). Challenging cellular homeostasis: Spatial and temporal regulation of miRNAs. Int. J. Mol. Sci., 23. · DOI
- Reichholf, 2019, Time-Resolved Small RNA Sequencing Unravels the Molecular Principles of MicroRNA Homeostasis, Mol. Cell, 75, 756, 10.1016/j.molcel.2019.06.018 · DOI
- Hu, 2019, MicroRNA-23b alleviates neuroinflammation and brain injury in intracerebral hemorrhage by targeting inositol polyphosphate multikinase, Int. Immunopharmacol., 76, 105887, 10.1016/j.intimp.2019.105887 · DOI
- Zhang, 2019, miR-23b Negatively Regulates Sepsis-Induced Inflammatory Responses by Targeting ADAM10 in Human THP-1 Monocytes, Mediat. Inflamm., 2019, 5306541, 10.1155/2019/5306541 · DOI
- Wang, S., Kawashima, N., Han, P., Sunada-Nara, K., Yu, Z., Tazawa, K., Fujii, M., Kieu, T.Q., and Okiji, T. (2024). MicroRNA-27a-5p Downregulates Expression of Proinflammatory Cytokines in Lipopolysaccharide-Stimulated Human Dental Pulp Cells via the NF-kappaB Signaling Pathway. Int. J. Mol. Sci., 25. · DOI
- Kobeissy, 2025, MicroRNA miR-27a-5p Reduces Intestinal Inflammation Induced by Clostridioides difficile Flagella by Regulating the Nuclear Factor-kappaB Signaling Pathway, J. Infect. Dis., 231, e38, 10.1093/infdis/jiae396 · DOI
- Qu, M., Su, S., Jiang, L., Yu, X., Zhang, J., Zhu, H., Han, K., and Zhang, X. (2025). Exosomal miR-27a-5p attenuates inflammation through Toll-like receptor 7 in foodborne Salmonella infections. Vet. Microbiol., 302. · DOI
- D’Onofrio, N., Prattichizzo, F., Martino, E., Anastasio, C., Mele, L., La Grotta, R., Sardu, C., Ceriello, A., Marfella, R., and Paolisso, G. (2023). MiR-27b attenuates mitochondrial oxidative stress and inflammation in endothelial cells. Redox Biol., 62. · DOI
- Liang, 2018, MicroRNA-27b Modulates Inflammatory Response and Apoptosis during Mycobacterium tuberculosis Infection, J. Immunol., 200, 3506, 10.4049/jimmunol.1701448 · DOI
- Thulasingam, 2011, miR-27b*, an oxidative stress-responsive microRNA modulates nuclear factor-kB pathway in RAW 264.7 cells, Mol. Cell. Biochem., 352, 181, 10.1007/s11010-011-0752-2 · DOI
- Akhtar, 2010, MicroRNA-27b regulates the expression of matrix metalloproteinase 13 in human osteoarthritis chondrocytes, Arthritis Rheumatol., 62, 1361, 10.1002/art.27329 · DOI
- Deora, 2020, The microglial NLRP3 inflammasome is activated by amyotrophic lateral sclerosis proteins, Glia, 68, 407, 10.1002/glia.23728 · DOI · Paper page
- Parisi, 2013, Dysregulated microRNAs in amyotrophic lateral sclerosis microglia modulate genes linked to neuroinflammation, Cell Death Dis., 4, e959, 10.1038/cddis.2013.491 · DOI
- Jablonski, K.A., Gaudet, A.D., Amici, S.A., Popovich, P.G., and Guerau-de-Arellano, M. (2016). Control of the Inflammatory Macrophage Transcriptional Signature by miR-155. PLoS ONE, 11. · DOI · Paper page
- Remenyi, J., van den Bosch, M.W., Palygin, O., Mistry, R.B., McKenzie, C., Macdonald, A., Hutvagner, G., Arthur, J.S., Frenguelli, B.G., and Pankratov, Y. (2013). miR-132/212 knockout mice reveal roles for these miRNAs in regulating cortical synaptic transmission and plasticity. PLoS ONE, 8. · DOI · Paper page
- Huang, 2023, MiR-146a-5p Contributes to Microglial Polarization Transitions Associated with AGEs, Mol. Neurobiol., 60, 3020, 10.1007/s12035-023-03252-8 · DOI
- Xu, K., Li, Y., Zhou, Y., Zhang, Y., Shi, Y., Zhang, C., Bai, Y., and Wang, S. (2024). Neuroinflammation in Parkinson’s disease: Focus on the relationship between miRNAs and microglia. Front. Cell. Neurosci., 18. · DOI
- Geng, 2023, MALAT1 Mediates alpha-Synuclein Expression through miR-23b-3p to Induce Autophagic Impairment and the Inflammatory Response in Microglia to Promote Apoptosis in Dopaminergic Neuronal Cells, Mediat. Inflamm., 2023, 4477492, 10.1155/2023/4477492 · DOI
- Meldolesi, 2018, Exosomes and ectosomes in intercellular communication, Curr. Biol., 28, R435, 10.1016/j.cub.2018.01.059 · DOI · Paper page
- Jin, 2013, Circulating microRNAs: A novel class of potential biomarkers for diagnosing and prognosing central nervous system diseases, Cell. Mol. Neurobiol., 33, 601, 10.1007/s10571-013-9940-9 · DOI
- Long, 2020, Astrocyte-derived exosomes enriched with miR-873a-5p inhibit neuroinflammation via microglia phenotype modulation after traumatic brain injury, J. Neuroinflamm., 17, 89, 10.1186/s12974-020-01761-0 · DOI · Paper page
- Chen, Y.F., Luh, F., Ho, Y.S., and Yen, Y. (2024). Exosomes: A review of biologic function, diagnostic and targeted therapy applications, and clinical trials. J. Biomed. Sci., 31. · DOI
- Chevillet, 2014, Quantitative and stoichiometric analysis of the microRNA content of exosomes, Proc. Natl. Acad. Sci. USA, 111, 14888, 10.1073/pnas.1408301111 · DOI
- Dobin, 2013, STAR: Ultrafast universal RNA-seq aligner, Bioinformatics, 29, 15, 10.1093/bioinformatics/bts635 · DOI · Paper page
- Friedlander, 2012, miRDeep2 accurately identifies known and hundreds of novel microRNA genes in seven animal clades, Nucleic Acids Res., 40, 37, 10.1093/nar/gkr688 · DOI · Paper page
- Kozomara, 2019, miRBase: From microRNA sequences to function, Nucleic Acids Res., 47, D155, 10.1093/nar/gky1141 · DOI · Paper page
- Robinson, 2010, edgeR: A Bioconductor package for differential expression analysis of digital gene expression data, Bioinformatics, 26, 139, 10.1093/bioinformatics/btp616 · DOI · Paper page
- Szklarczyk, 2019, STRING v11: Protein–protein association networks with increased coverage, supporting functional discovery in genome-wide experimental datasets, Nucleic Acids Res., 47, D607, 10.1093/nar/gky1131 · DOI · Paper page
- Chang, 2020, miRNet 2.0: Network-based visual analytics for miRNA functional analysis and systems biology, Nucleic Acids Res., 48, W244, 10.1093/nar/gkaa467 · DOI
- Gillespie, 2022, The reactome pathway knowledgebase 2022, Nucleic acids Res., 50, D687, 10.1093/nar/gkab1028 · DOI
- Sayed, M., and Park, J.W. (2023). miRinGO: Prediction of biological processes indirectly targeted by human microRNAs. Non-Coding RNA, 9. · DOI
- Xu, 2022, dbDEMC 3.0: Functional exploration of differentially expressed miRNAs in cancers of human and model organisms, Genom. Proteom. Bioinform., 20, 446, 10.1016/j.gpb.2022.04.006 · DOI
Cited by
Sorted by citations
Penning, A., Snoeck, S., Ormaechea, O. R., Ayyildiz, D., Polzer, O., Buitrago-Arango, M., Capobianco, R., de Winter, F., Balusu, S., Verhaagen, J., et al. (2026) · Acta Neuropathologica Communications · doi:10.1186/s40478-026-02228-8 · Cited by 6
Metadata
- Authors
- Zohar, K., Lezmi, E., Reichert, F., Eliyahu, T., Rotshenker, S., Weinstock, M., & Linial, M.
- Affiliations
- Department of Biological Chemistry, Institute of Life Science, Faculty of Science, The Hebrew University of Jerusalem, Jerusalem 91904, Israel
- Department of Genetics, Institute of Life Science, Faculty of Science, The Hebrew University of Jerusalem, Jerusalem 91904, Israel
- Department of Medical Neurobiology, Institute for Medical Research Israel-Canada (IMRIC), Faculty of Medicine, The Hebrew University of Jerusalem, Jerusalem 91121, Israel
- Institute of Drug Research, School of Pharmacy, The Hebrew University of Jerusalem, Jerusalem 91120, Israel
- ORCID
- Linial, Michal
- Venue
- International Journal of Molecular Sciences
- Publisher
- MDPI AG
- Published
- 2025-06-13
- Volume
- 26
- Issue
- 12
- Pages
- 5677
- ISSN
- 1422-0067
- PMC
- PMC12193602
- Cited by
- 1
- References
- 5
- Language
- en
- Funders
- the Hebrew University of Jerusalem
About these checks
Registry, retraction, Cites and statistics results are computed, not judged, with one exception: a printed reference that no index lists is read once by a model before it counts as a citation error. Claims are extracted by a model and kept only when their quote appears verbatim in the text; each cited source is then checked, with a model’s help, for whether it says what the claim relies on. Those verdicts can be wrong — read the claim’s quote and the cited source before relying on one.
Statistics and arithmetic are recomputed, not judged.
Confidence bands are shown only for fields calibrated on our annotated test set. None is calibrated yet, so no band is shown.
What counts as a claim ›How we measure confidence ›How we check this ›
Are you an author, or do you see a problem with this page? Request a review
How to cite
Cite CoChat for the checks on this page, and the paper for its own findings.
- This page
- CoChat. (2026). Citation check: Temporal Shifts in MicroRNAs Signify the Inflammatory State of Primary Murine Microglial Cells. https://app.cochat.ai/papers/10.3390/ijms26125677
- The paper
- Zohar, K., Lezmi, E., Reichert, F., Eliyahu, T., Rotshenker, S., Weinstock, M., & Linial, M. (2025). Temporal Shifts in MicroRNAs Signify the Inflammatory State of Primary Murine Microglial Cells. International Journal of Molecular Sciences. https://doi.org/10.3390/ijms26125677
