

The DOI matches its Crossref record; 58 of the 60 references it cites were found in a registry or an index.
Augmentation of Glucotoxicity, Oxidative Stress, Apoptosis and Mitochondrial Dysfunction in HepG2 Cells by Palmitic Acid
Open accessAbstract
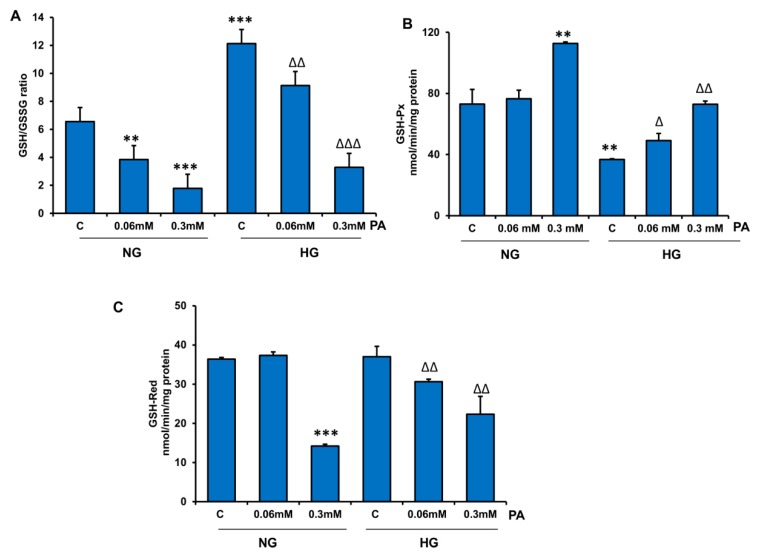
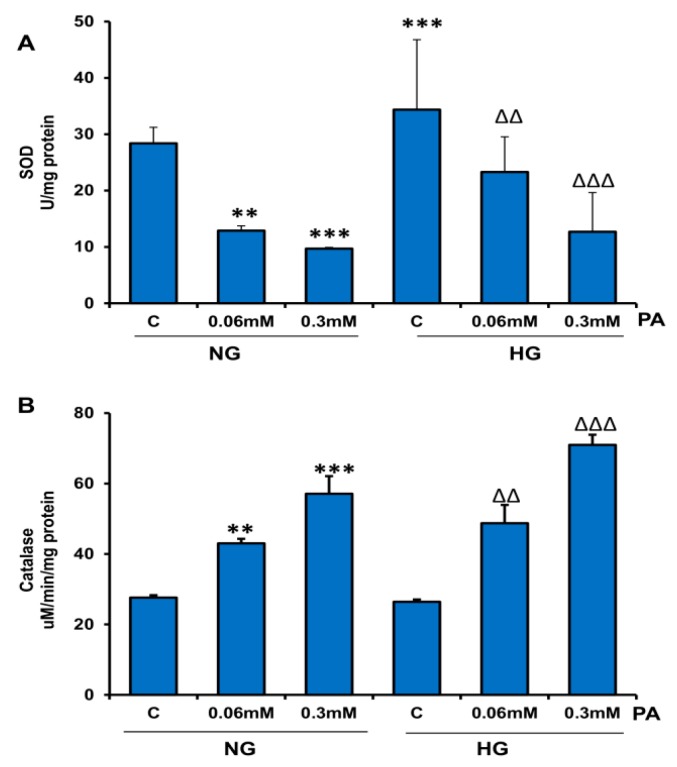
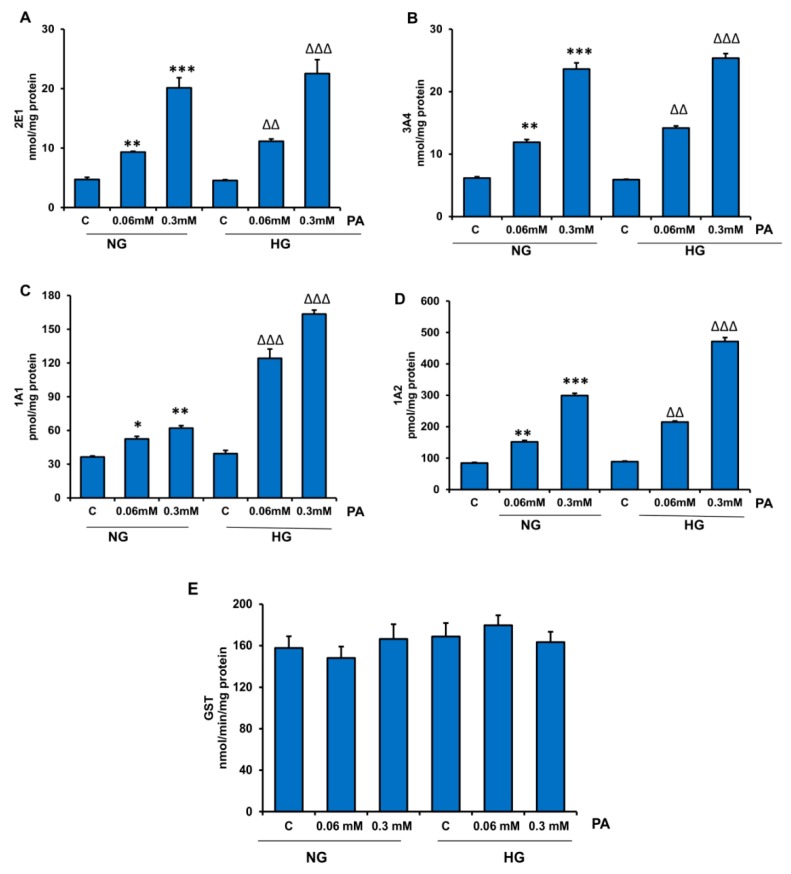
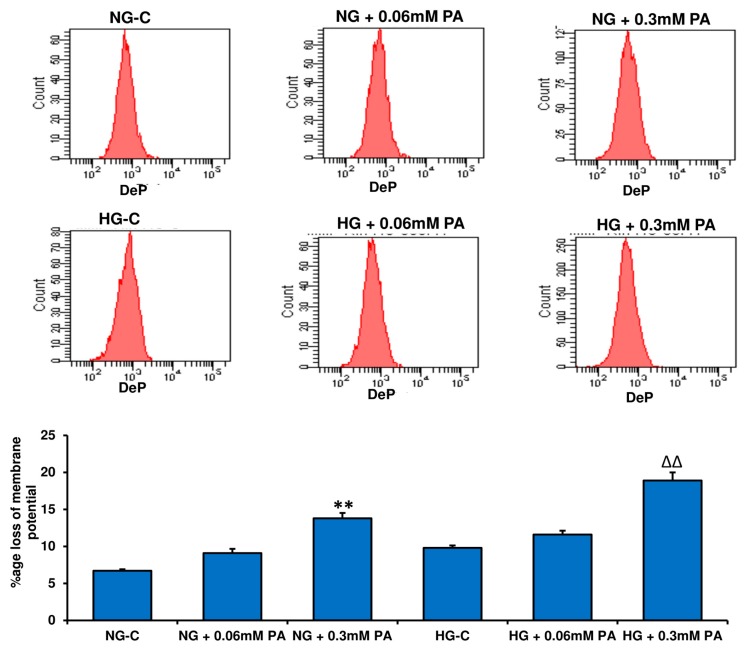
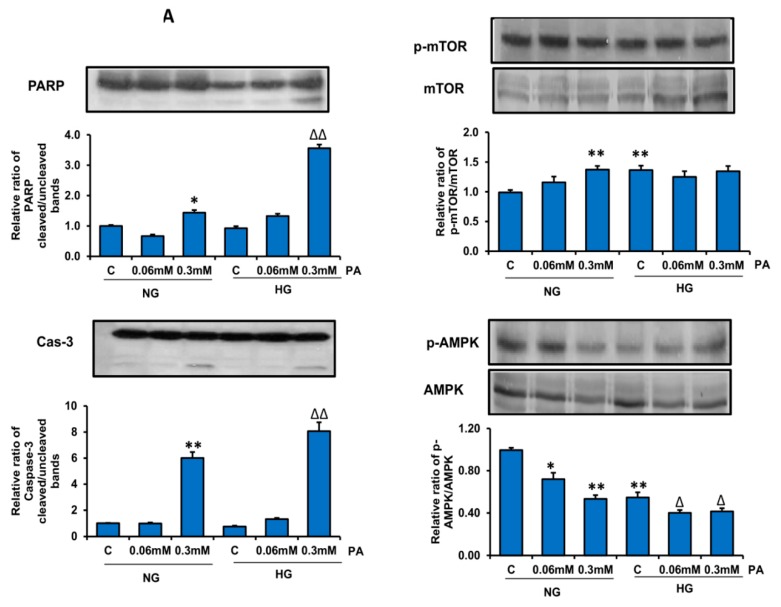
Hyperglycemia and hyperlipidemia are the hallmarks of diabetes and obesity. Experimental and epidemiological studies have suggested that dietary management and caloric restriction are beneficial in reducing the complications of diabesity. Studies have suggested that increased availability of energy metabolites like glucose and saturated fatty acids induces metabolic, oxidative, and mitochondrial stress, accompanied by inflammation that may lead to chronic complications in diabetes. In the present study, we used human hepatoma HepG2 cells to investigate the effects of high glucose (25 mM) and high palmitic acid (up to 0.3 mM) on metabolic-, inflammatory-, and redox-stress-associated alterations in these cells. Our results showed increased lipid, protein, and DNA damage, leading to caspase-dependent apoptosis and mitochondrial dysfunction. Glucolipotoxicity increased ROS production and redox stress appeared to alter mitochondrial membrane potential and bioenergetics. Our results also demonstrate the enhanced ability of cytochrome P450s-dependent drug metabolism and antioxidant adaptation in HepG2 cells treated with palmitic acid, which was further augmented with high glucose. Altered NF-kB/AMPK/mTOR-dependent cell signaling and inflammatory (IL6/TNF-α) responses were also observed. Our results suggest that the presence of high-energy metabolites enhances apoptosis while suppressing autophagy by inducing inflammatory and oxidative stress responses that may be responsible for alterations in cell signaling and metabolism.
Overview
The claims and statistics of this paper haven’t been checked yet.
Run the check — free, no account needed. It reads the open-access text and checks the sources it cites.
Integrity signals
Registry
Cites
Statistics
Figures
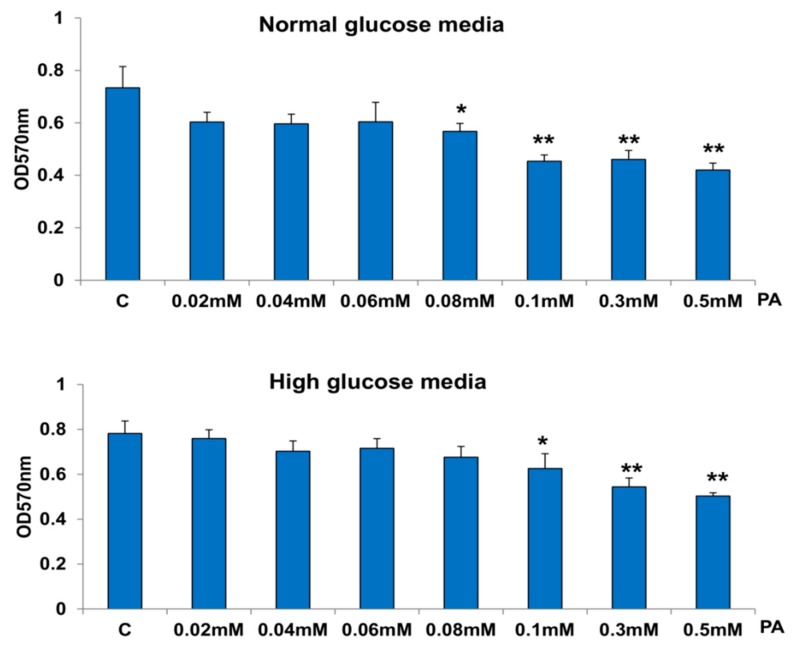
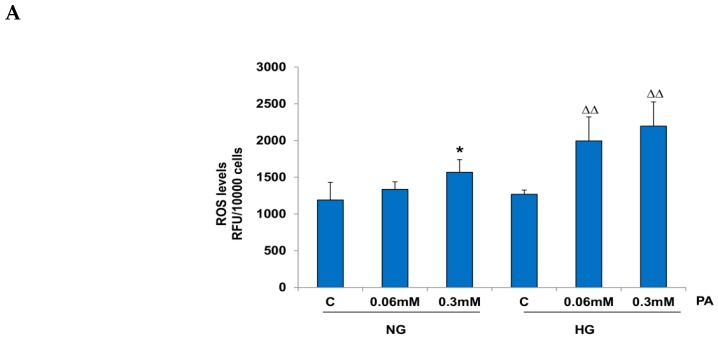
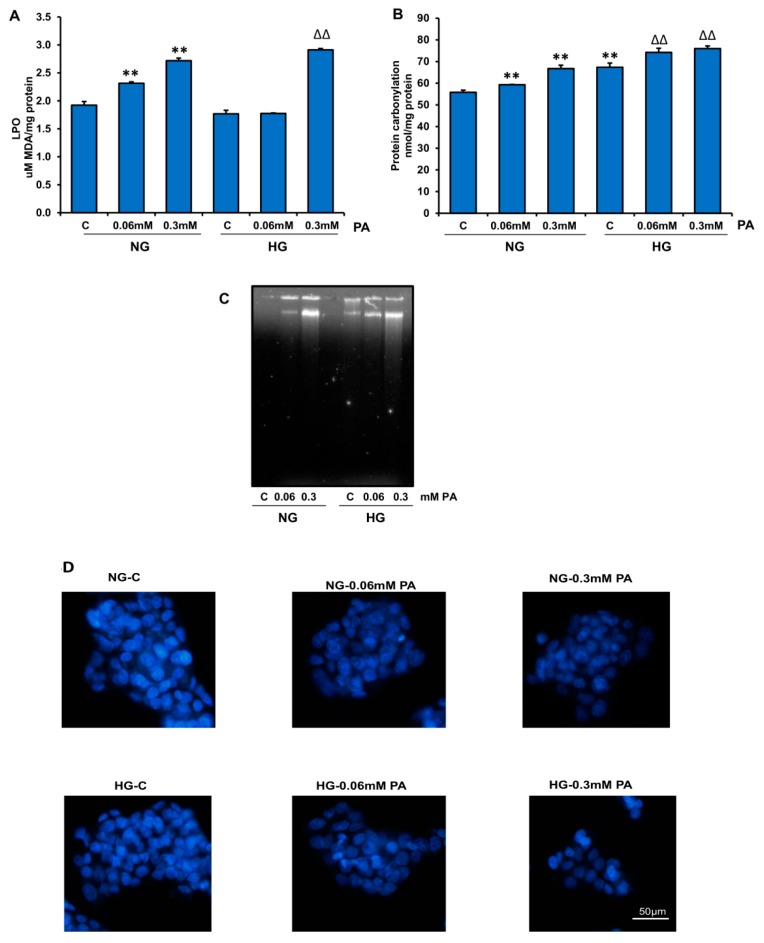
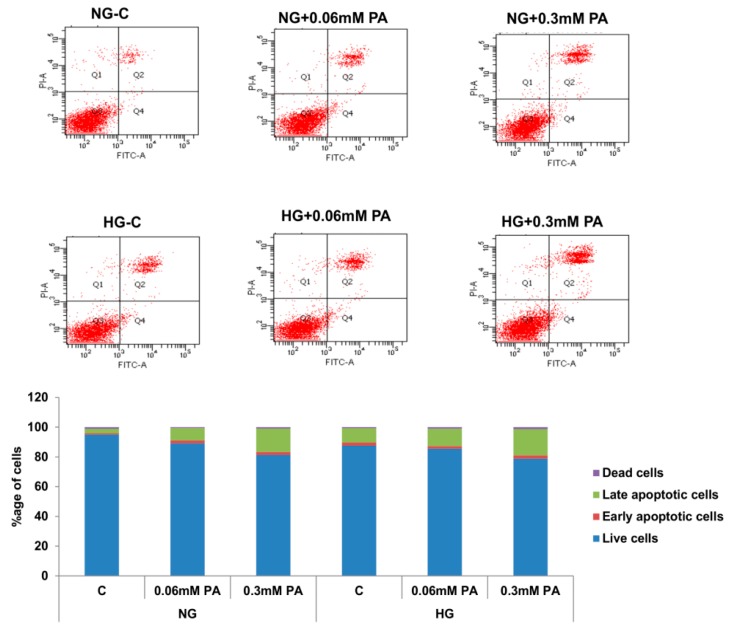
Verification
Claims the paper makes
The claims and statistics of this paper haven’t been checked yet.
Run the check — free, no account needed. It reads the open-access text and checks the sources it cites.
Claims other papers make about this one
Each is checked against this paper’s own text: does it say what the citing paper says it does?
The source backs part of the claim, not all of it — or backs it for a different population, condition or comparison.
In the citing paper
“ROS accumulation triggers damaging cascades: a decrease in mitochondrial membrane potential, activation of caspases 3/7, apoptosis, and ER stress and inflammation via NF-κB [90,152,153,154,155].”
From The HepG2 Cell Line as a Model for Studying Metabolic Dysfunction-Associated Steatotic Liver Disease (2026) · cites this paper as [90]
Experimental — accuracy not yet measured
Self-check
Percentages, sums and reported differences re-computed from the paper’s own numbers.
The self-check needs the paper’s full text.
Citations
Cites
Raza, H., John, A., & Nemmar, A. (2013) · Cellular Physiology and Biochemistry · doi:10.1159/000350087 · Cited by 47,311
Self-citationMultilineage potential of adult human mesenchymal stem cells
Pittenger, M. F., Mackay, A. M., Beck, S. C., Jaiswal, R. K., Douglas, R., Mosca, J. D., Moorman, M. A., Simonetti, D. W., Craig, S., & Marshak, D. R. (1999) · Science · doi:10.1126/science.284.5411.143 · Cited by 21,052
Habig, W. H., Pabst, M. J., & Jakoby, W. B. (1974) · Journal of Biological Chemistry · doi:10.1016/s0021-9258(19)42083-8 · Cited by 18,509
Studies on the quantitative and qualitative characterization of erythrocyte glutathione peroxidase.
Paglia, D. E., & Valentine, W. N. (1967) · PubMed · Cited by 10,776
Biochemistry and molecular cell biology of diabetic complications
Brownlee, M. (2001) · Nature · doi:10.1038/414813a · Cited by 9,107
Xu, H., Barnes, G. T., Yang, Q., Tan, G., Yang, D., Chou, C. J., Sole, J., Nichols, A., Ross, J. S., Tartaglia, L. A., et al. (2003) · Journal of Clinical Investigation · doi:10.1172/jci200319451 · Cited by 6,760
Increased oxidative stress in obesity and its impact on metabolic syndrome
Furukawa, S., Fujita, T., Shimabukuro, M., Iwaki, M., Yamada, Y., Nakajima, Y., Nakayama, O., Makishima, M., Matsuda, M., & Shimomura, I. (2004) · Journal of Clinical Investigation · doi:10.1172/jci21625 · Cited by 5,508
Endoplasmic reticulum stress and the inflammatory basis of metabolic disease
Hotamisligil, G. S. (2010) · Cell · doi:10.1016/j.cell.2010.02.034 · Cited by 2,802
Inoguchi, T., Li, P., Umeda, F., Yu, H. Y., Kakimoto, M., Imamura, M., Aoki, T., Etoh, T., Hashimoto, T., Naruse, M., et al. (2000) · Diabetes · doi:10.2337/diabetes.49.11.1939 · Cited by 1,577
Assay of glutathione reductase in crude tissue homogenates using 5,5′-dithiobis(2-nitrobenzoic acid)
Smith, I. K., Vierheller, T. L., & Thorne, C. A. (1988) · Analytical Biochemistry · doi:10.1016/0003-2697(88)90564-7 · Cited by 1,342
Glucolipotoxicity: fuel excess and β-cell dysfunction
Poitout, V., & Robertson, R. P. (2008) · Endocrine Reviews · doi:10.1210/er.2007-0023 · Cited by 1,092
β-Cell Glucose toxicity, lipotoxicity, and chronic oxidative stress in type 2 diabetes.
Robertson, R. P., Harmon, J., Tran, P. O. T., & Poitout, V. (2004) · Diabetes · doi:10.2337/diabetes.53.2007.s119 · Cited by 914
A rapid method for assaying the metabolism of 7-ethoxyresorufin by microsomal subcellular fractions
Pohl, R. J., & Fouts, J. R. (1980) · Analytical Biochemistry · doi:10.1016/0003-2697(80)90505-9 · Cited by 817
Groop, L. C., Bonadonna, R. C., DelPrato, S., Ratheiser, K., Zyck, K., Ferrannini, E., & DeFronzo, R. A. (1989) · Journal of Clinical Investigation · doi:10.1172/jci114142 · Cited by 812
Ricchi, M., Odoardi, M. R., Carulli, L., Anzivino, C., Ballestri, S., Pinetti, A., Fantoni, L. I., Marra, F., Bertolotti, M., Banni, S., et al. (2009) · Journal of Gastroenterology and Hepatology · doi:10.1111/j.1440-1746.2008.05733.x · Cited by 670
Maedler, K., Oberholzer, J., Bucher, P., Spinas, G. A., & Donath, M. Y. (2003) · Diabetes · doi:10.2337/diabetes.52.3.726 · Cited by 552
Nakamura, S., Takamura, T., Matsuzawa-Nagata, N., Takayama, H., Misu, H., Noda, H., Nabemoto, S., Kurita, S., Ota, T., Ando, H., et al. (2009) · Journal of Biological Chemistry · doi:10.1074/jbc.m901488200 · Cited by 426
Birch‐Machin, M. A., & Turnbull, D. M. (2001) · Methods in cell biology · doi:10.1016/s0091-679x(01)65006-4 · Cited by 367
Fatty acid composition of serum lipids predicts the development of the metabolic syndrome in men
Warensjö, E., Risérus, U., & Vessby, B. (2005) · Diabetologia · doi:10.1007/s00125-005-1897-x · Cited by 344
Mei, S., Ni, H., Manley, S., Bockus, A. B., Kassel, K. M., Luyendyk, J. P., Copple, B. L., & Ding, W. (2011) · Journal of Pharmacology and Experimental Therapeutics · doi:10.1124/jpet.111.184341 · Cited by 325
Insulin resistance in type 2 diabetes: role of fatty acids
Arner, P. (2002) · Diabetes/Metabolism Research and Reviews · doi:10.1002/dmrr.254 · Cited by 324
GROOP, L. C., SALORANTA, C., SHANK, M., BONADONNA, R. C., FERRANNINI, E., & DEFRONZO, R. A. (1991) · The Journal of Clinical Endocrinology & Metabolism · doi:10.1210/jcem-72-1-96 · Cited by 312
Mitochondria-derived ROS activate AMP-activated protein kinase (AMPK) indirectly
Hinchy, E. C., Gruszczyk, A. V., Willows, R., Navaratnam, N., Hall, A. R., Bates, G., Bright, T. P., Krieg, T., Carling, D., & Murphy, M. P. (2018) · Journal of Biological Chemistry · doi:10.1074/jbc.ra118.002579 · Cited by 302
Brookheart, R. T., Michel, C. I., & Schaffer, J. E. (2009) · Cell Metabolism · doi:10.1016/j.cmet.2009.03.011 · Cited by 279
Zhang, Z., Liew, C. W., Handy, D. E., Zhang, Y., Leopold, J. A., Hu, J., Guo, L., Kulkarni, R. N., Loscalzo, J., & Stanton, R. C. (2010) · The FASEB Journal · doi:10.1096/fj.09-136572 · Cited by 226
Nerurkar, P. V., Park, S. S., Thomas, P. E., Nims, R. W., & Lubet, R. A. (1993) · Biochemical Pharmacology · doi:10.1016/0006-2952(93)90504-p · Cited by 225
Hirabara, S. M., Curi, R., & Maechler, P. (2010) · Journal of Cellular Physiology · doi:10.1002/jcp.21936 · Cited by 215
Czygan, P., Greim, H. A., Garro, A. J., Hutterer, F., Schaffner, F., Pópper, H., Rosenthal, O., & Cooper, D. Y. (1973) · PubMed · Cited by 211
Fatty acids and glucolipotoxicity in the pathogenesis of Type 2 diabetes
Cnop, M. (2008) · Biochemical Society Transactions · doi:10.1042/bst0360348 · Cited by 207
Raza, H., Prabu, S. K., Robin, M.-A., & Avadhani, N. G. (2004) · Diabetes · doi:10.2337/diabetes.53.1.185 · Cited by 186
Self-citationLipid oversupply, selective insulin resistance, and lipotoxicity: Molecular mechanisms
Chavez, J. A., & Summers, S. A. (2009) · Biochimica et Biophysica Acta (BBA) - Molecular and Cell Biology of Lipids · doi:10.1016/j.bbalip.2009.09.015 · Cited by 170
Palmitate-Induced Apoptosis in Cultured Bovine Retinal Pericytes
Cacicedo, J. M., Benjachareowong, S., Chou, E. L., Ruderman, N. B., & Ido, Y. (2005) · Diabetes · doi:10.2337/diabetes.54.6.1838 · Cited by 163
Alnahdi, A., John, A., & Raza, H. (2017) · Oxidative Medicine and Cellular Longevity · doi:10.1155/2017/7054272 · Cited by 155
Self-citationWang, R. W., Newton, D. J., Scheri, T. D., & Lu, A. Y. H. (1997) · PubMed · Cited by 141
Lindholm, C. R., Ertel, R. L., Bauwens, J. D., Schmuck, E. G., Mulligan, J. D., & Saupe, K. W. (2013) · Journal of Physiology and Biochemistry · doi:10.1007/s13105-012-0199-2 · Cited by 136
Mir, S. U. R., George, N. M., Zahoor, L., Harms, R. Z., Guinn, Z. P., & Sarvetnick, N. (2014) · Journal of Biological Chemistry · doi:10.1074/jbc.m114.605345 · Cited by 132
Li, H., Min, Q., Ouyang, C., Lee, J., He, C., Zou, M., & Xie, Z. (2014) · Biochimica et Biophysica Acta (BBA) - Molecular Basis of Disease · doi:10.1016/j.bbadis.2014.07.002 · Cited by 121
Raza, H., & John, A. (2012) · International Journal of Molecular Sciences · doi:10.3390/ijms13055751 · Cited by 101
Self-citationLipotoxicity in HepG2 cells triggered by free fatty acids.
(2011) · PubMed Central · Cited by 94
García‐Ruíz, I., Solís‐Muñoz, P., Fernández-Moreira, D., Muñoz‐Yagüe, T., & Solis-Herruzo, J. A. (2014) · Disease Models & Mechanisms · doi:10.1242/dmm.018234 · Cited by 83
Palmitic acid induces autophagy in hepatocytes via JNK2 activation
Tu, Q., Zheng, R., Li, J., Hu, L., Chang, Y., Li, L., Li, M., Wang, R., Huang, D., Wu, M., et al. (2014) · Acta Pharmacologica Sinica · doi:10.1038/aps.2013.170 · Cited by 81
Kumar, B., Kowluru, A., & Kowluru, R. A. (2015) · Investigative Ophthalmology & Visual Science · doi:10.1167/iovs.15-16466 · Cited by 73
Involvement of mtDNA damage in free fatty acid-induced apoptosis
Grishko, V. I., Rachek, L. I., Musiyenko, S. I., LeDoux, S. P., & Wilson, G. L. (2004) · Free Radical Biology and Medicine · doi:10.1016/j.freeradbiomed.2004.11.023 · Cited by 66
Fu, J., Cui, Q., Yang, B., Hou, Y., Wang, H., Xu, Y., Wang, D., Zhang, Q., & Pi, J. (2016) · Food and Chemical Toxicology · doi:10.1016/j.fct.2016.12.016 · Cited by 60
Raza, H., John, A., & Shafarin, J. (2016) · PLoS ONE · doi:10.1371/journal.pone.0159750 · Cited by 58
Self-citationIori, E., Vinci, B., Murphy, E. G., Marescotti, M. C., Avogaro, A., & Ahluwalia, A. D. (2012) · PLoS ONE · doi:10.1371/journal.pone.0034704 · Cited by 56
Effects of Antioxidants in Reducing Accumulation of Fat in Hepatocyte
Yang, J., Shin, J., Seo, S., Kim, S., Lee, S. H., & Shin, E. (2018) · International Journal of Molecular Sciences · doi:10.3390/ijms19092563 · Cited by 56
Zhao, L., Guo, X., Wang, O., Zhang, H., Wang, Y., Zhou, F. L., Liu, J., & Ji, B. (2016) · Molecular Nutrition & Food Research · doi:10.1002/mnfr.201500635 · Cited by 55
Glucose and palmitate uncouple AMPK from autophagy in human aortic endothelial cells
Weikel, K., Cacicedo, J. M., Ruderman, N. B., & Ido, Y. (2014) · American Journal of Physiology-Cell Physiology · doi:10.1152/ajpcell.00265.2014 · Cited by 53
Raza, H., John, A., & Howarth, F. (2012) · International Journal of Molecular Sciences · doi:10.3390/ijms131216241 · Cited by 47
Self-citationBarlow, J., Jensen, V. H., Jastroch, M., & Affourtit, C. (2016) · Biochemical Journal · doi:10.1042/bj20151080 · Cited by 45
Raza, H., John, A., & Shafarin, J. (2014) · PLoS ONE · doi:10.1371/journal.pone.0103379 · Cited by 43
Self-citationAlnahdi, A., John, A., & Raza, H. (2018) · Cellular Physiology and Biochemistry · doi:10.1159/000495200 · Cited by 43
Self-citationHu, N., Hu, M., Duan, R., Liu, C., Guo, H., Zhang, M., Yu, Y., Wang, X., Liu, L., & Liu, X. (2014) · Journal of Pharmacological Sciences · doi:10.1254/jphs.13212fp · Cited by 33
Increased Metabolic Stress in Zucker Diabetic Fatty Rat Kidney and Pancreas
Raza, H., John, A., & Howarth, F. C. (2013) · Cellular Physiology and Biochemistry · doi:10.1159/000356597 · Cited by 27
Self-citationDing, W. (2014) · American Journal of Physiology-Cell Physiology · doi:10.1152/ajpcell.00375.2014 · Cited by 15
Raza, H., John, A., Shafarin, J., & Howarth, F. C. (2016) · Physiological Reports · doi:10.14814/phy2.12751 · Cited by 15
Self-citationStreptozotocin-induced molecular and metabolic targets in pancreatic beta-cell toxicity
Raza, H., Al-Nahdi, A. M., & John, A. (2018) · Hamdan Medical Journal · doi:10.4103/hmj.hmj_54_18 · Cited by 9
Self-citation
Cited by
Sorted by citations
Zhang, Z., Huang, Q., Zhao, D., Lian, F., Li, X., & Qi, W. (2023) · Frontiers in Endocrinology · doi:10.3389/fendo.2023.1112363 · Cited by 236
Lipke, K., Kubis-Kubiak, A., & Piwowar, A. (2022) · Cells · doi:10.3390/cells11050844 · Cited by 164
Pancreatic Beta-cell Dysfunction in Type 2 Diabetes
Khin, P. P., Lee, J. H., & Jun, H. (2023) · European Journal of Inflammation · doi:10.1177/1721727x231154152 · Cited by 127
Wang, Y.-F., Chang, Y.-Y., Zhang, X., Gao, M., Zhang, Q., Li, X., Zhang, L., & Yao, W.-F. (2022) · Phytomedicine · doi:10.1016/j.phymed.2022.154020 · Cited by 72
Chang, T., Chi, M., Chiang, Y., Lin, C., Fang, M.-L., Lee, C., Liu, J., & Kou, Y. R. (2024) · International Journal of Biological Sciences · doi:10.7150/ijbs.85443 · Cited by 70
Metadata
- Authors
- Alnahdi, A., John, A., & Raza, H.
- Affiliations
- United Arab Emirates University (AE)
- Corresponding author
- Raza, Haider
- Venue
- Nutrients
- Publisher
- MDPI AG
- Published
- 2019-08-22
- Volume
- 11
- Issue
- 9
- Pages
- 1979
- ISSN
- 2072-6643 (ISSN-L)
- PMC
- PMC6770774
- OpenAlex
- W2969456983
- Cited by
- 134
- References
- 60
- Citations by year
- 2026: 13 · 2025: 24 · 2024: 26 · 2023: 16 · 2022: 26 · 2021: 22 · 2020: 6 · 2019: 1
- FWCI
- 4.55
- Type
- journal article
- Language
- en
- Open access
- gold
- dx.doi.org
- Licence
- Locations
- Nutrients (publishedVersion, cc-by)
- Europe PMC (PubMed Central) (publishedVersion, cc-by)
- PubMed Central (publishedVersion, cc-by)
- PubMed (publishedVersion)
- DOAJ (DOAJ: Directory of Open Access Journals) (submittedVersion, cc-by-sa)
- Funders
- Sheikh Hamdan Bin Rashid Al Maktoum Award for Medical Sciences (MRG-18/2013-2014)
- Topics
- Life Sciences › Biochemistry, Genetics and Molecular Biology › Molecular Biology › Mitochondrial Function and Pathology
- Life Sciences › Biochemistry, Genetics and Molecular Biology › Molecular Biology › Metabolism, Diabetes, and Cancer
- Health Sciences › Medicine › Endocrinology, Diabetes and Metabolism › Diet, Metabolism, and Disease
- Keywords
- palmitic acid, glucolipotoxicity, high glucose, oxidative stress, apoptosis, mitochondrial dysfunction, HepG2 cells, hepatocytes, redox stress, mitochondrial membrane potential, antioxidant adaptation, autophagy, diabesity, saturated fatty acids
- MeSH terms
- Autophagy, Energy Metabolism, Glucose, Humans, Mitochondria, Liver, Signal Transduction, NF-kappa B, Apoptosis, Oxidative Stress, Inflammation Mediators, Palmitic Acid, Hepatocytes, AMP-Activated Protein Kinases, Hep G2 Cells, TOR Serine-Threonine Kinases
About these checks
Registry, retraction, Cites and statistics results are computed, not judged, with one exception: a printed reference that no index lists is read once by a model before it counts as a citation error. Claims are extracted by a model and kept only when their quote appears verbatim in the text; each cited source is then checked, with a model’s help, for whether it says what the claim relies on. Those verdicts can be wrong — read the claim’s quote and the cited source before relying on one.
Statistics and arithmetic are recomputed, not judged.
Confidence bands are shown only for fields calibrated on our annotated test set. None is calibrated yet, so no band is shown.
What counts as a claim ›How we measure confidence ›How we check this ›
Are you an author, or do you see a problem with this page? Request a review
