

The DOI matches its Crossref record; 5 of the 5 references it cites were found in a registry or an index.
Long-Term Fasting-Induced Ketosis in 1610 Subjects: Metabolic Regulation and Safety
Abstract
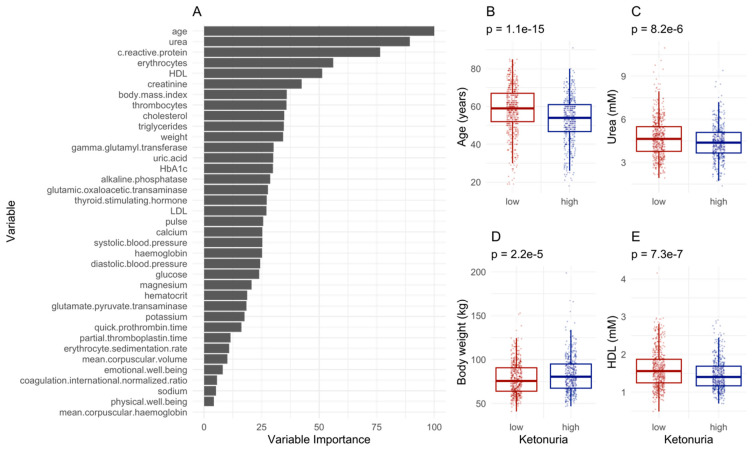
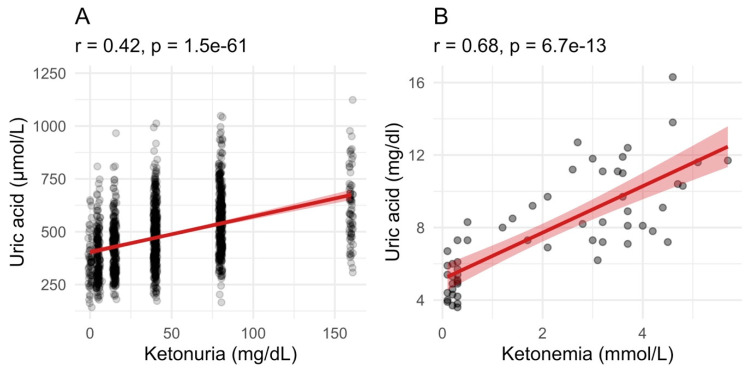
Background: There is a growing consensus that fasting-induced ketosis has beneficial effects on human physiology. Despite these compelling benefits, fasting-induced ketosis raises concerns in some clinicians because it is often inappropriately compared with the pathologic uncontrolled ketone production in diabetic ketoacidosis. The determinants of the inter-individual differences in the intensity of ketosis during long-term fasting is unknown. Methods: We monitored daily variations in fasting ketonemia, as well as ketonuria, which is less invasive, in a large cohort of 1610 subjects, fasting between 4 and 21 days with the Buchinger Wilhelmi program, minimally supplemented with ~75–250 kcal (daily fruit juice, vegetable soup, and honey). Results: Ketonuria was detected in more than 95% of fasting subjects from day 4 onwards. Subjects consuming only soups, without fruit juice or honey, exhibited reduced caloric intake (72 kcal instead of 236 kcal) and carbohydrate intake (15.6 g instead of 56.5 g), leading to more intense ketonuria. Participants with high ketonuria were, in the majority, males, young, had a higher body weight, and had lower HDL-C and urea values. They had a larger decrease in blood glucose, glycated haemoglobin levels, body weight, and waist circumference. Furthermore, in the high-ketonuria group, a larger increase in blood uric acid concentration was observed. Conclusion: Our study showed that long-term fasting triggered ketosis, never reaching pathological levels, and that ketosis is influenced by age, gender, health, and the level of physical activity. Furthermore, it is modulated but not suppressed by minimal carbohydrate intake. Our study paves the way for better understanding how supplementation can modulate the therapeutic effects and tolerability of long-term fasting.
Overview
The claims and statistics of this paper haven’t been checked yet.
Run the check — free, no account needed. It reads the open-access text and checks the sources it cites.
Integrity signals
Registry
Cites
Statistics
Figures
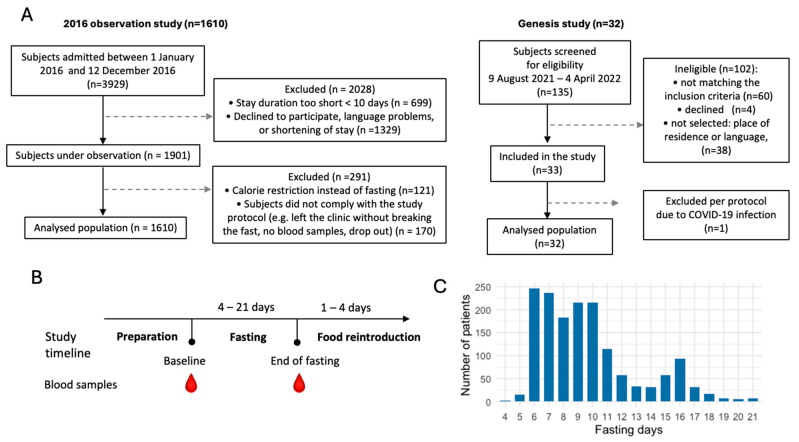
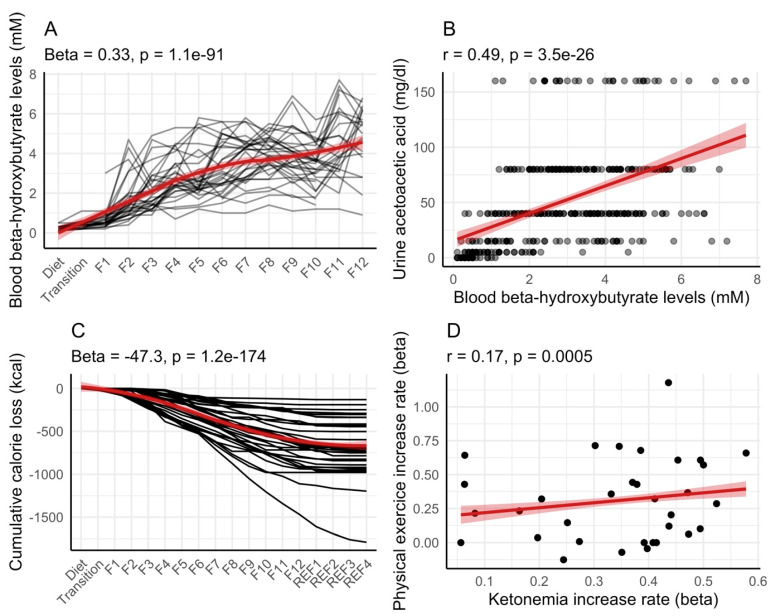
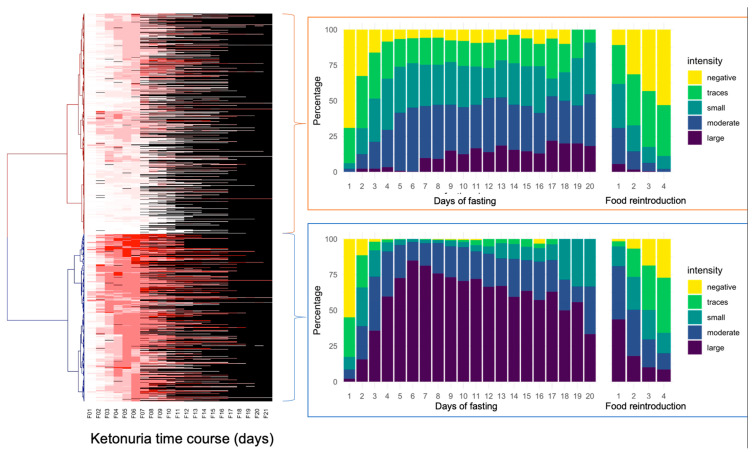
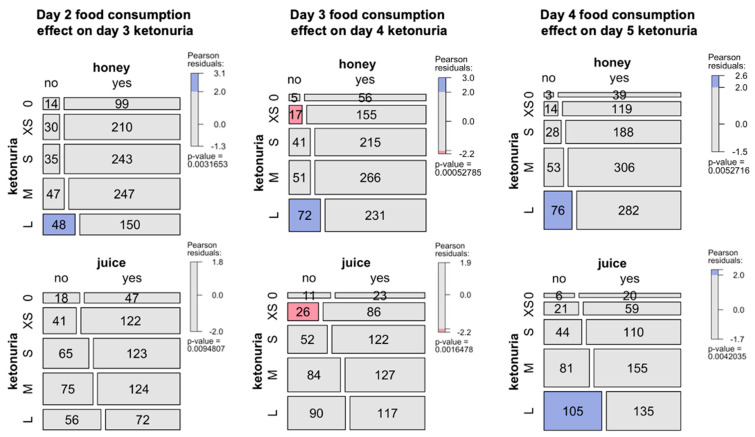
Verification
Claims the paper makes
The claims and statistics of this paper haven’t been checked yet.
Run the check — free, no account needed. It reads the open-access text and checks the sources it cites.
Claims other papers make about this one
Each is checked against this paper’s own text: does it say what the citing paper says it does?
The cited source says what the claim attributes to it.
In the citing paper
“Fasting or severe energy restriction can also induce ketosis [150].”
From International Society of Sports Nutrition position stand: diets for body weight reduction (2026) · cites this paper as [150]
Self-check
Percentages, sums and reported differences re-computed from the paper’s own numbers.
The self-check needs the paper’s full text.
Citations
Cites
The WHO-5 well-being index: A systematic review of the literature
Topp, C. W., Østergaard, S. D., Søndergaard, S., & Bech, P. (2015) · Psychotherapy and Psychosomatics · doi:10.1159/000376585 · Cited by 4,708
The ketone metabolite β-hydroxybutyrate blocks NLRP3 inflammasome-mediated inflammatory disease
Youm, Y.-H., Nguyen, K. Y., Grant, R. W., Goldberg, E. L., Bodogai, M., Kim, D., D'Agostino, D., Planavsky, N., Lupfer, C., Kanneganti, T. D., et al. (2015) · Nature Medicine · doi:10.1038/nm.3804 · Cited by 2,172
Effects of intermittent fasting on health, aging, and disease
de Cabo, R., & Mattson, M. P. (2019) · New England Journal of Medicine · doi:10.1056/nejmra1905136 · Cited by 1,605
Regulation of Ketone Body Metabolism and the Role of PPARα
Grabacka, M., Pierzchalska, M., Dean, M., & Reiss, K. (2016) · International Journal of Molecular Sciences · doi:10.3390/ijms17122093 · Cited by 305
Marosi, K., Kim, S. W., Moehl, K., Scheibye‐Knudsen, M., Cheng, A., Cutler, R., Camandola, S., & Mattson, M. P. (2016) · Journal of Neurochemistry · doi:10.1111/jnc.13868 · Cited by 242
Research works printed but not linked: 40
- Muller, 2001, Fasting followed by vegetarian diet in patients with rheumatoid arthritis: A systematic review, Scand. J. Rheumatol., 30, 1, 10.1080/030097401750065256 · DOI
- Grundler, 2020, Unravelling the health effects of fasting: A long road from obesity treatment to healthy life span increase and improved cognition, Ann. Med., 52, 147, 10.1080/07853890.2020.1770849 · DOI
- de Toledo, F.W., Grundler, F., Bergouignan, A., Drinda, S., and Michalsen, A. (2019). Safety, health improvement and well-being during a 4 to 21-day fasting period in an observational study including 1422 subjects. PLoS ONE, 14. · DOI
- Furmli, 2018, Therapeutic use of intermittent fasting for people with type 2 diabetes as an alternative to insulin, BMJ Case Rep., 2018, 1
- Borchgrevink, 1991, Controlled trial of fasting and one-year vegetarian diet in rheumatoid arthritis, Lancet, 338, 899, 10.1016/0140-6736(91)91770-U · DOI
- Grundler, 2020, Interplay between oxidative damage, the redox status, and metabolic biomarkers during long-term fasting, Food Chem. Toxicol., 145, 111701, 10.1016/j.fct.2020.111701 · DOI
- Ducarmon, 2023, Remodelling of the intestinal ecosystem during caloric restriction and fasting, Trends Microbiol., 31, 832, 10.1016/j.tim.2023.02.009 · DOI
- Cheng, 2014, Prolonged fasting reduces IGF-1/PKA to promote hematopoietic-stem-cell-based regeneration and reverse immunosuppression, Cell Stem Cell, 14, 810, 10.1016/j.stem.2014.04.014 · DOI
- Williams, 2023, Intestinal epithelial autophagy is required for the regenerative benefit of calorie restriction, Am. J. Physiol. Liver Physiol., 324, G354
- Newsholme, E., and Leech, A. (2011). Functional Biochemistry in Health and Disease, John Wiley & Sons.
- Chen, J., Li, Z., Zhang, Y., Zhang, X., Zhang, S., Liu, Z., Yuan, H., Pang, X., Liu, Y., and Tao, W. (2022). Mechanism of reduced muscle atrophy via ketone body (D)-3-hydroxybutyrate. Cell Biosci., 12. · DOI
- Puchalska, 2017, Multi-dimensional Roles of Ketone Bodies in Fuel Metabolism, Signaling, and Therapeutics, Cell Metab., 25, 262, 10.1016/j.cmet.2016.12.022 · DOI
- Shimazu, 2013, Suppression of oxidative stress by beta-hydroxybutyrate, an endogenous histone deacetylase inhibitor, Science, 339, 211, 10.1126/science.1227166 · DOI · Paper page
- Wang, L., Chen, P., and Xiao, W. (2021). β-hydroxybutyrate as an Anti-Aging Metabolite. Nutrients, 13. · DOI
- Kimura, 2011, Short-chain fatty acids and ketones directly regulate sympathetic nervous system via G protein-coupled receptor 41 (GPR41), Proc. Natl. Acad. Sci. USA, 108, 8030, 10.1073/pnas.1016088108 · DOI · Paper page
- Gormsen, 2017, Ketone Body Infusion With 3-Hydroxybutyrate Reduces Myocardial Glucose Uptake and Increases Blood Flow in Humans: A Positron Emission Tomography Study, J. Am. Hear. Assoc., 6, e005066, 10.1161/JAHA.116.005066 · DOI
- Ruppert, 2021, RNA sequencing reveals niche gene expression effects of beta-hydroxybutyrate in primary myotubes, Life Sci. Alliance, 4, e202101037, 10.26508/lsa.202101037 · DOI
- Dhatariya, 2020, Diabetic ketoacidosis, Nat. Rev. Dis. Primers, 6, 40, 10.1038/s41572-020-0165-1 · DOI · Paper page
- Puttanna, 2014, Diabetic ketoacidosis in type 2 diabetes mellitus, Pr. Diabetes, 31, 155
- Palmer, 2021, Starvation Ketosis and the Kidney, Am. J. Nephrol., 52, 467, 10.1159/000517305 · DOI
- Balasse, 1975, Inhibition of ketogenesis by ketone bodies in fasting humans, Metabolism, 24, 999, 10.1016/0026-0495(75)90092-X · DOI
- Steckhan, 2020, Ketosis in patients undergoing medically supervised therapeutic fasting—Results from an observational trial, Eur. J. Clin. Nutr., 74, 43, 10.1038/s41430-020-0694-4 · DOI
- Grundler, 2022, Long-term fasting: Multi-system adaptations in humans (GENESIS) study–A single-arm interventional trial, Front. Nutr., 9, 951000, 10.3389/fnut.2022.951000 · DOI
- Buchinger, 2013, Fasting Therapy–an Expert Panel Update of the 2002 Consensus Guidelines, Complement. Med. Res., 20, 434, 10.1159/000357602 · DOI
- Chertack, 1958, Evaluation of a Nitroprusside Dip Test for Ketone Bodies, J. Am. Med. Assoc., 167, 1621, 10.1001/jama.1958.72990300004010b · DOI
- Sapir, 1975, Renal conservation of ketone bodies during starvation, Metabolism, 24, 23, 10.1016/0026-0495(75)90004-9 · DOI
- Kuhn, 2008, Building predictive models in R using the caret package, J. Stat. Softw., 28, 1, 10.18637/jss.v028.i05 · DOI · Paper page
- Deru, 2021, The Effects of Exercise on beta-Hydroxybutyrate Concentrations over a 36-h Fast: A Randomized Crossover Study, Med. Sci. Sports Exerc., 53, 1987, 10.1249/MSS.0000000000002655 · DOI
- Stubbs, 2017, A Ketone Ester Drink Lowers Human Ghrelin and Appetite, Obesity, 26, 269, 10.1002/oby.22051 · DOI
- Jeitler, M., Lauche, R., Hohmann, C., Choi, K.-E., Schneider, N., Steckhan, N., Rathjens, F., Anheyer, D., Paul, A., and von Scheidt, C. (2022). A Randomized Controlled Trial of Fasting and Lifestyle Modification in Patients with Metabolic Syndrome: Effects on Patient-Reported Outcomes. Nutrients, 14. · DOI
- Cramer, 2014, Predictors of Health Behavior Change After an Integrative Medicine Inpatient Program, Int. J. Behav. Med., 21, 775, 10.1007/s12529-013-9354-6 · DOI
- Fery, 1985, Ketone body production and disposal in diabetic ketosis. A comparison with fasting ketosis, Diabetes, 34, 326, 10.2337/diab.34.4.326 · DOI
- Vining, 1998, A Multicenter Study of the Efficacy of the Ketogenic Diet, Arch. Neurol., 55, 1433, 10.1001/archneur.55.11.1433 · DOI
- Finucane, 2023, Weight loss is proportional to increases in fasting serum beta-hydroxybutyrate concentrations in adults with severe obesity undergoing a meal replacement programme, Hum. Nutr. Metab., 32, 200192, 10.1016/j.hnm.2023.200192 · DOI
- Sapir, 1972, The effect of carbohydrates on ammonium and ketoacid excretion during starvation, J. Clin. Investig., 51, 2093, 10.1172/JCI107016 · DOI
- Berry, 2020, Human postprandial responses to food and potential for precision nutrition, Nat. Med., 26, 964, 10.1038/s41591-020-0934-0 · DOI · Paper page
- Goldfinger, 1965, Renal Retention of Uric Acid Induced by Infusion of Beta-Hydroxybutyrate and Acetoacetate, N. Engl. J. Med., 272, 351, 10.1056/NEJM196502182720705 · DOI
- Ames, 1981, Uric acid provides an antioxidant defense in humans against oxidant- and radical-caused aging and cancer: A hypothesis, Proc. Natl. Acad. Sci. USA, 78, 6858, 10.1073/pnas.78.11.6858 · DOI
- Veskoukis, 2008, Effects of xanthine oxidase inhibition on oxidative stress and swimming performance in rats, Appl. Physiol. Nutr. Metab., 33, 1140, 10.1139/H08-102 · DOI
- Joo, 2010, Ketonuria after Fasting may be Related to the Metabolic Superiority, J. Korean Med. Sci., 25, 1771, 10.3346/jkms.2010.25.12.1771 · DOI
Cited by
Sorted by citations
International Society of Sports Nutrition position stand: diets for body weight reduction
Aragon, A. A., Campbell, B. I., Schoenfeld, B. J., Stout, J. R., Kalman, D., Arciero, P. J., Arent, S. M., Kreider, R. B., Taylor, L. W., Bannock, L., et al. (2026) · Journal of the International Society of Sports Nutrition · doi:10.1080/15502783.2026.2740266
Metadata
- Authors
- Grundler, F., Mesnage, R., Ruppert, P. M. M., Kouretas, D., & Wilhelmi de Toledo, F.
- Affiliations
- Buchinger Wilhelmi Clinic, Wilhelmi-Beck-Straße 27, 88662 Überlingen, Germany
- Department for Biochemistry and Molecular Biology (BMB), University of Southern Denmark, 5230 Odense, Denmark
- Department of Biochemistry-Biotechnology, School of Health Sciences, University of Thessaly, 41500 Larissa, Greece
- Venue
- Nutrients
- Publisher
- MDPI AG
- Published
- 2024-06-13
- Volume
- 16
- Issue
- 12
- Pages
- 1849
- ISSN
- 2072-6643
- PMC
- PMC11206495
- Cited by
- 29
- References
- 5
- Language
- en
- Funders
- Buchinger Wilhelmi Development and Holding GmbH
About these checks
Registry, retraction, Cites and statistics results are computed, not judged, with one exception: a printed reference that no index lists is read once by a model before it counts as a citation error. Claims are extracted by a model and kept only when their quote appears verbatim in the text; each cited source is then checked, with a model’s help, for whether it says what the claim relies on. Those verdicts can be wrong — read the claim’s quote and the cited source before relying on one.
Statistics and arithmetic are recomputed, not judged.
Confidence bands are shown only for fields calibrated on our annotated test set. None is calibrated yet, so no band is shown.
What counts as a claim ›How we measure confidence ›How we check this ›
Are you an author, or do you see a problem with this page? Request a review
