

The DOI matches its Crossref record; 4 of the 4 references it cites were found in a registry or an index.
Harnessing Multi-Source Data and Deep Learning for High-Resolution Land Surface Temperature Gap-Filling Supporting Climate Change Adaptation Activities
Open accessAbstract
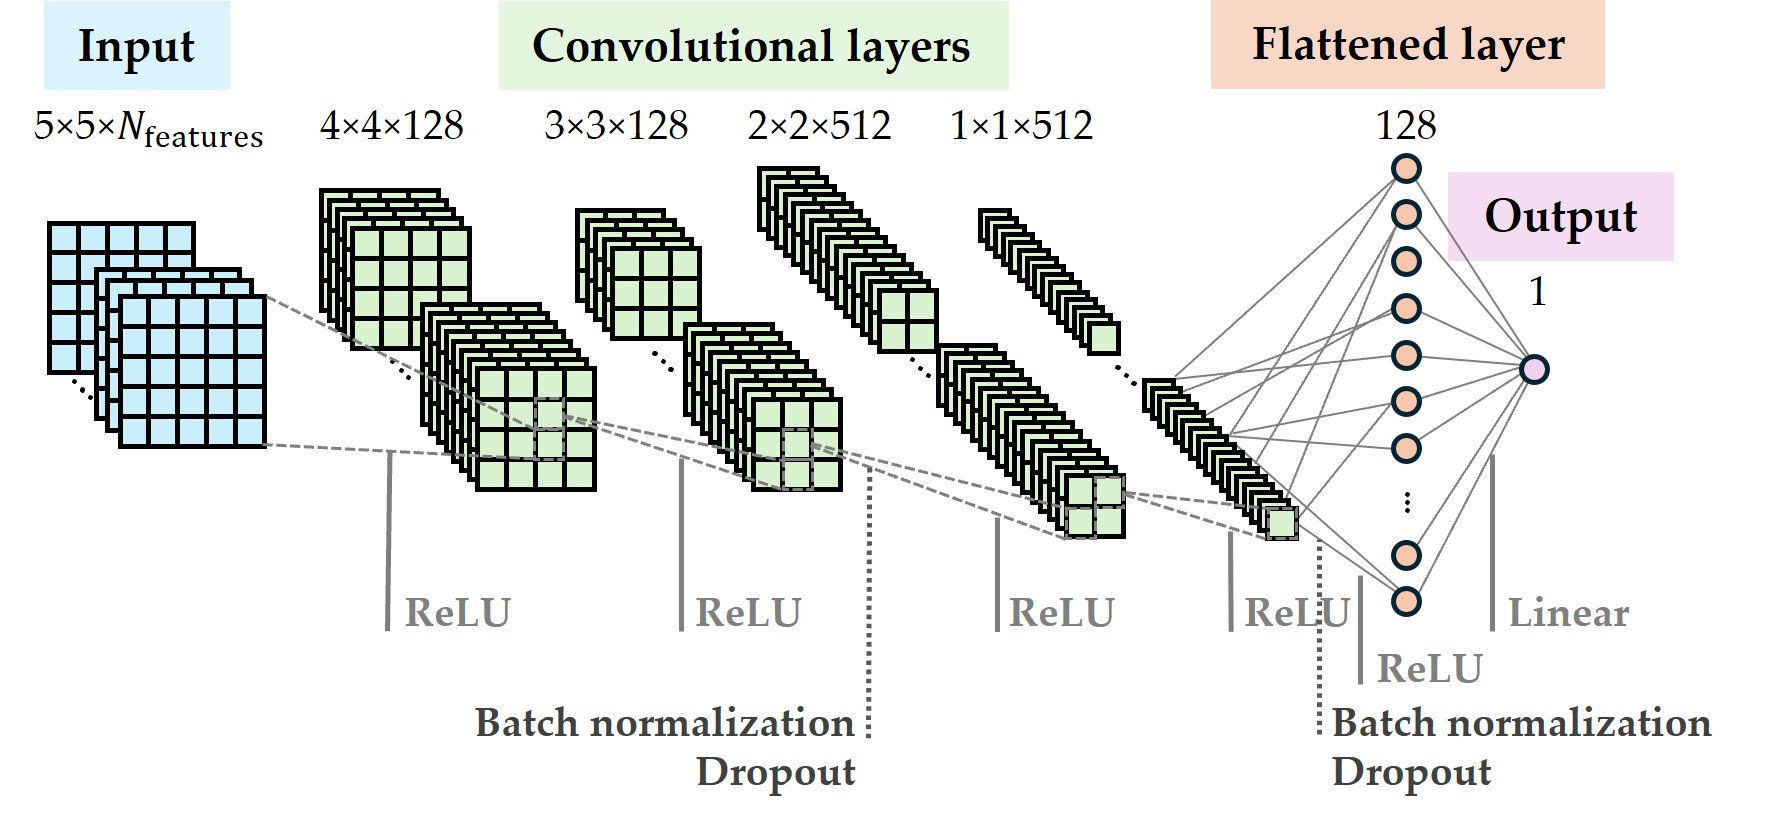
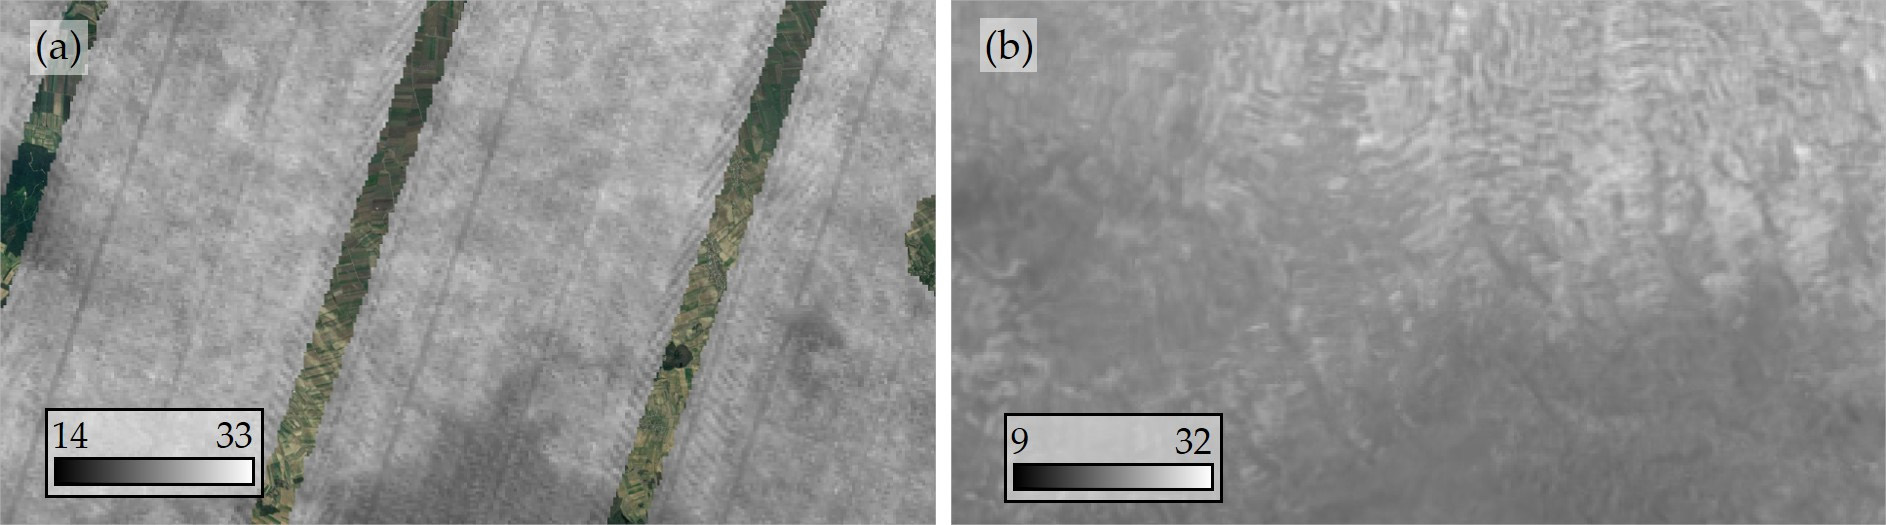
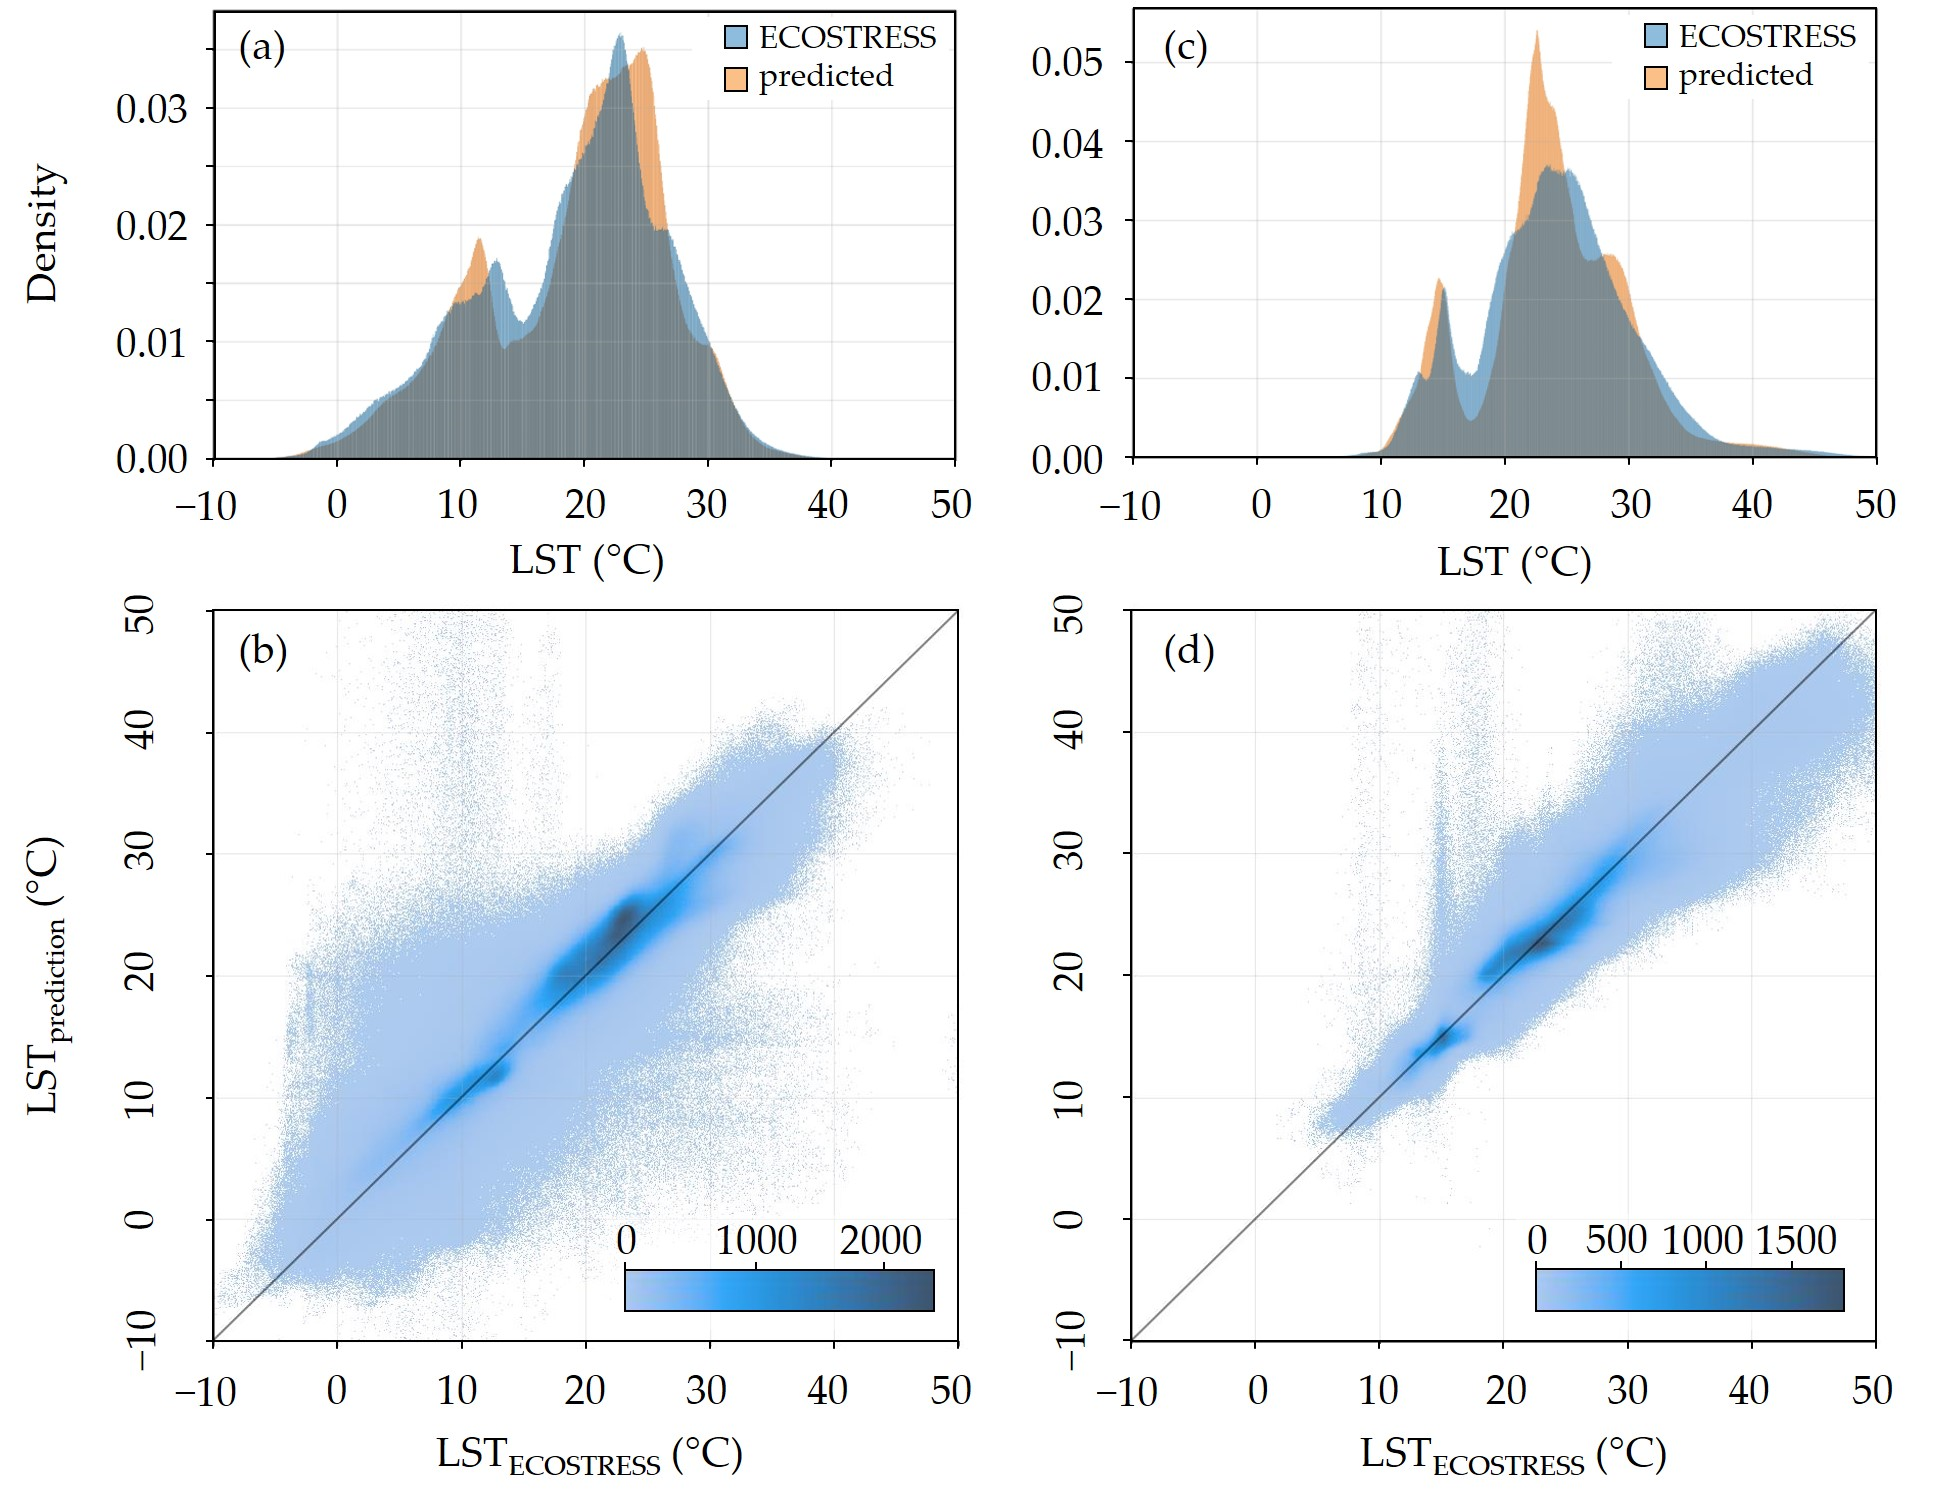
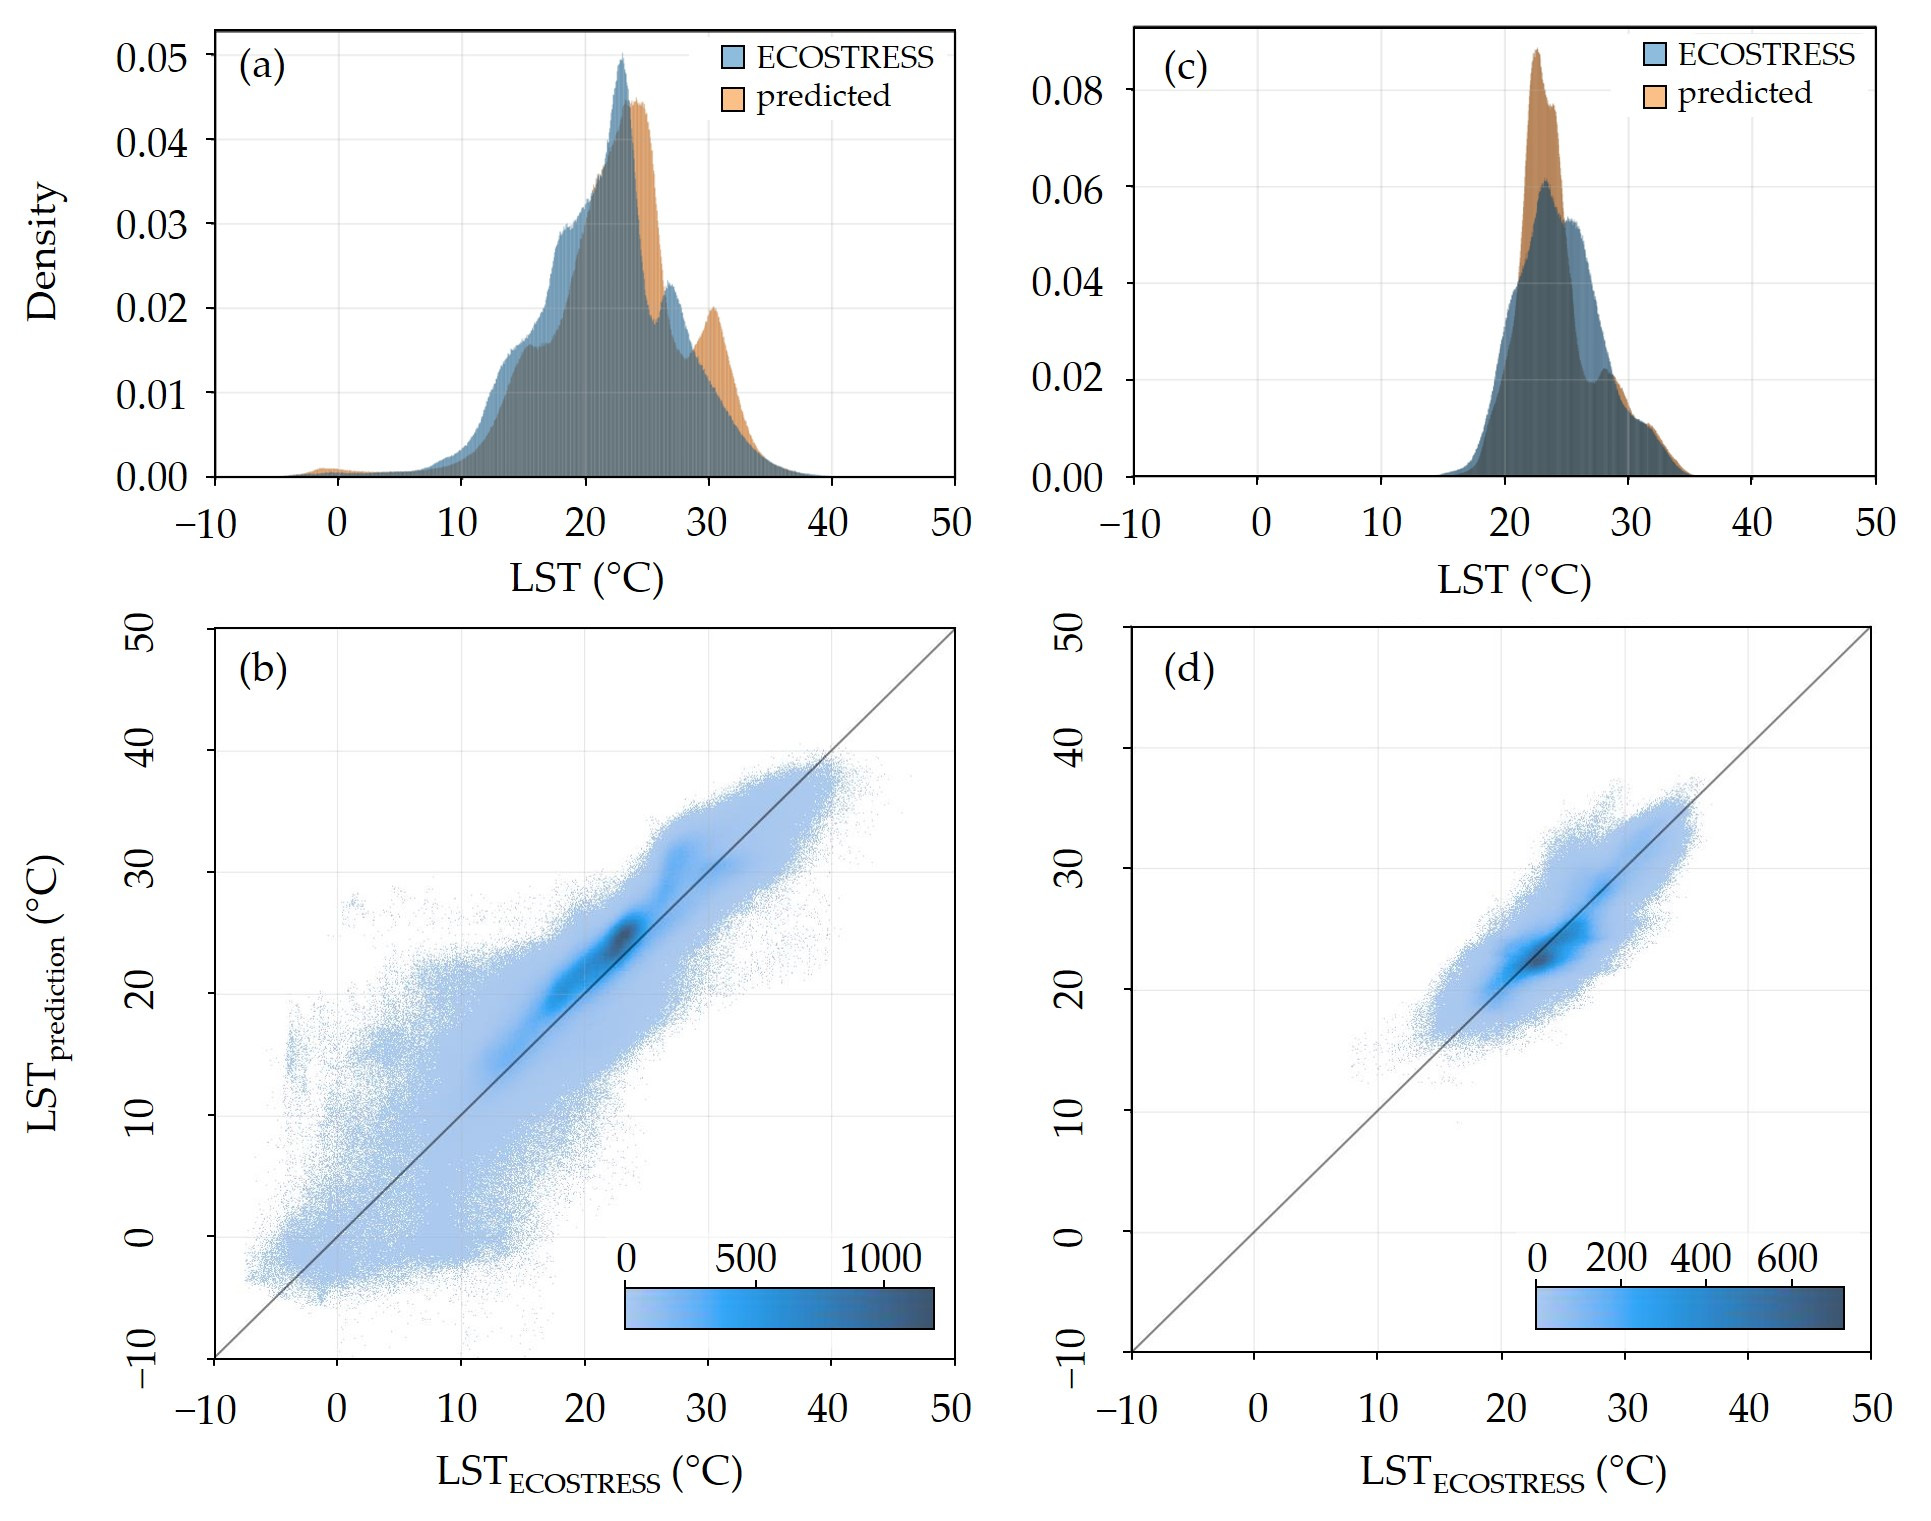
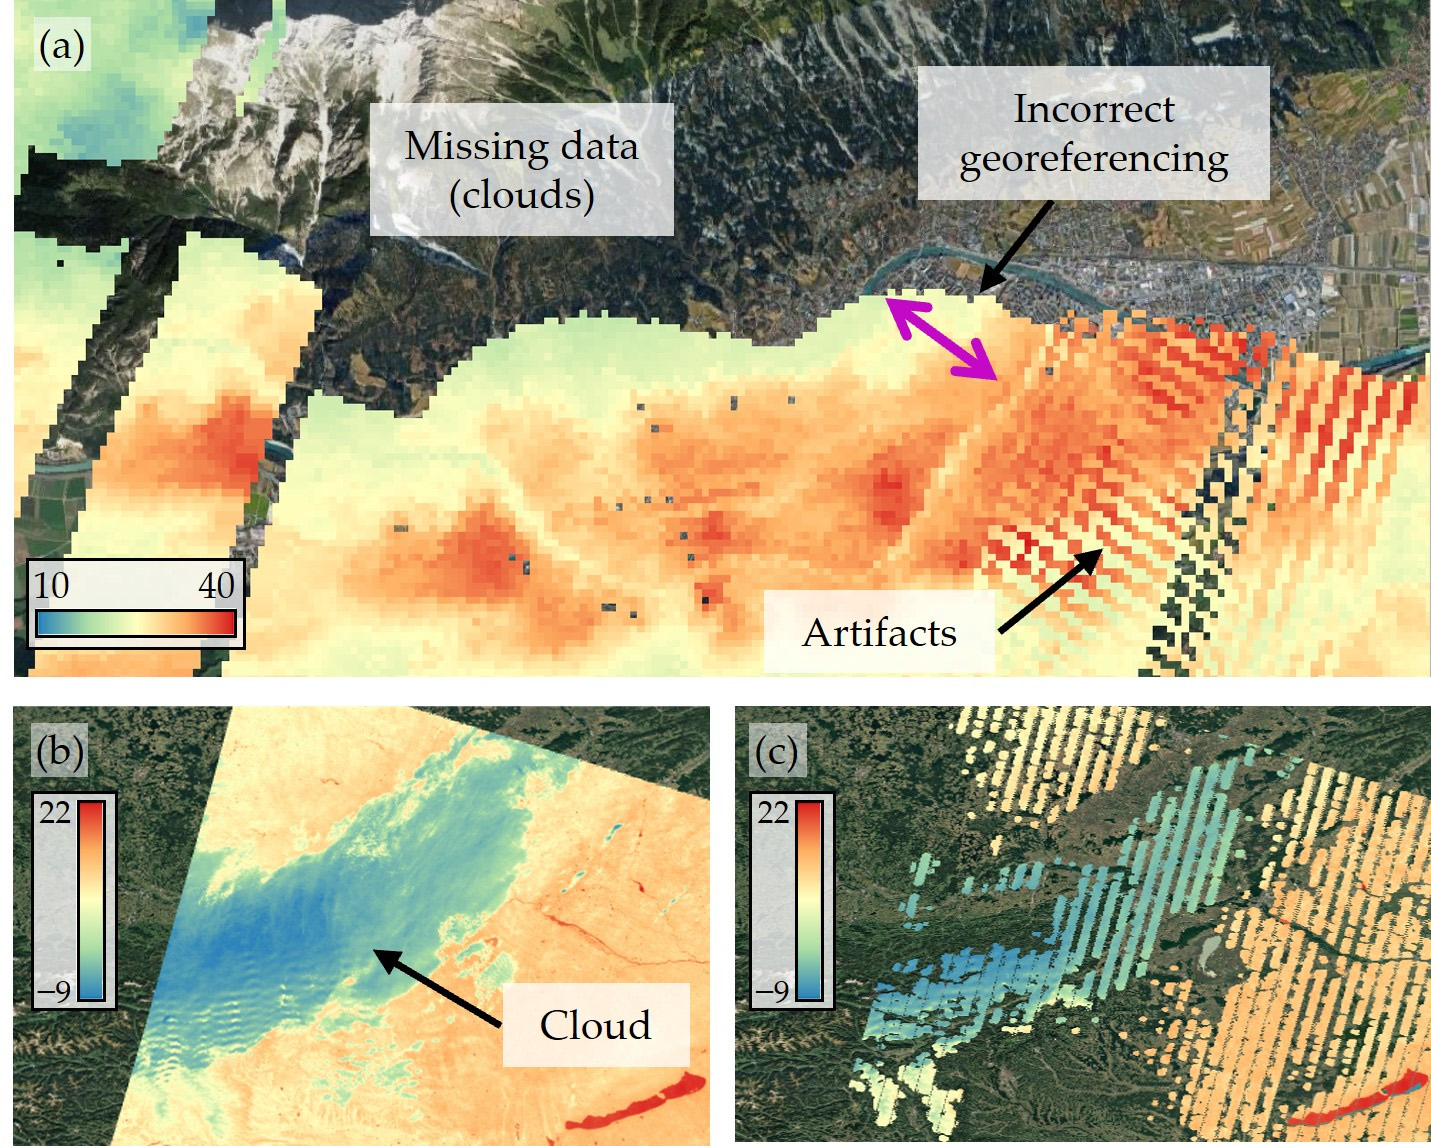
Addressing global warming and adapting to the impacts of climate change is a primary focus of climate change adaptation strategies at both European and national levels. Land surface temperature (LST) is a widely used proxy for investigating climate-change-induced phenomena, providing insights into the surface radiative properties of different land cover types and the impact of urbanization on local climate characteristics. Accurate and continuous estimation across large spatial regions is crucial for the implementation of LST as an essential parameter in climate change mitigation strategies. Here, we propose a deep-learning-based methodology for LST estimation using multi-source data including Sentinel-2 imagery, land cover, and meteorological data. Our approach addresses common challenges in satellite-derived LST data, such as gaps caused by cloud cover, image border limitations, grid-pattern sensor artifacts, and temporal discontinuities due to infrequent sensor overpasses. We develop a regression-based convolutional neural network model, trained on ECOSTRESS (ECOsystem Spaceborne Thermal Radiometer Experiment on Space Station) mission data, which performs pixelwise LST predictions using 5 × 5 image patches, capturing contextual information around each pixel. This method not only preserves ECOSTRESS’s native resolution but also fills data gaps and enhances spatial and temporal coverage. In non-gap areas validated against ground truth ECOSTRESS data, the model achieves LST predictions with at least 80% of all pixel errors falling within a ±3 °C range. Unlike traditional satellite-based techniques, our model leverages high-temporal-resolution meteorological data to capture diurnal variations, allowing for more robust LST predictions across different regions and time periods. The model’s performance demonstrates the potential for integrating LST into urban planning, climate resilience strategies, and near-real-time heat stress monitoring, providing a valuable resource to assess and visualize the impact of urban development and land use and land cover changes.
Overview
The claims and statistics of this paper haven’t been checked yet.
Run the check — free, no account needed. It reads the open-access text and checks the sources it cites.
Integrity signals
Registry
Cites
Statistics
Figures
Verification
Claims the paper makes
The claims and statistics of this paper haven’t been checked yet.
Run the check — free, no account needed. It reads the open-access text and checks the sources it cites.
Claims other papers make about this one
Each is checked against this paper’s own text: does it say what the citing paper says it does?
The cited source says what the claim attributes to it.
In the citing paper
“The ECOsystem Spaceborne Thermal Radiometer Experiment on Space Station (ECOSTRESS) may bring synchronized HR observations with Landsat due to its irregular orbit (Fisher et al., 2020; Zhang et al., 2025c), while it has been reported to suffer from striping and other issues (Kustura et al., 2025).”
From PGDM: Physically guided diffusion model for land surface temperature downscaling (2025) · cites this paper as Kustura et al., 2025
Self-check
Percentages, sums and reported differences re-computed from the paper’s own numbers.
The self-check needs the paper’s full text.
Citations
Cites
(IPCC), I. P. O. C. C. (2023) · doi:10.1017/9781009325844 · Cited by 10,921
Surface Urban Heat Island Across 419 Global Big Cities
Peng, S., Piao, S., Ciais, P., Friedlingstein, P., Ottle, C., Bréon, F.-M., Nan, H., Zhou, L., & Myneni, R. B. (2012) · Environmental Science & Technology · doi:10.1021/es2030438 · Cited by 1,456
The burden of heat-related mortality attributable to recent human-induced climate change
Vicedo-Cabrera, A. M., Scovronick, N., Sera, F., Royé, D., Schneider, R., Tobias, A., Astrom, C., Guo, Y., Honda, Y., Hondula, D. M., et al. (2021) · Nature Climate Change · doi:10.1038/s41558-021-01058-x · Cited by 1,347
A systematic review of urban heat island and heat waves research (1991–2022)
Cheval, S., Amihăesei, V.-A., Chitu, Z., Dumitrescu, A., Falcescu, V., Irașoc, A., Micu, D. M., Mihulet, E., Ontel, I., Paraschiv, M.-G., et al. (2024) · Climate Risk Management · doi:10.1016/j.crm.2024.100603 · Cited by 156
Research works printed but not linked: 102
- Scarpa, 2021, Climate Change Adaptation to Extreme Heat: A Global Systematic Review of Implemented Action, Oxf. Open Clim. Chan., 1, kgab005, 10.1093/oxfclm/kgab005 · DOI
- Oke, 1982, The Energetic Basis of the Urban Heat Island, Q. J. R. Meteorol. Soc., 108, 1
- Oke, T.R., Mills, G., Christen, A., and Voogt, J.A. (2017). Urban Climates, Cambridge University Press. · DOI
- Deilami, 2018, Urban Heat Island Effect: A Systematic Review of Spatio-Temporal Factors, Data, Methods, and Mitigation Measures, Int. J. Appl. Earth Obs. Geoinf., 67, 30
- Logan, 2020, Night and Day: The Influence and Relative Importance of Urban Characteristics on Remotely Sensed Land Surface Temperature, Remote Sens. Environ., 247, 111861, 10.1016/j.rse.2020.111861 · DOI
- Back, 2021, A Rapid Fine-Scale Approach to Modelling Urban Bioclimatic Conditions, Sci. Total Environ., 756, 143732, 10.1016/j.scitotenv.2020.143732 · DOI
- Back, 2023, Integrating CFD-GIS Modelling to Refine Urban Heat and Thermal Comfort Assessment, Sci. Total Environ., 858, 159729, 10.1016/j.scitotenv.2022.159729 · DOI
- Hart, 2009, Quantifying the Influence of Land-Use and Surface Characteristics on Spatial Variability in the Urban Heat Island, Theor. Appl. Climatol., 95, 397, 10.1007/s00704-008-0017-5 · DOI
- Patel, 2024, A Comprehensive Systematic Review: Impact of Land Use/ Land Cover (LULC) on Land Surface Temperatures (LST) and Outdoor Thermal Comfort, Build. Environ., 249, 111130, 10.1016/j.buildenv.2023.111130 · DOI
- Kumar, 2024, Urban Heat Mitigation by Green and Blue Infrastructure: Drivers, Effectiveness, and Future Needs, Innovation, 5, 100588
- Karimi, 2023, New Developments and Future Challenges in Reducing and Controlling Heat Island Effect in Urban Areas, Environ. Dev. Sustain., 25, 10485, 10.1007/s10668-022-02530-0 · DOI
- Greene, 2011, An Examination of Climate Change on Extreme Heat Events and Climate–Mortality Relationships in Large U.S. Cities, Weather Clim. Soc., 3, 281, 10.1175/WCAS-D-11-00055.1 · DOI
- Covert, 2023, Climate Change Impacts on Respiratory Health: Exposure, Vulnerability, and Risk, Physiol. Rev., 103, 2507, 10.1152/physrev.00043.2022 · DOI
- Terzi, 2019, Multi-Risk Assessment in Mountain Regions: A Review of Modelling Approaches for Climate Change Adaptation, J. Environ. Manag., 232, 759, 10.1016/j.jenvman.2018.11.100 · DOI
- Li, 2018, A New Method to Quantify Surface Urban Heat Island Intensity, Sci. Total Environ., 624, 262, 10.1016/j.scitotenv.2017.11.360 · DOI
- Yang, 2021, The Relationship between Land Surface Temperature and Artificial Impervious Surface Fraction in 682 Global Cities: Spatiotemporal Variations and Drivers, Environ. Res. Lett., 16, 024032, 10.1088/1748-9326/abdaed · DOI
- Bowen, 1926, The Ratio of Heat Losses by Conduction and by Evaporation from Any Water Surface, Phys. Rev., 27, 779, 10.1103/PhysRev.27.779 · DOI
- Mahmood, 2014, Land Cover Changes and Their Biogeophysical Effects on Climate, Int. J. Climatol., 34, 929, 10.1002/joc.3736 · DOI
- Schwingshackl, 2017, Quantifying Spatiotemporal Variations of Soil Moisture Control on Surface Energy Balance and Near-Surface Air Temperature, J. Clim., 30, 7105, 10.1175/JCLI-D-16-0727.1 · DOI
- Li, 2019, Urban Heat Island: Aerodynamics or Imperviousness?, Sci. Adv., 5, eaau4299, 10.1126/sciadv.aau4299 · DOI
- Anderson, 2008, A Thermal-Based Remote Sensing Technique for Routine Mapping of Land-Surface Carbon, Water and Energy Fluxes from Field to Regional Scales, Remote Sens. Environ., 112, 4227, 10.1016/j.rse.2008.07.009 · DOI
- Dash, 2002, Land Surface Temperature and Emissivity Estimation from Passive Sensor Data: Theory and Practice-Current Trends, Int. J. Remote Sens., 23, 2563, 10.1080/01431160110115041 · DOI
- Dickinson, R.E. (1983). Land Surface Processes and Climate—Surface Albedos and Energy Balance. Theory of Climate, Elsevier. · DOI
- Zhou, D., Xiao, J., Bonafoni, S., Berger, C., Deilami, K., Zhou, Y., Frolking, S., Yao, R., Qiao, Z., and Sobrino, J.A. (2019). Satellite Remote Sensing of Surface Urban Heat Islands: Progress, Challenges, and Perspectives. Remote Sens., 11. · DOI
- Wesley, E.J., and Brunsell, N.A. (2019). Greenspace Pattern and the Surface Urban Heat Island: A Biophysically-Based Approach to Investigating the Effects of Urban Landscape Configuration. Remote Sens., 11. · DOI
- Granero-Belinchon, C., Michel, A., Lagouarde, J.-P., Sobrino, J.A., and Briottet, X. (2019). Night Thermal Unmixing for the Study of Microscale Surface Urban Heat Islands with TRISHNA-Like Data. Remote Sens., 11. · DOI
- Cammalleri, 2015, On the Role of Land Surface Temperature as Proxy of Soil Moisture Status for Drought Monitoring in Europe, Remote Sens., 7, 16849, 10.3390/rs71215857 · DOI
- Sun, 2012, Estimates of Evapotranspiration from MODIS and AMSR-E Land Surface Temperature and Moisture over the Southern Great Plains, Remote Sens. Environ., 127, 44, 10.1016/j.rse.2012.08.020 · DOI
- Galleguillos, 2011, Comparison of Two Temperature Differencing Methods to Estimate Daily Evapotranspiration over a Mediterranean Vineyard Watershed from ASTER Data, Remote Sens. Environ., 115, 1326, 10.1016/j.rse.2011.01.013 · DOI
- Yu, Y., Liu, Y., and Yu, P. (2018). Land Surface Temperature Product Development for JPSS and GOES-R Missions. Comprehensive Remote Sensing, Elsevier. · DOI
- Becker, 1995, Surface Temperature and Emissivity at Various Scales: Definition, Measurement and Related Problems, Remote Sens. Rev., 12, 225, 10.1080/02757259509532286 · DOI
- Dash, 2001, Retrieval of Land Surface Temperature and Emissivity from Satellite Data: Physics, Theoretical Limitations and Current Methods, J. Indian Soc. Remote Sens., 29, 23, 10.1007/BF02989910 · DOI
- Qin, 1999, Progress in the Remote Sensing of Land Surface Temperature and Ground Emissivity Using NOAA-AVHRR Data, Int. J. Remote Sens., 20, 2367, 10.1080/014311699212074 · DOI
- Li, 2023, Satellite Remote Sensing of Global Land Surface Temperature: Definition, Methods, Products, and Applications, Rev. Geophys., 61, e2022RG000777, 10.1029/2022RG000777 · DOI
- Prata, 1995, Thermal Remote Sensing of Land Surface Temperature from Satellites: Current Status and Future Prospects, Remote Sens. Rev., 12, 175, 10.1080/02757259509532285 · DOI
- Wark, 1962, Methods of Estimating Infrared Flux and Surface Temperature from Meteorological Satellites, J. Atmos. Sci., 19, 369, 10.1175/1520-0469(1962)019<0369:MOEIFA>2.0.CO;2 · DOI
- Lee, 2024, Improved Surface Urban Heat Impact Assessment Using GOES Satellite Data: A Comparative Study with ERA-5, Geophys. Res. Lett., 51, e2023GL107364, 10.1029/2023GL107364 · DOI
- Gouveia, C.M., Martins, J.P.A., Russo, A., Durão, R., and Trigo, I.F. (2022). Monitoring Heat Extremes across Central Europe Using Land Surface Temperature Data Records from SEVIRI/MSG. Remote Sens., 14. · DOI
- Reiners, 2024, Fusing AVHRR LST with Geostationary SEVIRI LST to Create a Long-Term Daily Maximum LST Time Series over Europe, IEEE J. Sel. Top. Appl. Earth Obs. Remote Sens., 18, 2168, 10.1109/JSTARS.2024.3514734 · DOI
- Yu, 2022, Global Spatiotemporally Continuous MODIS Land Surface Temperature Dataset, Sci. Data, 9, 143, 10.1038/s41597-022-01214-8 · DOI
- Hulley, 2018, NASA’s MODIS and VIIRS Land Surface Temperature and Emissivity Products: A Long-Term and Consistent Earth System Data Record, IEEE J. Sel. Top. Appl. Earth Obs. Remote Sens., 11, 522, 10.1109/JSTARS.2017.2779330 · DOI
- Hulley, 2011, Generating Consistent Land Surface Temperature and Emissivity Products Between ASTER and MODIS Data for Earth Science Research, IEEE Trans. Geosci. Remote Sens., 49, 1304, 10.1109/TGRS.2010.2063034 · DOI
- Malakar, 2018, An Operational Land Surface Temperature Product for Landsat Thermal Data: Methodology and Validation, IEEE Trans. Geosci. Remote Sens., 56, 5717, 10.1109/TGRS.2018.2824828 · DOI
- Hulley, 2022, Validation and Quality Assessment of the ECOSTRESS Level-2 Land Surface Temperature and Emissivity Product, IEEE Trans. Geosci. Remote Sens., 60, 1, 10.1109/TGRS.2021.3079879 · DOI
- De Almeida, C.R., Teodoro, A.C., and Gonçalves, A. (2021). Study of the Urban Heat Island (UHI) Using Remote Sensing Data/Techniques: A Systematic Review. Environments, 8. · DOI
- Manoli, 2020, Seasonal Hysteresis of Surface Urban Heat Islands, Proc. Natl. Acad. Sci. USA, 117, 7082, 10.1073/pnas.1917554117 · DOI
- Dian, 2020, Annual and Monthly Analysis of Surface Urban Heat Island Intensity with Respect to the Local Climate Zones in Budapest, Urban Clim., 31, 100573, 10.1016/j.uclim.2019.100573 · DOI
- Benz, 2021, Widespread Race and Class Disparities in Surface Urban Heat Extremes Across the United States, Earths Future, 9, e2021EF002016, 10.1029/2021EF002016 · DOI
- Sobrino, 2013, Evaluation of the Surface Urban Heat Island Effect in the City of Madrid by Thermal Remote Sensing, Int. J. Remote Sens., 34, 3177, 10.1080/01431161.2012.716548 · DOI
- Zhou, J., Liu, S., Li, M., Zhan, W., Xu, Z., and Xu, T. (2016). Quantification of the Scale Effect in Downscaling Remotely Sensed Land Surface Temperature. Remote Sens., 8. · DOI
- Zhou, B., Rybski, D., and Kropp, J.P. (2017). The Role of City Size and Urban Form in the Surface Urban Heat Island. Sci. Rep., 7. · DOI
- Onačillová, K., Gallay, M., Paluba, D., Péliová, A., Tokarčík, O., and Laubertová, D. (2022). Combining Landsat 8 and Sentinel-2 Data in Google Earth Engine to Derive Higher Resolution Land Surface Temperature Maps in Urban Environment. Remote Sens., 14. · DOI
- Pu, 2021, Assessing Scaling Effect in Downscaling Land Surface Temperature in a Heterogenous Urban Environment, Int. J. Appl. Earth Obs. Geoinf., 96, 102256
- Pu, R., and Bonafoni, S. (2021). Reducing Scaling Effect on Downscaled Land Surface Temperature Maps in Heterogenous Urban Environments. Remote Sens., 13. · DOI
- Pu, 2023, Thermal Infrared Remote Sensing Data Downscaling Investigations: An Overview on Current Status and Perspectives, Remote Sens. Appl. Soc. Environ., 29, 100921
- Masson, 2020, City-Descriptive Input Data for Urban Climate Models: Model Requirements, Data Sources and Challenges, Urban Clim., 31, 100536, 10.1016/j.uclim.2019.100536 · DOI
- Shen, 2015, Missing Information Reconstruction of Remote Sensing Data: A Technical Review, IEEE Geosci. Remote Sens., 3, 61, 10.1109/MGRS.2015.2441912 · DOI
- Wu, 2021, Spatially Continuous and High-Resolution Land Surface Temperature Product Generation: A Review of Reconstruction and Spatiotemporal Fusion Techniques, IEEE Geosci. Remote Sens., 9, 112, 10.1109/MGRS.2021.3050782 · DOI
- Mo, Y., Xu, Y., Chen, H., and Zhu, S. (2021). A Review of Reconstructing Remotely Sensed Land Surface Temperature Under Cloudy Conditions. Remote Sens., 13. · DOI
- Jia, 2024, Advances in Methodology and Generation of All-Weather Land Surface Temperature Products From Polar-Orbiting and Geostationary Satellites: A Comprehensive Review, IEEE Geosci. Remote Sens., 12, 218, 10.1109/MGRS.2024.3421268 · DOI
- Wu, P., Yin, Z., Yang, H., Wu, Y., and Ma, X. (2019). Reconstructing Geostationary Satellite Land Surface Temperature Imagery Based on a Multiscale Feature Connected Convolutional Neural Network. Remote Sens., 11. · DOI
- Ke, 2013, Reconstruction of Time-Series MODIS LST in Central Qinghai-Tibet Plateau Using Geostatistical Approach, IEEE Geosci. Remote Sens., 10, 1602, 10.1109/LGRS.2013.2263553 · DOI
- Zhang, 2015, Mapping Paddy Rice Planting Areas through Time Series Analysis of MODIS Land Surface Temperature and Vegetation Index Data, ISPRS J. Photogramm. Remote Sens., 106, 157, 10.1016/j.isprsjprs.2015.05.011 · DOI
- Weiss, 2014, An Effective Approach for Gap-Filling Continental Scale Remotely Sensed Time-Series, ISPRS J. Photogramm. Remote Sens., 98, 106, 10.1016/j.isprsjprs.2014.10.001 · DOI
- Sarafanov, M., Kazakov, E., Nikitin, N.O., and Kalyuzhnaya, A.V. (2020). A Machine Learning Approach for Remote Sensing Data Gap-Filling with Open-Source Implementation: An Example Regarding Land Surface Temperature, Surface Albedo and NDVI. Remote Sens., 12. · DOI
- Duan, 2017, A Framework for the Retrieval of All-Weather Land Surface Temperature at a High Spatial Resolution from Polar-Orbiting Thermal Infrared and Passive Microwave Data, Remote Sens. Environ., 195, 107, 10.1016/j.rse.2017.04.008 · DOI
- Zeng, 2018, A Two-Step Framework for Reconstructing Remotely Sensed Land Surface Temperatures Contaminated by Cloud, ISPRS J. Photogramm. Remote Sens., 141, 30, 10.1016/j.isprsjprs.2018.04.005 · DOI
- Jia, 2021, Cloudy-Sky Land Surface Temperature from VIIRS and MODIS Satellite Data Using a Surface Energy Balance-Based Method, Remote Sens. Environ., 263, 112566, 10.1016/j.rse.2021.112566 · DOI
- Liu, 2017, Spatiotemporal Reconstruction of Land Surface Temperature Derived From FengYun Geostationary Satellite Data, IEEE J. Sel. Top. Appl. Earth Obs. Remote Sens., 10, 4531, 10.1109/JSTARS.2017.2716376 · DOI
- Ma, 2022, Generating Gapless Land Surface Temperature with a High Spatio-Temporal Resolution by Fusing Multi-Source Satellite-Observed and Model-Simulated Data, Remote Sens. Environ., 278, 113083, 10.1016/j.rse.2022.113083 · DOI
- Belgiu, M., and Stein, A. (2019). Spatiotemporal Image Fusion in Remote Sensing. Remote Sens., 11. · DOI
- Zhu, 2017, Deep Learning in Remote Sensing: A Comprehensive Review and List of Resources, IEEE Geosci. Remote Sens., 5, 8, 10.1109/MGRS.2017.2762307 · DOI · Paper page
- Ball, 2017, Comprehensive Survey of Deep Learning in Remote Sensing: Theories, Tools, and Challenges for the Community, J. Appl. Remote Sens., 11, 042609, 10.1117/1.JRS.11.042609 · DOI · Paper page
- Chlingaryan, 2018, Machine Learning Approaches for Crop Yield Prediction and Nitrogen Status Estimation in Precision Agriculture: A Review, Comput. Electron. Agric., 151, 61, 10.1016/j.compag.2018.05.012 · DOI
- Osco, 2021, A Review on Deep Learning in UAV Remote Sensing, Int. J. Appl. Earth Obs. Geoinf., 102, 102456
- Li, 2022, Deep Learning in Multimodal Remote Sensing Data Fusion: A Comprehensive Review, Int. J. Appl. Earth Obs. Geoinf., 112, 102926
- Yuan, 2020, Deep Learning in Environmental Remote Sensing: Achievements and Challenges, Remote Sens. Environ., 241, 111716, 10.1016/j.rse.2020.111716 · DOI · Paper page
- Wang, 2024, Filling Gaps in Cloudy Landsat LST Product by Spatial-Temporal Fusion of Multi-Scale Data, Remote Sens. Environ., 306, 114142, 10.1016/j.rse.2024.114142 · DOI
- Wu, 2022, A Two-Step Deep Learning Framework for Mapping Gapless All-Weather Land Surface Temperature Using Thermal Infrared and Passive Microwave Data, Remote Sens. Environ., 277, 113070, 10.1016/j.rse.2022.113070 · DOI
- Kartal, 2022, Prediction of MODIS Land Surface Temperature Using New Hybrid Models Based on Spatial Interpolation Techniques and Deep Learning Models, Environ. Sci. Pollut. Res., 29, 67115, 10.1007/s11356-022-20572-9 · DOI
- Tan, J., NourEldeen, N., Mao, K., Shi, J., Li, Z., Xu, T., and Yuan, Z. (2019). Deep Learning Convolutional Neural Network for the Retrieval of Land Surface Temperature from AMSR2 Data in China. Sensors, 19. · DOI
- Zhang, 2024, A Practical Two-Step Framework for All-Sky Land Surface Temperature Estimation, Remote Sens. Environ., 303, 113991, 10.1016/j.rse.2024.113991 · DOI
- Huang, 2018, Urban Land-Use Mapping Using a Deep Convolutional Neural Network with High Spatial Resolution Multispectral Remote Sensing Imagery, Remote Sens. Environ., 214, 73, 10.1016/j.rse.2018.04.050 · DOI · Paper page
- Cheng, 2020, Remote Sensing Image Scene Classification Meets Deep Learning: Challenges, Methods, Benchmarks, and Opportunities, IEEE J. Sel. Top. Appl. Earth Obs. Remote Sens., 13, 3735, 10.1109/JSTARS.2020.3005403 · DOI
- Corbane, 2021, Convolutional Neural Networks for Global Human Settlements Mapping from Sentinel-2 Satellite Imagery, Neural Comput. Appl., 33, 6697, 10.1007/s00521-020-05449-7 · DOI
- Mansourmoghaddam, M., Rousta, I., Ghafarian Malamiri, H., Sadeghnejad, M., Krzyszczak, J., and Ferreira, C.S.S. (2024). Modeling and Estimating the Land Surface Temperature (LST) Using Remote Sensing and Machine Learning (Case Study: Yazd, Iran). Remote Sens., 16. · DOI
- Han, 2024, A Time-Continuous Land Surface Temperature (LST) Data Fusion Approach Based on Deep Learning with Microwave Remote Sensing and High-Density Ground Truth Observations, Sci. Total Environ., 914, 169992, 10.1016/j.scitotenv.2024.169992 · DOI
- Oke, T.R. (1987). Boundary Layer Climates, Routledge. [2nd ed.].
- Matzarakis, 2010, Modelling Radiation Fluxes in Simple and Complex Environments: Basics of the RayMan Model, Int. J. Biometeorol., 54, 131, 10.1007/s00484-009-0261-0 · DOI
- Li, 2013, Satellite-Derived Land Surface Temperature: Current Status and Perspectives, Remote Sens. Environ., 131, 14, 10.1016/j.rse.2012.12.008 · DOI
- Xuanlan, 2021, The Bowen Ratio of an Alpine Grassland in Three-River Headwaters, Qinghai-Tibet Plateau, from 2001 to 2018, J. Resour. Ecol., 12, 305
- Goffin, B.D., Cortés-Monroy, C.C., Neira-Román, F., Gupta, D.D., and Lakshmi, V. (2024). At Which Overpass Time Do ECOSTRESS Observations Best Align with Crop Health and Water Rights?. Remote Sens., 16. · DOI
- Haiden, 2011, The Integrated Nowcasting through Comprehensive Analysis (INCA) System and Its Validation over the Eastern Alpine Region, Weather Forecast., 26, 166, 10.1175/2010WAF2222451.1 · DOI
- Ghaemi, 2021, Evaluation of Integrated Nowcasting through Comprehensive Analysis (INCA) Precipitation Analysis Using a Dense Rain-Gauge Network in Southeastern Austria, Hydrol. Earth Syst. Sci., 25, 4335, 10.5194/hess-25-4335-2021 · DOI
- Syrris, V., Hasenohr, P., Delipetrev, B., Kotsev, A., Kempeneers, P., and Soille, P. (2019). Evaluation of the Potential of Convolutional Neural Networks and Random Forests for Multi-Class Segmentation of Sentinel-2 Imagery. Remote Sens., 11. · DOI
- Ioffe, S., and Szegedy, C. (2015). Batch Normalization: Accelerating Deep Network Training by Reducing Internal Covariate Shift. arXiv.
- Srivastava, 2014, Dropout: A Simple Way to Prevent Neural Networks from Overfitting, J. Mach. Learn. Res., 15, 1929
- Yang, 2024, An Annual Temperature Cycle Feature Constrained Method for Generating MODIS Daytime All-Weather Land Surface Temperature, IEEE Trans. Geosci. Remote Sens., 62, 4405014
- Naserikia, 2023, Land Surface and Air Temperature Dynamics: The Role of Urban Form and Seasonality, Sci. Total Environ., 905, 167306, 10.1016/j.scitotenv.2023.167306 · DOI
- Tang, 2017, Estimation of Land Surface Temperature From MODIS Data for the Atmosphere with Air Temperature Inversion Profile, IEEE J. Sel. Top. Appl. Earth Obs. Remote Sens., 10, 2976, 10.1109/JSTARS.2016.2634629 · DOI
- Shi, J., and Hu, C. (2021). Evaluation of ECOSTRESS Thermal Data over South Florida Estuaries. Sensors, 21. · DOI
- Gorokhovich, 2022, Use of ECOSTRESS Data for Measurements of the Surface Water Temperature: Significance of Data Filtering in Accuracy Assessment, Remote Sens. Appl. Soc. Environ., 26, 100739
Cited by
Sorted by citations
PGDM: Physically guided diffusion model for land surface temperature downscaling
Zhang, H., Tang, B.-H., Hu, T., Jiang, Y., & Li, Z.-L. (2025) · arXiv · doi:10.48550/arxiv.2511.05964 · Cited by 3
Metadata
- Authors
- Kustura, K., Conti, D., Sammer, M., & Riffler, M.
- Affiliations
- GeoVille (Austria) (AT)
- Corresponding author
- Riffler, Michael
- ORCID
- Riffler, Michael
- Venue
- Remote Sensing
- Publisher
- MDPI AG
- Published
- 2025-01-17
- Volume
- 17
- Issue
- 2
- Pages
- 318
- ISSN
- 2072-4292 (ISSN-L)
- OpenAlex
- W4406526076
- Cited by
- 22
- References
- 4
- Citations by year
- 2026: 6 · 2025: 16
- FWCI
- 5.47
- Type
- journal article
- Language
- en
- Open access
- gold
- doi.org
- Licence
- Locations
- Remote Sensing (publishedVersion, cc-by)
- Preprints.org (acceptedVersion, cc-by)
- DOAJ (DOAJ: Directory of Open Access Journals) (submittedVersion, cc-by-sa)
- Funders
- European Space Agency (ESA)
- Topics
- Physical Sciences › Environmental Science › Environmental Engineering › Urban Heat Island Mitigation
- Physical Sciences › Environmental Science › Ecology › Remote Sensing in Agriculture
- Physical Sciences › Environmental Science › Environmental Engineering › Soil Moisture and Remote Sensing
- Keywords
- land surface temperature, deep learning, convolutional neural networks, ECOSTRESS, Sentinel-2, multi-source data fusion, meteorological observations, sensor artifacts, diurnal variation, climate change adaptation, urban heat, land use and land cover change, heat stress monitoring
About these checks
Registry, retraction, Cites and statistics results are computed, not judged, with one exception: a printed reference that no index lists is read once by a model before it counts as a citation error. Claims are extracted by a model and kept only when their quote appears verbatim in the text; each cited source is then checked, with a model’s help, for whether it says what the claim relies on. Those verdicts can be wrong — read the claim’s quote and the cited source before relying on one.
Statistics and arithmetic are recomputed, not judged.
Confidence bands are shown only for fields calibrated on our annotated test set. None is calibrated yet, so no band is shown.
What counts as a claim ›How we measure confidence ›How we check this ›
Are you an author, or do you see a problem with this page? Request a review
How to cite
Cite CoChat for the checks on this page, and the paper for its own findings.
- This page
- CoChat. (2026). Citation check: Harnessing Multi-Source Data and Deep Learning for High-Resolution Land Surface Temperature Gap-Filling Supporting Climate Change Adaptation Activities. https://app.cochat.ai/papers/10.3390/rs17020318
- The paper
- Kustura, K., Conti, D., Sammer, M., & Riffler, M. (2025). Harnessing Multi-Source Data and Deep Learning for High-Resolution Land Surface Temperature Gap-Filling Supporting Climate Change Adaptation Activities. Remote Sensing. https://doi.org/10.3390/rs17020318
