

Real-Time Vehicle Classification and Tracking Using a Transfer Learning-Improved Deep Learning Network
Open accessThe DOI matches its Crossref record; 54 of the 56 references it cites were found in a registry or an index; 12 of the 29 sources its claims cite were checked for support.
Abstract
Accurate vehicle classification and tracking are increasingly important subjects for intelligent transport systems (ITSs) and for planning that utilizes precise location intelligence. Deep learning (DL) and computer vision are intelligent methods; however, accurate real-time classification and tracking come with problems. We tackle three prominent problems (P1, P2, and P3): the need for a large training dataset (P1), the domain-shift problem (P2), and coupling a real-time multi-vehicle tracking algorithm with DL (P3). To address P1, we created a training dataset of nearly 30,000 samples from existing cameras with seven classes of vehicles. To tackle P2, we trained and applied transfer learning-based fine-tuning on several state-of-the-art YOLO (You Only Look Once) networks. For P3, we propose a multi-vehicle tracking algorithm that obtains the per-lane count, classification, and speed of vehicles in real time. The experiments showed that accuracy doubled after fine-tuning (71% vs. up to 30%). Based on a comparison of four YOLO networks, coupling the YOLOv5-large network to our tracking algorithm provided a trade-off between overall accuracy (95% vs. up to 90%), loss (0.033 vs. up to 0.036), and model size (91.6 MB vs. up to 120.6 MB). The implications of these results are in spatial information management and sensing for intelligent transport planning.
Overview
CoChat Summary
## TL;DR
The paper presents a real-time vehicle classification and tracking system that combines fine-tuned YOLO detectors with a custom centroid-based multi-vehicle tracker for lane-level counts, classification, and speed estimation. Using a newly created dataset of nearly 30,000 samples across seven vehicle classes, the best model (YOLOv5l) reached 95% overall accuracy in the tracking/classification setup after transfer-learning fine-tuning.
## Key findings
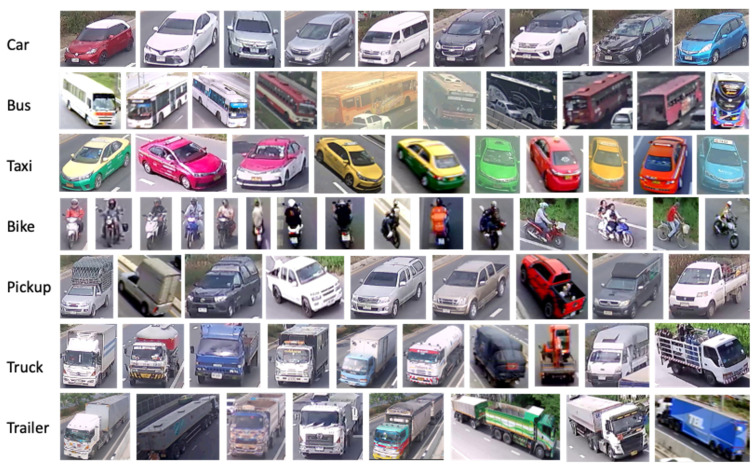
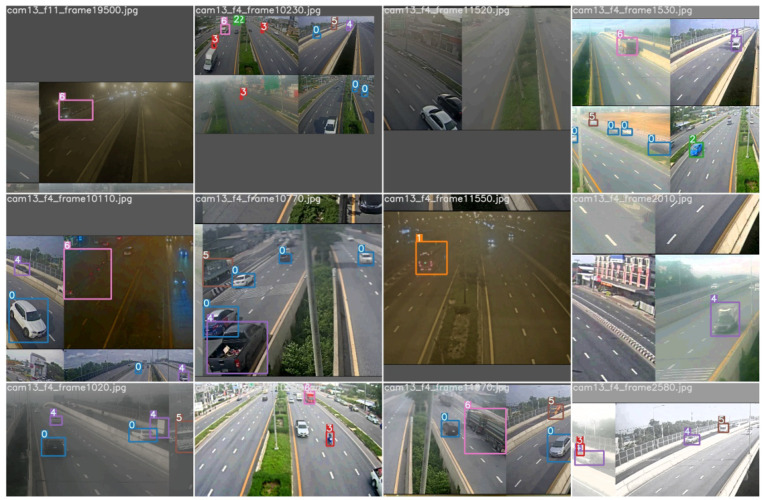
- The authors created a training dataset of nearly 30,000 samples from Thailand surveillance cameras covering 7 classes: car, bus, taxi, bike, pickup, truck, and trailer.
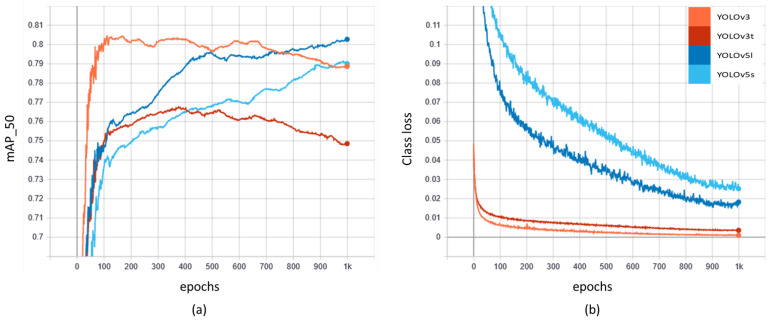
- Fine-tuning on a smaller target dataset boosted mAP_50 for all four YOLO models: YOLOv3 from 0.30 to 0.71, YOLOv3t from 0.26 to 0.67, YOLOv5l from 0.27 to 0.70, and YOLOv5s from 0.25 to 0.68.
- On the tracking/classification task, YOLOv5l performed best with precision 0.96, recall 0.95, and overall accuracy 0.95; the other models had OA values of 0.90 (YOLOv3), 0.90 (YOLOv3t), and 0.83 (YOLOv5s).
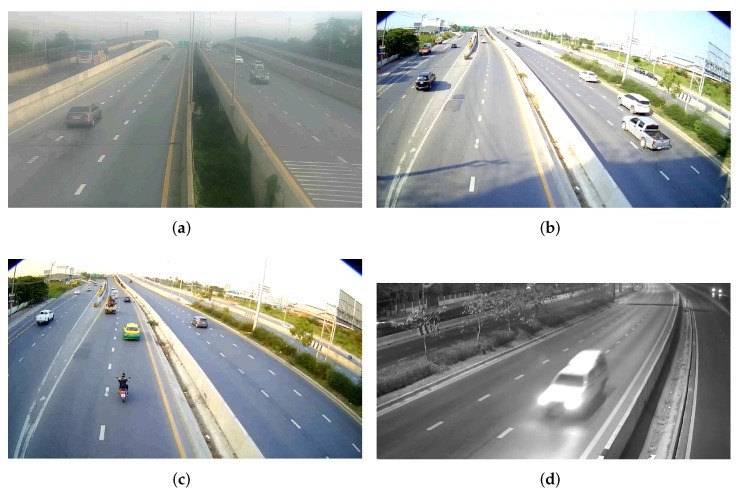
- In the stream-quality experiment, YOLOv5l counted/classified 99.6% and 94% of vehicles on clear video streams, and the average accuracy across four videos was 94%.
## Methods
- Two-stage training design: TR1 was a large source dataset built from 23 surveillance cameras over 3 days (6.3 TB of video, manually annotated), and TR2 was a smaller target dataset from the deployment cameras used for transfer-learning fine-tuning.
- Compared four YOLO variants: YOLOv3, YOLOv3-tiny, YOLOv5-large, and YOLOv5-small, all trained with 640 × 640 inputs and evaluated with mAP_50, precision, recall, loss, and model size.
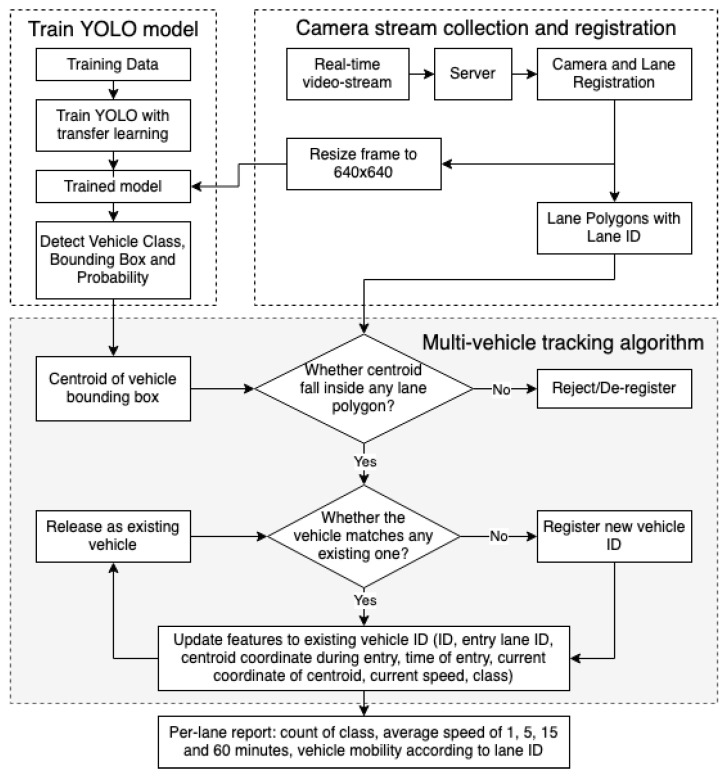
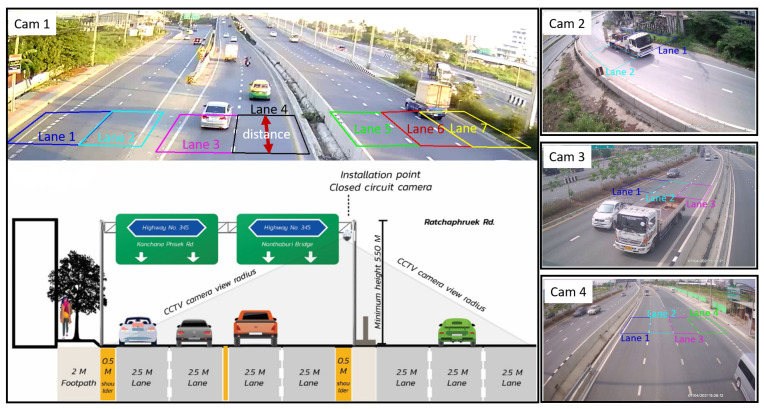
- Added a centroid-based multi-vehicle tracking algorithm that uses detected bounding boxes and lane polygons to register vehicles, count per lane, estimate speed, and produce lane-based reports in real time.
## Limitations
- The paper states that there is “more room for improvement” in detection, counting, and tracking, and that metrics were calculated on full image frames; limiting detection to a smaller ROI could further improve accuracy.
- Performance dropped in adverse conditions, especially at night, due to black-and-white streaming, headlights, and sudden light changes; the paper notes nighttime classification was highly affected.
- Evident from the text: the system depends on manually drawn lane polygons, camera placement, and specific road geometry, which may limit generality across sites.
Model-written summary. Check it against the paper before relying on it.
Integrity signals
Registry
Cites
Statistics
Figures
Verification
Claims the paper makes
8 Valid · 6 Not valid · 7 Not checked · 62 Own results and interpretations
The cited sources support only part of this claim — read each source’s verdict below.
In the paper
“This neck generates feature pyramids that help the overall network to generalize objects of different scales and sizes.”
§ Real-Time Vehicle Classification and Tracking Using a Transfer Learning-Improved Deep Learning Network > 3. Method > 3.2. YOLO-Based Detection and Classification
What the sources say
- Not checked — no full text of the sourcecites [54] Liu, S., Qi, L., Qin, H., Shi, J., and Jia, J. (2018, January 18–23). Path aggregation network for instance segmentation. Proceedings of the 2018 IEEE/CVF Conference on Computer Vision and Pattern Recognition, Salt Lake City, UT, USA. source
- Partly supportedcites [55] He, 2015, Spatial pyramid pooling in deep convolutional networks for visual recognition, IEEE Trans. Pattern Anal. Mach. Intell. sourceExperimental — accuracy not yet measured
The Conclusion (p. 12) describes SPP as a solution for handling different scales and sizes, and the Introduction (p. 2) says it pools features at multiple levels. The paper does not establish that a CSP/PANet neck generates feature pyramids or that this particular neck improves generalization across object scales. (LLM, conf=0.85)
plainstates a cause- Asserted: passes — The authors put it forward as true.
- Checkable: passes — It can be checked against evidence.
- Load-bearing: unclear — It is unclear whether the paper’s conclusions depend on it.
- Based: passes — The paper gives a reason why it holds.
The cited sources that could be checked couldn’t confirm or dispute this claim.
In the paper
“Traditional detectors, such as contour-based target detection [29], the Harris corner detector [30], SIFT, and feature point-based methods [31,32], were used to produce false detection that resulted further in false matching.”
§ Real-Time Vehicle Classification and Tracking Using a Transfer Learning-Improved Deep Learning Network > 2. Related Works and Background > 2.3. Vehicle Tracking
What the sources say
- Not checked — no full text of the sourcecites [29] Meyer, 1997, Model based extraction of articulated objects in image sequences for gait analysis, Proceedings of the International Conference on Image Processing source
- Not matchedcites [30] Harris, C., and Stephens, M. (September, January 31). A combined corner and edge detector. Proceedings of the Alvey Vision Conference, Manchester, UK.
Couldn’t be matched to a paper in Crossref, so it can’t be checked.
- Could not verifycites [31] Henriques, 2014, High-speed tracking with kernelized correlation filters, IEEE Trans. Pattern Anal. Mach. Intell. sourceExperimental — accuracy not yet measured
Section 2.1 (pp. 1–2) discusses tracking-by-detection, and Section 2.2 (p. 2) mentions wrong detections in the context of hard-negative mining. Neither passage says that contour-based, Harris, SIFT, or feature-point detectors produce false detections that lead to false matches. Searches for those detector names and for false matching found no supporting passage in our copy. (LLM, conf=0.74)
- Not matchedcites [32] Cui, Z., Xiao, S., Feng, J., and Yan, S. (July, January 26). Recurrently target-attending tracking. Proceedings of the IEEE Conference on Computer Vision and Pattern Recognition, Las Vegas, NV, USA.
Couldn’t be matched to a paper in Crossref, so it can’t be checked.
plainstates a cause- Asserted: passes — The authors put it forward as true.
- Checkable: passes — It can be checked against evidence.
- Load-bearing: passes — The paper’s conclusions depend on it.
- Based: passes — The paper gives a reason why it holds.
The cited sources support only part of this claim — read each source’s verdict below.
In the paper
“Song et al. [25] improved the accuracy of detection and classification of cars, buses, and trucks from 49% to 95% by segmenting road pixels first, before object detection, using YOLOv3.”
§ Real-Time Vehicle Classification and Tracking Using a Transfer Learning-Improved Deep Learning Network > 4. Results and Discussion > 4.2. The Domain-Shift Problem and Transfer Learning
What the sources say
- Partly supportedcites [25] Song, 2019, Vision-based vehicle detection and counting system using deep learning in highway scenes, Eur. Transp. Res. Rev. sourceExperimental — accuracy not yet measured
The Road surface segmentation and Network training and vehicle detection sections describe segmenting the road before using YOLOv3 to detect cars, buses, and trucks; the latter says this improves detection compared with full-image detection. They do not report an accuracy increase from 49% to 95%. Instead, the Network training and vehicle detection section reports 87.88% mean average precision and an 83.46% overall correct detection rate. (LLM, conf=0.90)
plainstates a cause- Asserted: passes — The authors put it forward as true.
- Checkable: passes — It can be checked against evidence.
- Load-bearing: unclear — It is unclear whether the paper’s conclusions depend on it.
- Based: passes — The paper gives a reason why it holds.
- Partly supported
The cited sources support only part of this claim — read each source’s verdict below.
In the paper
“Using feature pyramids, PANet, and SPP blocks improves object identification on unseen data as well.”
§ Real-Time Vehicle Classification and Tracking Using a Transfer Learning-Improved Deep Learning Network > 3. Method > 3.2. YOLO-Based Detection and Classification
What the sources say
- Not checked — no full text of the sourcecites [54] Liu, S., Qi, L., Qin, H., Shi, J., and Jia, J. (2018, January 18–23). Path aggregation network for instance segmentation. Proceedings of the 2018 IEEE/CVF Conference on Computer Vision and Pattern Recognition, Salt Lake City, UT, USA. source
- Partly supportedcites [55] He, 2015, Spatial pyramid pooling in deep convolutional networks for visual recognition, IEEE Trans. Pattern Anal. Mach. Intell. sourceExperimental — accuracy not yet measured
Section 3.1.2 (p. 5) reports that spatial pyramid pooling improved accuracy over no-SPP baselines on the ImageNet validation set. The paper does not evaluate PANet or show that the stated combination of feature pyramids, PANet, and SPP blocks improves identification on unseen data. (LLM, conf=0.90)
plainstates a cause- Asserted: passes — The authors put it forward as true.
- Checkable: passes — It can be checked against evidence.
- Load-bearing: unclear — It is unclear whether the paper’s conclusions depend on it.
- Based: passes — The paper gives a reason why it holds.
The cited sources support only part of this claim — read each source’s verdict below.
In the paper
“DL-based methods have the advantage of accurate detection and classification, but only if the training and test datasets are from the same or similar environment [42] such that they are not affected by contextual and spatial uncertainties [43].”
§ Real-Time Vehicle Classification and Tracking Using a Transfer Learning-Improved Deep Learning Network > 2. Related Works and Background > 2.4. The Domain-Shift Problem and Transfer Learning
What the sources say
- Supportedcites [42] Neupane, B., Horanont, T., and Aryal, J. (2021). Deep learning-based semantic segmentation of urban features in satellite images: A review and meta-analysis. Remote Sensing, 13. source
Section 2.5 (Generative Adversarial Networks) states directly that 'Most CNN based methods perform well when they are tested on the images that are similar to the train images, but fail when the domain shifts to a new domain,' attributing the shift to imaging sensors, resolution and class representation — i.e. the same/similar-environment condition the claim paraphrases. Section 3.2.3/4.3 reinforces this by noting that papers such as Benjdira et al. [127] and Liu et al. [107] were aimed specifically at improving segmentation when train and test datasets come from different domains (OA rising only from 35% to 52% going Potsdam→Vaihingen), and the Conclusions (Section 5) still list minimisation of the domain-shift problem as an open future direction. The 'only if' phrasing is thus consistent with our copy, which treats cross-domain remedies as limited and not yet standard. (LLM, conf=0.85)
- Partly supportedcites [43] Majid Roodposhti, S., Aryal, J., Lucieer, A., and Bryan, B. (2019). Uncertainty assessment of hyperspectral image classification: Deep learning vs. random forest. Entropy, 21. sourceExperimental — accuracy not yet measured
The Methods (§2.1) say training and test samples were randomly drawn from each dataset, and the Results (§3.2) report that the deep neural network classified more accurately than random forest on Indian Pines. The paper does not compare performance across different training and test environments, so it does not establish that accurate classification occurs only when those environments are similar. (LLM, conf=0.84)
plainstates a possible cause- Asserted: passes — The authors put it forward as true.
- Checkable: passes — It can be checked against evidence.
- Load-bearing: passes — The paper’s conclusions depend on it.
- Based: passes — The paper gives a reason why it holds.
- Supported
32 more claims
Create a free account to see all 83 claims and to verify the 1 reference still open.
- Probably not a substantial claim. 16
- It may state two separate claims as one. 33
- The quote only partly states this claim. 1
Citations
Cites
Deep Residual Learning for Image Recognition
He, K., Zhang, X., Ren, S., & Sun, J. (2016) · 2016 IEEE Conference on Computer Vision and Pattern Recognition (CVPR) · doi:10.1109/cvpr.2016.90 · Cited by 235,474
Faster R-CNN: Towards Real-Time Object Detection with Region Proposal Networks
Ren, S., He, K., Girshick, R., & Sun, J. (2017) · IEEE Transactions on Pattern Analysis and Machine Intelligence · doi:10.1109/tpami.2016.2577031 · Cited by 73,472 · cited 5×
“Compared to other fast models such as Faster-RCNN [20], single shot multibox object detection (SSD) [21], and Center Net [22] on the COCO-2017 dataset, YOLOv3 is able to produce a similar mAP, but 17 times faster (see https://cv.”
MethodInfluentialYou Only Look Once: Unified, Real-Time Object Detection
Redmon, J., Divvala, S., Girshick, R., & Farhadi, A. (2016) · 2016 IEEE Conference on Computer Vision and Pattern Recognition (CVPR) · doi:10.1109/cvpr.2016.91 · Cited by 53,803 · cited 2×
“Several SOTA DL models in the domain of near real-time multi-object classification belonging to the YOLO family [4] (two versions of improved YOLOv3 [5] and two versions of YOLOv5 [6]) were trained.”
BackgroundMethodDensely Connected Convolutional Networks
Huang, G., Liu, Z., Van Der Maaten, L., & Weinberger, K. Q. (2017) · 2017 IEEE Conference on Computer Vision and Pattern Recognition (CVPR) · doi:10.1109/cvpr.2017.243 · Cited by 48,566 · cited 1×
“For the first component of the backbone, we used a Focus layer and a Cross Stage Partial (CSP) network [51,52].”
MethodGoing deeper with convolutions
Szegedy, C., Liu, W., Jia, Y., Sermanet, P., Reed, S., Anguelov, D., Erhan, D., Vanhoucke, V., & Rabinovich, A. (2015) · 2015 IEEE Conference on Computer Vision and Pattern Recognition (CVPR) · doi:10.1109/cvpr.2015.7298594 · Cited by 48,562 · cited 2×
“[13] introduced vehicle classification using a CNN named GoogleNet [14] for large-scale traffic surveillance.”
Method(2016) · Cited by 31,590
Feature Pyramid Networks for Object Detection
Lin, T.-Y., Dollar, P., Girshick, R., He, K., Hariharan, B., & Belongie, S. (2017) · 2017 IEEE Conference on Computer Vision and Pattern Recognition (CVPR) · doi:10.1109/cvpr.2017.106 · Cited by 30,939 · cited 2×
“Unlike our choice of PANet, the neck can be replaced with other networks, such as a feature pyramid network (FPN), a path aggregation network (PAN), and a bidirectional FPN (BiFPN).”
MethodSSD: Single Shot MultiBox Detector
Liu, W., Anguelov, D., Erhan, D., Szegedy, C., Reed, S., Fu, C.-Y., & Berg, A. C. (2016) · Lecture Notes in Computer Science · doi:10.1007/978-3-319-46448-0_2 · Cited by 22,128 · cited 3×
“Compared to other fast models such as Faster-RCNN [20], single shot multibox object detection (SSD) [21], and Center Net [22] on the COCO-2017 dataset, YOLOv3 is able to produce a similar mAP, but 17 times faster (see https://cv.gluon.ai/model_zoo/detection.html (accessed on 21 April 2022) for comparison).”
MethodYOLO9000: Better, Faster, Stronger
Redmon, J., & Farhadi, A. (2017) · 2017 IEEE Conference on Computer Vision and Pattern Recognition (CVPR) · doi:10.1109/cvpr.2017.690 · Cited by 19,892 · cited 1×
“With continuous upgrades, five generations of YOLO architecture have been produced since its introduction: YOLO, YOLOv2 [16], YOLOv3 [5], YOLOv4 [17], and YOLOv5 [6].”
MethodYOLOv3: An Incremental Improvement
Redmon, J., & Farhadi, A. (2018) · arXiv · doi:10.48550/arxiv.1804.02767 · Cited by 17,141
A Combined Corner and Edge Detector
Harris, C., & Stephens, M. (1988) · Procedings of the Alvey Vision Conference 1988 · doi:10.5244/c.2.23 · Cited by 12,901 · cited 1×
“Traditional detectors, such as contour-based target detection [29], the Harris corner detector [30], SIFT, and feature point-based methods [31,32], were used to produce false detection that resulted further in false matching.”
MethodSpatial Pyramid Pooling in Deep Convolutional Networks for Visual Recognition
He, K., Zhang, X., Ren, S., & Sun, J. (2015) · IEEE Transactions on Pattern Analysis and Machine Intelligence · doi:10.1109/tpami.2015.2389824 · Cited by 11,971
YOLOv4: Optimal Speed and Accuracy of Object Detection
Bochkovskiy, A., Wang, C.-Y., & Liao, H.-Y. M. (2020) · arXiv · doi:10.48550/arxiv.2004.10934 · Cited by 10,307
Path Aggregation Network for Instance Segmentation
Liu, S., Qi, L., Qin, H., Shi, J., & Jia, J. (2018) · 2018 IEEE/CVF Conference on Computer Vision and Pattern Recognition · doi:10.1109/cvpr.2018.00913 · Cited by 10,011 · cited 1×
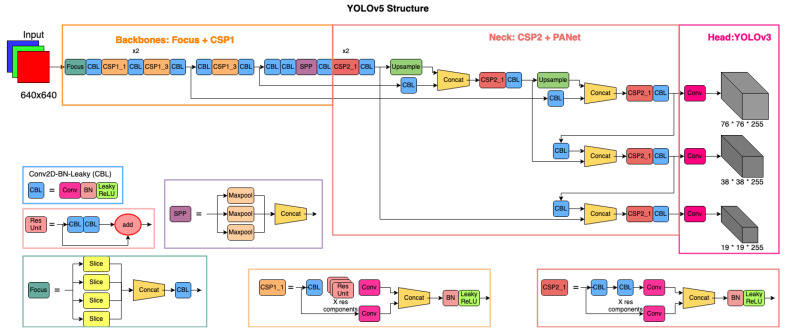
“For the neck of YOLOv5, we used the CSP and a path aggregation network (PANet) [54] with a spatial pyramid pooling (SPP) block [55].”
MethodVision meets robotics: The KITTI dataset
Geiger, A., Lenz, P., Stiller, C., & Urtasun, R. (2013) · The International Journal of Robotics Research · doi:10.1177/0278364913491297 · Cited by 9,913 · cited 1×
“Many of the studies that use DL models are pre-trained on a large training dataset such as COCO and KITTI [41], which include such classes as the car, bike, truck, and bus.”
BackgroundGeneralized Intersection Over Union: A Metric and a Loss for Bounding Box Regression
Rezatofighi, H., Tsoi, N., Gwak, J., Sadeghian, A., Reid, I., & Savarese, S. (2019) · 2019 IEEE/CVF Conference on Computer Vision and Pattern Recognition (CVPR) · doi:10.1109/cvpr.2019.00075 · Cited by 6,612 · cited 1×
“, the generalized intersection over union (GIoU) [56], for the loss function:”
BackgroundHigh-Speed Tracking with Kernelized Correlation Filters
Henriques, J. F., Caseiro, R., Martins, P., & Batista, J. (2015) · IEEE Transactions on Pattern Analysis and Machine Intelligence · doi:10.1109/tpami.2014.2345390 · Cited by 5,753
CSPNet: A New Backbone that can Enhance Learning Capability of CNN
Wang, C.-Y., Mark Liao, H.-Y., Wu, Y.-H., Chen, P.-Y., Hsieh, J.-W., & Yeh, I.-H. (2020) · 2020 IEEE/CVF Conference on Computer Vision and Pattern Recognition Workshops (CVPRW) · doi:10.1109/cvprw50498.2020.00203 · Cited by 5,265 · cited 1×
“For the first component of the backbone, we used a Focus layer and a Cross Stage Partial (CSP) network [51,52].”
MethodCenterNet: Keypoint Triplets for Object Detection
Duan, K., Bai, S., Xie, L., Qi, H., Huang, Q., & Tian, Q. (2019) · 2019 IEEE/CVF International Conference on Computer Vision (ICCV) · doi:10.1109/iccv.2019.00667 · Cited by 4,079 · cited 2×
“Compared to other fast models such as Faster-RCNN [20], single shot multibox object detection (SSD) [21], and Center Net [22] on the COCO-2017 dataset, YOLOv3 is able to produce a similar mAP, but 17 times faster (see https://cv.gluon.ai/model_zoo/detection.html (accessed on 21 April 2022) for comparison).”
MethodA Unified Multi-scale Deep Convolutional Neural Network for Fast Object Detection
Cai, Z., Fan, Q., Feris, R. S., & Vasconcelos, N. (2016) · Lecture Notes in Computer Science · doi:10.1007/978-3-319-46493-0_22 · Cited by 1,605 · cited 1×
“Even though these CNNs showed a good performance in object detection, they require heavy computation and are sensitive toward scale changes [15].”
BackgroundHigh-Speed tracking-by-detection without using image information
Bochinski, E., Eiselein, V., & Sikora, T. (2017) · 2017 14th IEEE International Conference on Advanced Video and Signal Based Surveillance (AVSS) · doi:10.1109/avss.2017.8078516 · Cited by 707 · cited 1×
“[33] tested several DL models to produce detection and used a passive detection filter for MOT, producing results in one of the fastest tracking methods.”
MethodObject tracking using SIFT features and mean shift
Zhou, H., Yuan, Y., & Shi, C. (2009) · Computer Vision and Image Understanding · doi:10.1016/j.cviu.2008.08.006 · Cited by 599 · cited 1×
“[25] used YOLOv3 to detect and classify the vehicles and used an ORB algorithm [26] to obtain driving directions.”
MethodVision-based vehicle detection and counting system using deep learning in highway scenes
Song, H., Liang, H., Li, H., Dai, Z., & Yun, X. (2019) · European Transport Research Review · doi:10.1186/s12544-019-0390-4 · Cited by 413 · cited 4×
“Some studies have also segmented the road surface to achieve higher performance [25], which requires more computation work.”
BackgroundMethodInfluentialA Real-Time Detection Algorithm for Kiwifruit Defects Based on YOLOv5
Yao, J., Qi, J., Zhang, J., Shao, H., Yang, J., & Li, X. (2021) · Electronics · doi:10.3390/electronics10141711 · Cited by 337 · cited 1×
“Network architecture of YOLOv5 (adapted from [57] and modified) with a backbone of”
MethodNeupane, B., Horanont, T., & Aryal, J. (2021) · Remote Sensing · doi:10.3390/rs13040808 · Cited by 247 · cited 1×
“DL-based methods have the advantage of accurate detection and classification, but only if the training and test datasets are from the same or similar environment [42] such that they are not affected by contextual and spatial uncertainties [43].”
Self-citationAn Improved YOLOv2 for Vehicle Detection
Sang, J., Wu, Z., Guo, P., Hu, H., Xiang, H., Zhang, Q., & Cai, B. (2018) · Sensors · doi:10.3390/s18124272 · Cited by 223 · cited 1×
“[23] came up with an improved detection model based on YOLOv2, which used the k-means++ algorithm to train a dataset to cluster vehicle bounding boxes.”
MethodCao, X., Wu, C., Yan, P., & Li, X. (2011) · 2011 18th IEEE International Conference on Image Processing · doi:10.1109/icip.2011.6116132 · Cited by 151 · cited 1×
“[8] proposed a method based on the histogram orientation gradient (HOG) feature, which is not sensitive to illumination change and can better distinguish the appearance and shape of objects.”
MethodRecurrently Target-Attending Tracking
Cui, Z., Xiao, S., Feng, J., & Yan, S. (2016) · 2016 IEEE Conference on Computer Vision and Pattern Recognition (CVPR) · doi:10.1109/cvpr.2016.161 · Cited by 144
ResNet-Based Vehicle Classification and Localization in Traffic Surveillance Systems
Jung, H., Choi, M.-K., Jung, J., Lee, J.-H., Kwon, S., & Jung, W. Y. (2017) · 2017 IEEE Conference on Computer Vision and Pattern Recognition Workshops (CVPRW) · doi:10.1109/cvprw.2017.129 · Cited by 137 · cited 1×
“[12] proposed vehicle classification and localization in traffic surveillance using ResNet50 for vehicle classification, adding dropping convolutional neural networks (DropCNN) with fine-tuning to improve classification performance.”
MethodA Cascade of Boosted Generative and Discriminative Classifiers for Vehicle Detection
Negri, P., Clady, X., Hanif, M. S., & Prévost, L. (2008) · EURASIP Journal on Advances in Signal Processing · doi:10.1155/2008/782432 · Cited by 126
Vehicle Tracking Using Deep SORT with Low Confidence Track Filtering
Hou, X., Wang, Y., & Chau, L.-P. (2019) · 2019 16th IEEE International Conference on Advanced Video and Signal Based Surveillance (AVSS) · doi:10.1109/avss.2019.8909903 · Cited by 123 · cited 1×
“[38] proposed the use of a method of tracking called DeepSORT with low-confidence track filtering, which reduced the false detection produced by the original DeepSORT algorithm.”
MethodModel based extraction of articulated objects in image sequences for gait analysis
Meyer, D., Denzler, J., & Niemann, H. (2002) · Proceedings of International Conference on Image Processing · doi:10.1109/icip.1997.631988 · Cited by 115 · cited 1×
“Traditional detectors, such as contour-based target detection [29], the Harris corner detector [30], SIFT, and feature point-based methods [31,32], were used to produce false detection that resulted further in false matching.”
MethodA Generic Deformable Model for Vehicle Recognition.
Ferryman, J., Worrall, A., Sullivan, G., & Baker, K. (1995) · Procedings of the British Machine Vision Conference 1995 · doi:10.5244/c.9.13 · Cited by 107
Fast and robust CAMShift tracking
Exner, D., Bruns, E., Kurz, D., Grundhöfer, A., & Bimber, O. (2010) · 2009 IEEE Computer Society Conference on Computer Vision and Pattern Recognition Workshops · doi:10.1109/cvprw.2010.5543787 · Cited by 107 · cited 2×
“[34] coupled the methods of Camshift [35] and the Kalman filter [36] along with a Faster-RCNN DL model [20] to detect and track vehicles in real time.”
MethodImproving Road Asset Condition Monitoring
Radopoulou, S. C., & Brilakis, I. (2016) · Transportation research procedia · doi:10.1016/j.trpro.2016.05.436 · Cited by 82 · cited 1×
“Automation in location intelligence in road environments using sensing technologies allows authorities to achieve resilience in road safety, controlled commutes, and assessments of road conditions [1].”
BackgroundWang, J., Zheng, H., Huang, Y., & Ding, X. (2017) · IEEE Transactions on Intelligent Transportation Systems · doi:10.1109/tits.2017.2765676 · Cited by 76 · cited 1×
“[46] improved the performance of a custom-”
Road vehicle classification using Support Vector Machines
Chen, Z., Pears, N., Freeman, M., & Austin, J. (2009) · 2009 IEEE International Conference on Intelligent Computing and Intelligent Systems · doi:10.1109/icicisys.2009.5357707 · Cited by 74 · cited 1×
“[7] used support vector machines (SVMs) for road vehicle classification based on colors and vehicle types using the Columbia Object Image Library (COIL) database.”
MethodZhuo, L., Jiang, L., Zhu, Z., Li, J., Zhang, J., & Long, H. (2017) · Machine Vision and Applications · doi:10.1007/s00138-017-0846-2 · Cited by 70 · cited 1×
“[13] introduced vehicle classification using a CNN named GoogleNet [14] for large-scale traffic surveillance.”
MethodKalake, L., Wan, W., & Hou, L. (2021) · IEEE Access · doi:10.1109/access.2021.3060821 · Cited by 68 · cited 1×
“Vehicle detection and classification using deep learning (DL) and multi-object tracking (MOT) on video streams obtained from a network of surveillance cameras have become the state of the art (SOTA) in the automation of intelligent transport systems (ITSs) [3].”
BackgroundMoving Vehicle Detection for Measuring Traffic Count Using OpenCV
Uke, N. J., & Thool, R. C. (2013) · Journal of Automation and Control Engineering · doi:10.12720/joace.1.4.349-352 · Cited by 67 · cited 1×
“[10] proposed moving vehicle detection for traffic count measurement from a single camera implementing OpenCV development kits.”
MethodUncertainty Assessment of Hyperspectral Image Classification: Deep Learning vs. Random Forest
Shadman Roodposhti, M., Aryal, J., Lucieer, A., & Bryan, B. A. (2019) · Entropy · doi:10.3390/e21010078 · Cited by 65 · cited 1×
“DL-based methods have the advantage of accurate detection and classification, but only if the training and test datasets are from the same or similar environment [42] such that they are not affected by contextual and spatial uncertainties [43].”
Self-citationRefining Yolov4 for Vehicle DetectionPreprint
Mahto, P., Garg, P., Seth, P., & Panda, J. (2020) · SSRN Electronic Journal · Cited by 52
Wende, F., Cordes, F., & Steinke, T. (2012) · doi:10.1109/saahpc.2012.12 · Cited by 40 · cited 1×
“Furthermore, this study compares the use of two YOLO variants, YOLOv3 and YOLOv5, to obtain a real-time vehicle tracking method that can process multiple video streams with a single GPU, using multi-threading techniques [40].”
MethodPerformance of Fine-Tuning Convolutional Neural Networks for HEp-2 Image Classification
Taormina, V., Cascio, D., Abbene, L., & Raso, G. (2020) · Applied Sciences · doi:10.3390/app10196940 · Cited by 33 · cited 2×
“[45] used transfer learning-based fine-tuning techniques to train several pre-trained CNNs.”
MethodWang, H., Yu, Y., Cai, Y., Chen, L., & Chen, X. (2018) · Sensors · doi:10.3390/s18124109 · Cited by 31 · cited 1×
“[47] improved the performance of a deep belief network (DBN) using transfer learning.”
BackgroundReal-time vehicle detection and tracking in video based on faster R-CNN
Zhang, Y. J., Wang, J., & Yang, X. S. (2017) · Journal of Physics Conference Series · doi:10.1088/1742-6596/887/1/012068 · Cited by 27 · cited 1×
“[34] coupled the methods of Camshift [35] and the Kalman filter [36] along with a Faster-RCNN DL model [20] to detect and track vehicles in real time.”
MethodTransfer Learning-based Vehicle Classification
Jo, S. Y., Ahn, N., Lee, Y., & Kang, S. (2018) · International SoC Design Conference · doi:10.1109/isocc.2018.8649802 · Cited by 27 · cited 1×
“[48] improved the performance of a GoogLeNet CNN, Nezafat et al.”
MethodDu, L., Chen, W., Fu, S., Kong, H., Li, C., & Pei, Z. (2019) · International Conference on Transportation Information and Safety · doi:10.1109/ictis.2019.8883761 · Cited by 27 · cited 1×
“[24] proposed the real-time detection of vehicles and traffic lights with the YOLOv3 network, an improved version of YOLOv2, by detecting small objects with balanced speed and precision using a new, high-quality dataset named the Vehicle and Traffic Light Dataset (V-TLD).”
MethodObject Detection Algorithm for Surface Defects Based on a Novel YOLOv3 Model
Lv, N., Xiao, J. M., & Qiao, Y. (2022) · Processes · doi:10.3390/pr10040701 · Cited by 24 · cited 1×
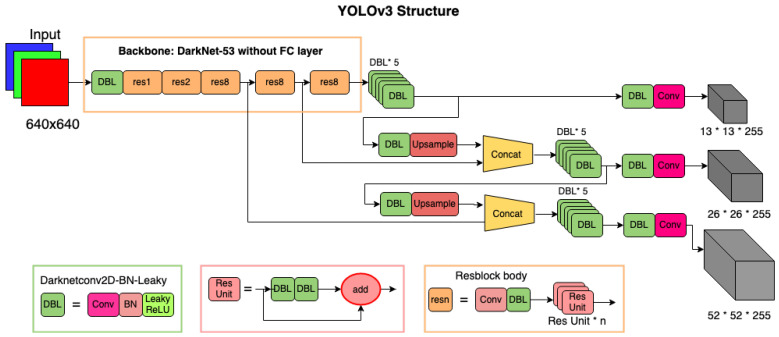
“Network architecture of YOLOv3 (adapted from [53] and modified) with a backbone of”
MethodClassification of truck body types using a deep transfer learning approach
Nezafat, R. V., Salahshour, B., & Cetin, M. (2018) · IEEE International Conference on Intelligent Transportation Systems (ITSC) · doi:10.1109/itsc.2018.8569514 · Cited by 20 · cited 1×
“[49] improved the performance of a ResNet CNN to classify truck body types into further classes, and Zhang et al.”
MethodWu, C.-W., Zhong, M.-T., Tsao, Y., Yang, S.-W., Chen, Y.-K., & Chien, S.-Y. (2017) · 2017 IEEE Conference on Computer Vision and Pattern Recognition Workshops (CVPRW) · doi:10.1109/cvprw.2017.184 · Cited by 18 · cited 1×
“Performance in this type of tracking depends on the quality of detection and occlusion [28] as a single camera provides a one-sided view.”
BackgroundLiu, T., & Liu, Y. (2021) · IEEE Access · doi:10.1109/access.2021.3091871 · Cited by 7 · cited 1×
“, in [39], proposed 3-D constrained multiple kernels, facilitated with Kalman filtering, to track objects detected by a YOLOv3 network.”
MethodSmoky Vehicle Detection Algorithm Based On Improved Transfer Learning
Zhang, G., Zhang, D., Lu, X., et al. (2019) · International Conference on Systems and Informatics (ICSAI) · doi:10.1109/icsai48974.2019.9010529 · Cited by 6 · cited 1×
“[50] improved the performance of DenseNet, NasNet, Inception, VGG19, and MobileNet CNNs.”
A Novel Vehicle Tracking Algorithm Using Video Image Processing
Wang, Y. (2018) · International Conference on Virtual Reality and Intelligent Systems (ICVRIS) · doi:10.1109/icvris.2018.00010 · Cited by 1 · cited 1×
“The Kalman filter is commonly used to match features and track objects with high accuracy [37].”
Method
Research works printed but not linked: 1
- Kouw, W.M., and Loog, M. (2018). An introduction to domain adaptation and transfer learning. arXiv.
Cited by
Object Detection in Traffic Videos: A Survey
Ghahremannezhad, H., Shi, H., & Liu, C. (2023) · IEEE Transactions on Intelligent Transportation Systems · doi:10.1109/tits.2023.3258683 · Cited by 141
Real Time Car Model and Plate Detection System by Using Deep Learning Architectures
Mustafa, T. S., & Karabatak, M. (2024) · IEEE Access · doi:10.1109/access.2024.3430857 · Cited by 44
“Third, we further explore false classifications within an VMMR classify system to find shortcomings in a system and information handling [10], [11].”
BackgroundSemantic Segmentation and YOLO Detector over Aerial Vehicle Images
Qureshi, A. M. (2024) · Computers, materials & continua/Computers, materials & continua (Print) · doi:10.32604/cmc.2024.052582 · Cited by 65
TranSDet: Toward Effective Transfer Learning for Small-Object Detection
Xu, X., Zhang, H., Ma, Y., Liu, K., Bao, H., & Xu, Q. (2023) · Remote Sensing · doi:10.3390/rs15143525 · Cited by 36
Shokri, D., Larouche, C., & Homayouni, S. (2023) · Smart Cities · doi:10.3390/smartcities6050134 · Cited by 32
Metadata
- Authors
- Neupane, B., Horanont, T., & Aryal, J.
- Affiliations
- Advanced Geospatial Technology Research Unit, Sirindhorn International Institute of Technology, 131 Moo 5, Tiwanon Road, Bangkadi, Mueang Pathum Thani 12000, Pathum Thani, Thailand
- School of Information, Computer, and Communication Technology (ICT), Sirindhorn International Institute of Technology, 131 Moo 5, Tiwanon Road, Bangkadi, Mueang Pathum Thani 12000, Pathum Thani, Thailand
- The University of Melbourne (AU)
- Corresponding author
- Horanont, Teerayut
- Venue
- Sensors
- Publisher
- MDPI AG
- Published
- 2022-05-18
- Volume
- 22
- Issue
- 10
- Pages
- 3813
- ISSN
- 1424-8220 (ISSN-L)
- PMC
- PMC9144024
- OpenAlex
- W4280527735
- Semantic Scholar
- 9ba2c82d9fe60eac659d461e72322e4c306b5184
- Cited by
- 85
- References
- 56
- Citations by year
- 2026: 8 · 2025: 19 · 2024: 28 · 2023: 23 · 2022: 7
- FWCI
- 6.30
- Type
- journal article
- Language
- en
- Open access
- gold
- doi.org
- Licence
- Locations
- Sensors (publishedVersion, cc-by)
- PubMed Central (publishedVersion, cc-by)
- PubMed (publishedVersion)
- DOAJ (DOAJ: Directory of Open Access Journals) (submittedVersion, cc-by-sa)
- Minerva Access (University of Melbourne) (submittedVersion, cc-by)
- Funders
- Thammasat University Research Fund under the TU Research Scholar (TUFT 88/2564, TUFF19/2564, TUFF24/2565)
- Thailand Science Research and Innovation Fundamental Fund (TUFT 88/2564, TUFF19/2564, TUFF24/2565)
- Topics
- Physical Sciences › Computer Science › Computer Vision and Pattern Recognition › Advanced Neural Network Applications
- Physical Sciences › Computer Science › Computer Vision and Pattern Recognition › Video Surveillance and Tracking Methods
- Physical Sciences › Engineering › Automotive Engineering › Autonomous Vehicle Technology and Safety
- Keywords
- vehicle classification, multi-vehicle tracking, real-time object detection, transfer learning, domain shift, YOLOv5, fine-tuning, vehicle speed estimation, intelligent transportation systems, training dataset construction
- MeSH terms
- Deep Learning, Algorithms, Humans, Neural Networks, Computer
About these checks
Registry, retraction, Cites and statistics results are computed, not judged, with one exception: a printed reference that no index lists is read once by a model before it counts as a citation error. Claims are extracted by a model and kept only when their quote appears verbatim in the text; each cited source is then checked, with a model’s help, for whether it says what the claim relies on. Those verdicts can be wrong — read the claim’s quote and the cited source before relying on one.
The claim verdicts this report counts are experimental: their accuracy is not yet measured.
A language model drew the claims from the paper on 2026-10-10, under version 3 of the claim definition (model deepseek-v4.1-flash, prompt extract-v3).
A second model labelled each claim on 2026-10-10 (model jev-1.13-20260917, definition revision gold-guideline-v0.2).
Cited sources are checked with a language model’s help (gpt-6-sol and qwen3.8-omni-flash).
Statistics and arithmetic are recomputed, not judged.
Confidence bands are shown only for fields calibrated on our annotated test set. None is calibrated yet, so no band is shown.
What counts as a claim ›How we measure confidence ›How we check this ›
Are you an author, or do you see a problem with this page? Request a review
Data sources
Bibliographic data: Semantic Scholar, OpenAlex, Crossref.
Contains information from the Semantic Scholar Academic Graph Datasets, made available under the ODC Attribution License (ODC-BY 1.0).
Semantic Scholar’s data is described in: Kinney, R., et al. (2023). The Semantic Scholar Open Data Platform. arXiv:2301.10140.
