

The DOI matches its Crossref record; 106 of the 107 references it cites were found in a registry or an index.
Methods in cognitive pupillometry: Design, preprocessing, and statistical analysis
Open accessPublished version of a preprint
Abstract
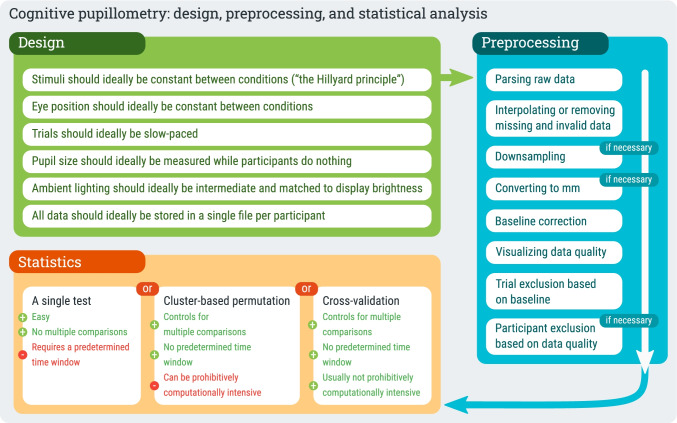
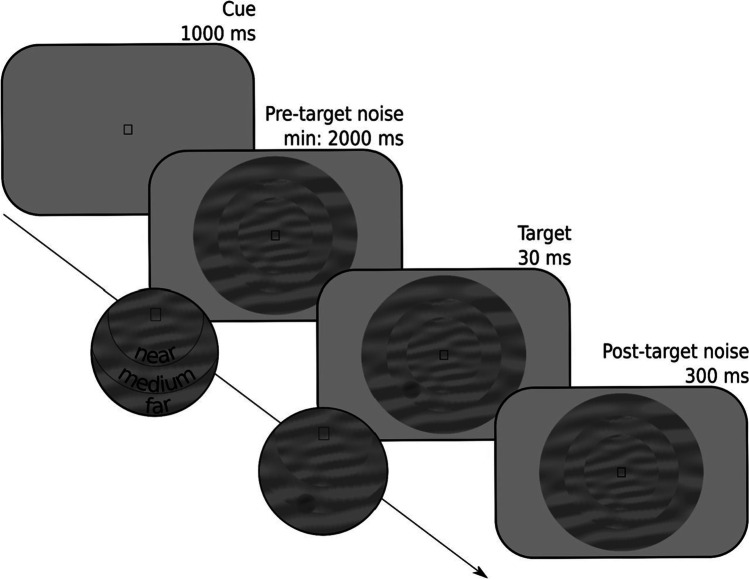
Cognitive pupillometry is the measurement of pupil size to investigate cognitive processes such as attention, mental effort, working memory, and many others. Currently, there is no commonly agreed-upon methodology for conducting cognitive-pupillometry experiments, and approaches vary widely between research groups and even between different experiments from the same group. This lack of consensus makes it difficult to know which factors to consider when conducting a cognitive-pupillometry experiment. Here we provide a comprehensive, hands-on guide to methods in cognitive pupillometry, with a focus on trial-based experiments in which the measure of interest is the task-evoked pupil response to a stimulus. We cover all methodological aspects of cognitive pupillometry: experimental design, preprocessing of pupil-size data, and statistical techniques to deal with multiple comparisons when testing pupil-size data. In addition, we provide code and toolboxes (in Python) for preprocessing and statistical analysis, and we illustrate all aspects of the proposed workflow through an example experiment and example scripts.
Overview
The claims and statistics of this paper haven’t been checked yet.
Run the check — free, no account needed. It reads the open-access text and checks the sources it cites.
Integrity signals
Registry
Cites
Statistics
Figures
Verification
Claims the paper makes
The claims and statistics of this paper haven’t been checked yet.
Run the check — free, no account needed. It reads the open-access text and checks the sources it cites.
Claims other papers make about this one
Each is checked against this paper’s own text: does it say what the citing paper says it does?
The cited source says what the claim attributes to it.
In the citing paper
“We did not preregister a specific time window to assess our hypotheses regarding the effect of expectancy on pupil sizes; thus, we use cross-validation to extract samples from the whole response time window as recommended by Mathôt and Vilotijević [39].”
From Predicting emotional valence in autism: a preregistered study in the Bayesian Brain framework (2026) · cites this paper as [39]
Self-check
Percentages, sums and reported differences re-computed from the paper’s own numbers.
The self-check needs the paper’s full text.
Citations
Cites
Random effects structure for confirmatory hypothesis testing: Keep it maximal
Barr, D. J., Levy, R., Scheepers, C., & Tily, H. J. (2013) · Journal of Memory and Language · doi:10.1016/j.jml.2012.11.001 · Cited by 10,328
Nonparametric statistical testing of EEG- and MEG-data
Maris, E., & Oostenveld, R. (2007) · Journal of Neuroscience Methods · doi:10.1016/j.jneumeth.2007.03.024 · Cited by 8,496
(2001) · doi:10.1017/cbo9780511546396 · Cited by 4,482
Aston-Jones, G., & Cohen, J. D. (2005) · Annual Review of Neuroscience · doi:10.1146/annurev.neuro.28.061604.135709 · Cited by 4,472
Circular analysis in systems neuroscience: the dangers of double dipping
Kriegeskorte, N., Simmons, W. K., Bellgowan, P. S. F., & Baker, C. I. (2009) · Nature Neuroscience · doi:10.1038/nn.2303 · Cited by 2,696
OpenSesame: An open-source, graphical experiment builder for the social sciences
Mathôt, S., Schreij, D., & Theeuwes, J. (2011) · Behavior Research Methods · doi:10.3758/s13428-011-0168-7 · Cited by 2,648
Self-citationThe pupil as a measure of emotional arousal and autonomic activation
Bradley, M. M., Miccoli, L., Escrig, M. A., & Lang, P. J. (2008) · Psychophysiology · doi:10.1111/j.1469-8986.2008.00654.x · Cited by 1,919
Pupil Diameter and Load on Memory
Kahneman, D., & Beatty, J. (1966) · Science · doi:10.1126/science.154.3756.1583 · Cited by 1,617
Power Analysis and Effect Size in Mixed Effects Models: A Tutorial
Brysbaert, M., & Stevens, M. (2018) · Journal of Cognition · doi:10.5334/joc.10 · Cited by 1,420
Joshi, S., Li, Y., Kalwani, R. M., & Gold, J. I. (2016) · Neuron · doi:10.1016/j.neuron.2015.11.028 · Cited by 1,387
The steady-state visual evoked potential in vision research: A review
Norcia, A. M., Appelbaum, L. G., Ales, J. M., Cottereau, B. R., & Rossion, B. (2015) · Journal of Vision · doi:10.1167/15.6.4 · Cited by 1,234
Pupil Size in Relation to Mental Activity during Simple Problem-Solving
Hess, E. H., & Polt, J. M. (1964) · Science · doi:10.1126/science.143.3611.1190 · Cited by 1,169
Bullmore, E. T., Suckling, J., Overmeyer, S., Rabe-Hesketh, S., Taylor, E., & Brammer, M. J. (1999) · IEEE Transactions on Medical Imaging · doi:10.1109/42.750253 · Cited by 1,088
Pupillometry: Psychology, Physiology, and Function
Mathôt, S. (2018) · Journal of Cognition · doi:10.5334/joc.18 · Cited by 925
Self-citationPupil Size as Related to Interest Value of Visual Stimuli
Hess, E. H., & Polt, J. M. (1960) · Science · doi:10.1126/science.132.3423.349 · Cited by 899
Gilzenrat, M. S., Nieuwenhuis, S., Jepma, M., & Cohen, J. D. (2010) · Cognitive Affective & Behavioral Neuroscience · doi:10.3758/cabn.10.2.252 · Cited by 873
Pupil diameter covaries with BOLD activity in human locus coeruleus
Murphy, P. R., O'Connell, R. G., O'Sullivan, M., Robertson, I. H., & Balsters, J. H. (2014) · Human Brain Mapping · doi:10.1002/hbm.22466 · Cited by 819
Event-Related Potentials: A Methods Handbook
Loiselle, D. L. (2006) · Neurology · doi:10.1212/01.wnl.0000217365.45426.9a · Cited by 772
Pupil fluctuations track fast switching of cortical states during quiet wakefulness
Reimer, J., Froudarakis, E., Cadwell, C. R., Yatsenko, D., Denfield, G. H., & Tolias, A. S. (2014) · Neuron · doi:10.1016/j.neuron.2014.09.033 · Cited by 717 · cited 2×
“Pupil size fluctuates in waves of several seconds that reflect the waxing and waning of arousal (Mathôt, Siebold, et al., 2015b; Reimer et al., 2014), and in slower waves that reflect more prolonged states of fatigue and wakefulness (Geacin-tov & Peavler, 1974; Lowenstein et al., 1963).”
Beatty, J. T., & Lucero-Wagoner, B. (2000) · Cited by 703
Preprocessing pupil size data: Guidelines and code
Kret, M. E., & Sjak-Shie, E. (2018) · Behavior Research Methods · doi:10.3758/s13428-018-1075-y · Cited by 476
Jepma, M., & Nieuwenhuis, S. (2010) · Journal of Cognitive Neuroscience · doi:10.1162/jocn.2010.21548 · Cited by 473
Sympathetic and parasympathetic innervation of pupillary dilation during sustained processing
Steinhauer, S. R., Siegle, G. J., Condray, R., & Pless, M. L. (2004) · International Journal of Psychophysiology · doi:10.1016/j.ijpsycho.2003.12.005 · Cited by 472
Pupil-linked arousal is driven by decision uncertainty and alters serial choice bias
Urai, A. E., Braun, A., & Donner, T. H. (2017) · Nature Communications · doi:10.1038/ncomms14637 · Cited by 466
Safe and sensible preprocessing and baseline correction of pupil-size data
Mathôt, S., Fabius, J. H., van Heusden, E., & der Stigchel, S. V. (2018) · Behavior Research Methods · doi:10.3758/s13428-017-1007-2 · Cited by 453
Self-citationPupil Response as an Indication of Effortful Listening: The Influence of Sentence Intelligibility
Zekveld, A., Kramer, S., & Festen, J. (2010) · Ear and Hearing · doi:10.1097/aud.0b013e3181d4f251 · Cited by 419
Decision-related pupil dilation reflects upcoming choice and individual bias
de Gee, J. W., Knapen, T. H. J., & Donner, T. H. (2014) · Proceedings of the National Academy of Sciences · doi:10.1073/pnas.1317557111 · Cited by 405
Dalmaijer, E. S., Mathôt, S., & der Stigchel, S. V. (2013) · Behavior Research Methods · doi:10.3758/s13428-013-0422-2 · Cited by 383
Self-citationA circuit for pupil orienting responses: implications for cognitive modulation of pupil size
Wang, C., & Munoz, D. P. (2015) · Current Opinion in Neurobiology · doi:10.1016/j.conb.2015.03.018 · Cited by 356
Winn, M. B., Wendt, D., Koelewijn, T., & Kuchinsky, S. E. (2018) · Trends in Hearing · doi:10.1177/2331216518800869 · Cited by 346
Pupillary dilation as a measure of attention: a quantitative system analysis
Hoeks, B., & Levelt, W. J. M. (1993) · Behavior Research Methods, Instruments, & Computers · doi:10.3758/bf03204445 · Cited by 345
Saccadic suppression: Elevation of visual threshold associated with saccadic eye movements
Zuber, B. L., & STARK, L. W. (1966) · Experimental Neurology · doi:10.1016/0014-4886(66)90087-2 · Cited by 341
Pupil dilation deconvolution reveals the dynamics of attention at high temporal resolution
Wierda, S. M., van Rijn, H., Taatgen, N., & Martens, S. (2012) · Proceedings of the National Academy of Sciences · doi:10.1073/pnas.1201858109 · Cited by 321
Dynamic modulation of decision biases by brainstem arousal systems
de Gee, J. W., Colizoli, O., Kloosterman, N. A., Knapen, T. H. J., Nieuwenhuis, S., & Donner, T. H. (2017) · eLife · doi:10.7554/elife.23232 · Cited by 312
The Eye Pupil Adjusts to Imaginary Light
Laeng, B., & Sulutvedt, U. (2013) · Psychological Science · doi:10.1177/0956797613503556 · Cited by 274
Attention to Bright Surfaces Enhances the Pupillary Light Reflex
Binda, P., Pereverzeva, M., & Murray, S. O. (2013) · Journal of Neuroscience · doi:10.1523/jneurosci.3440-12.2013 · Cited by 232
Pupil Dilation Uncovers Extra Listening Effort in the Presence of a Single-Talker Masker
Koelewijn, T., Zekveld, A. A., Festen, J. Μ., & Kramer, S. E. (2011) · Ear and Hearing · doi:10.1097/aud.0b013e3182310019 · Cited by 229
Mechanisms of reflex dilatation of the pupil
Loewenfeld, I. E. (1958) · Documenta Ophthalmologica · doi:10.1007/bf00913471 · Cited by 227
Mapping and correcting the influence of gaze position on pupil size measurements
Hayes, T. R., & Petrov, A. A. (2015) · Behavior Research Methods · doi:10.3758/s13428-015-0588-x · Cited by 225
The Pupillary Light Response Reveals the Focus of Covert Visual Attention
Mathôt, S., van der Linden, L., Grainger, J., & Vitu, F. (2013) · PLoS ONE · doi:10.1371/journal.pone.0078168 · Cited by 219
Self-citationKelbsch, C., Straßer, T., Chen, Y., Feigl, B., Gamlin, P. D., Kardon, R. H., Peters, T. M., Roecklein, K. A., Steinhauer, S. R., Szabadi, E., et al. (2019) · Frontiers in Neurology · doi:10.3389/fneur.2019.00129 · Cited by 212
Tracking the allocation of attention using human pupillary oscillations
Naber, M., Alvarez, G. A., & Nakayama, K. (2013) · Frontiers in Psychology · doi:10.3389/fpsyg.2013.00919 · Cited by 196
Cognitive and Ocular Factors Jointly Determine Pupil Responses under Equiluminance
Knapen, T. H. J., de Gee, J. W., Brascamp, J. W., Nuiten, S. A., Hoppenbrouwers, S. S., & Theeuwes, J. (2016) · PLoS ONE · doi:10.1371/journal.pone.0155574 · Cited by 183
Lowenstein, O. E., Feinberg, R. A., & Loewenfeld, I. E. (1963) · Defense Technical Information Center (DTIC) · Cited by 182
A novel blink detection method based on pupillometry noise
Hershman, R., Henik, A., & Cohen, N. (2018) · Behavior Research Methods · doi:10.3758/s13428-017-1008-1 · Cited by 179
Pupillary responses to stimulus structure, colour and movement
Barbur, J. L., Harlow, A. J., & Sahraie, A. (1992) · Ophthalmic and Physiological Optics · doi:10.1111/j.1475-1313.1992.tb00276.x · Cited by 169
Markwell, E. L., Feigl, B., & Zele, A. J. (2010) · Clinical and Experimental Optometry · doi:10.1111/j.1444-0938.2010.00479.x · Cited by 166
Pupil diameter measurement errors as a function of gaze direction in corneal reflection eyetrackers
Brisson, J., Mainville, M., Mailloux, D., Beaulieu, C., Serres, J., & Sirois, S. (2013) · Behavior Research Methods · doi:10.3758/s13428-013-0327-0 · Cited by 149
Pupil dilation betrays the timing of decisions
Einhäuser, W. (2010) · Frontiers in Human Neuroscience · doi:10.3389/fnhum.2010.00018 · Cited by 149
Pupil responses to high-level image content
Naber, M., & Nakayama, K. (2013) · Journal of Vision · doi:10.1167/13.6.7 · Cited by 147
The relationship between baseline pupil size and intelligence
Tsukahara, J. S., Harrison, T. L., & Engle, R. W. (2016) · Cognitive Psychology · doi:10.1016/j.cogpsych.2016.10.001 · Cited by 145
Pupil constrictions to photographs of the sun
Binda, P., Pereverzeva, M., & Murray, S. O. (2013) · Journal of Vision · doi:10.1167/13.6.8 · Cited by 142
Nash Unsworth, A., & Robison, M. K. (2014) · Psychonomic Bulletin & Review · doi:10.3758/s13423-014-0747-6 · Cited by 139
Systematic influence of gaze position on pupil size measurement: analysis and correction
Gagl, B., Hawelka, S., & Hutzler, F. (2011) · Behavior Research Methods · doi:10.3758/s13428-011-0109-5 · Cited by 135
Randomization tests for ERP topographies and whole spatiotemporal data matrices
Maris, E. (2003) · Psychophysiology · doi:10.1111/j.1469-8986.2003.00139.x · Cited by 132
The dependence of pupil size upon external light stimulus under static and variable conditions
Crawford, B. H. (1936) · Proceedings of the Royal Society B Biological Sciences · doi:10.1098/rspb.1936.0072 · Cited by 126
GazeR: A Package for Processing Gaze Position and Pupil Size Data
Geller, J., Mirman, D., Mahr, T., & Winn, M. (2020) · Behavior Research Methods · doi:10.3758/s13428-020-01374-8 · Cited by 123
Graded recruitment of pupil-linked neuromodulation by parametric stimulation of the vagus nerve
Mridha, Z., de Gee, J. W., Shi, Y., Alkashgari, R., Williams, J. C., Suminski, A. J., Ward, M. P., Zhang, W., & McGinley, M. J. (2021) · Nature Communications · doi:10.1038/s41467-021-21730-2 · Cited by 119
Spatial attention increases the pupillary response to light changes
Binda, P., & Murray, S. O. (2015) · Journal of Vision · doi:10.1167/15.2.1 · Cited by 109
Sexual arousal: The correspondence of eyes and genitals
Rieger, G., Cash, B. M., Merrill, S. M., Rounds, J. D., Dharmavaram, S., & Savin‐Williams, R. C. (2014) · Biological Psychology · doi:10.1016/j.biopsycho.2014.11.009 · Cited by 106
Pupillary Responses to Words That Convey a Sense of Brightness or Darkness
Mathôt, S., Jonathan Grainger, B., & Strijkers, K. (2017) · Psychological Science · doi:10.1177/0956797617702699 · Cited by 104
Self-citationReilly, J. J., Kelly, A. E., Kim, S. H., Jett, S., & Zuckerman, B. M. (2018) · Behavior Research Methods · doi:10.3758/s13428-018-1134-4 · Cited by 103
Pupil responses allow communication in locked-in syndrome patients
Stoll, J., Chatelle, C., Carter, O. L., Christof Koch, A., Laureys, S., & Wolfgang Einhäuser, A. (2013) · Current Biology · doi:10.1016/j.cub.2013.06.011 · Cited by 102
Modulation of stimulus contrast on the human pupil orienting response
Wang, C., & Munoz, D. P. (2014) · European Journal of Neuroscience · doi:10.1111/ejn.12641 · Cited by 99
The pupillary light response reflects exogenous attention and inhibition of return
Mathôt, S., Dalmaijer, E. S., Jonathan Grainger, B., & der Stigchel, S. V. (2014) · Journal of Vision · doi:10.1167/14.14.7 · Cited by 96
Self-citationThe impact of luminance on tonic and phasic pupillary responses to sustained cognitive load
Peysakhovich, V., Vachon, F., & Dehais, F. (2016) · International Journal of Psychophysiology · doi:10.1016/j.ijpsycho.2016.12.003 · Cited by 88
Kingdom, F. A. A., & Prins, N. (2016) · Elsevier eBooks · doi:10.1016/b978-0-12-407156-8.00001-3 · Cited by 83
A simple way to reconstruct pupil size during eye blinks
Mathôt, S. (2013) · Figshare · doi:10.6084/m9.figshare.688001 · Cited by 82
Self-citationFrom pre-processing to advanced dynamic modeling of pupil data
Fink, L., Simola, J., Tavano, A., Lange, E. B., Wallot, S., & Laeng, B. (2023) · Behavior Research Methods · doi:10.3758/s13428-023-02098-1 · Cited by 80
Modulation of the pupillary response by the content of visual working memory
Zokaei, N., Alexander Board, Manohar, S., & Nobre, A. C. (2019) · Proceedings of the National Academy of Sciences · doi:10.1073/pnas.1909959116 · Cited by 74
A bias-free measure of retinotopic tilt adaptation
Morgan, M. J. (2014) · Journal of Vision · doi:10.1167/4.1.7 · Cited by 71
Spatial pattern as a stimulus to the pupillary system
Ukai, K. (1985) · Journal of the Optical Society of America A · doi:10.1364/josaa.2.001094 · Cited by 66
Changes in pupil diameter entrained by cortically initiated changes in attention
DANIELS, L. B., Nichols, D. F., SEIFERT, M. S., & Hock, H. S. (2012) · Visual Neuroscience · doi:10.1017/s0952523812000077 · Cited by 64
Saccadic suppression of the pupillary light reflex
Zuber, B. L., STARK, L. W., & Lorber, M. (1966) · Experimental Neurology · doi:10.1016/0014-4886(66)90120-8 · Cited by 63
Aminihajibashi, S., Hagen, T., Foldal, M. D., Laeng, B., & Espeseth, T. (2019) · International Journal of Psychophysiology · doi:10.1016/j.ijpsycho.2019.03.007 · Cited by 63
Visual acuity measured with pupil responses to checkerboard stimuli.
Slooter, J. H., & Norren, D. V. (1980) · PubMed · Cited by 62
Background luminance effects on pupil size associated with emotion and saccade preparation
Cherng, Y., Baird, T., Chen, J., & Wang, C. (2020) · Scientific Reports · doi:10.1038/s41598-020-72954-z · Cited by 60
The effect of pupil size and peripheral brightness on detection and discrimination performance
Mathôt, S., & Ivanov, Y. (2019) · PeerJ · doi:10.7717/peerj.8220 · Cited by 54
Self-citationHong, S., Narkiewicz, J., & Kardon, R. H. (2001) · PubMed · Cited by 52
CHAP: Open-source software for processing and analyzing pupillometry data
Hershman, R., Henik, A., & Cohen, N. (2019) · Behavior Research Methods · doi:10.3758/s13428-018-01190-1 · Cited by 52
Gaze-angle dependency of pupil-size measurements in head-mounted eye tracking
Petersch, B., & Dierkes, K. (2021) · Behavior Research Methods · doi:10.3758/s13428-021-01657-8 · Cited by 49
Large pupils predict goal-driven eye movements.
Mathôt, S., Siebold, A., Donk, M., & Vitu, F. (2015) · Journal of Experimental Psychology General · doi:10.1037/a0039168 · Cited by 46
Self-citationThe contribution of temporal analysis of pupillometry measurements to cognitive research
Hershman, R., Milshtein, D., & Henik, A. (2022) · Psychological Research · doi:10.1007/s00426-022-01656-0 · Cited by 42
Background light intensity and the pupillary response in a reaction time task
Bradshaw, J. L. (1969) · Psychonomic Science · doi:10.3758/bf03329118 · Cited by 38
Pajkossy, P., Szöllősi, Á., Demeter, G., & Racsmány, M. (2017) · Psychophysiology · doi:10.1111/psyp.12964 · Cited by 38
Ormerod, K. L., George, N., Fraser, J. A., Wainwright, C. E., & Hugenholtz, P. (2015) · PeerJ · doi:10.7717/peerj.1223 · Cited by 36
Parallel graded attention in reading: A pupillometric study
Snell, J., Mathôt, S., Mirault, J., & Jonathan Grainger, B. (2018) · Scientific Reports · doi:10.1038/s41598-018-22138-7 · Cited by 36
Self-citationIntrasaccadic perception triggers pupillary constriction
Mathôt, S., Melmi, J.-B., & Castet, É. (2015) · PeerJ · doi:10.7717/peerj.1150 · Cited by 35
Self-citationBrocher, A., Harbecke, R., Graf, T., Memmert, D., & Hüttermann, S. (2018) · Behavior Research Methods · doi:10.3758/s13428-018-1033-8 · Cited by 35
Differences in Auditory Distraction between Adults and Children: A Duplex-mechanism Approach
Joseph, T. N., Hughes, R. W., Sörqvist, P., & Marsh, J. E. (2018) · Journal of Cognition · doi:10.5334/joc.15 · Cited by 32
Pupillography in industrial fatigue assessment.
Geacintov, T., & Peavler, W. S. (1974) · Journal of Applied Psychology · doi:10.1037/h0036529 · Cited by 31
Touch-induced pupil size reflects stimulus intensity, not subjective pleasantness
van Hooijdonk, R., Mathôt, S., Schat, E., Spencer, H., der Stigchel, S. V., & Dijkerman, H. C. (2018) · Experimental Brain Research · doi:10.1007/s00221-018-5404-2 · Cited by 31
Self-citationSubjective and pupil responses to discomfort glare from small, high-luminance light sources
Tyukhova, Y., & Waters, C. (2018) · Lighting Research & Technology · doi:10.1177/1477153518772000 · Cited by 30
The pupillary light response reflects visual working memory content.
Hustá, C., Dalmaijer, E. S., Belopolsky, A. V., & Mathôt, S. (2019) · Journal of Experimental Psychology Human Perception & Performance · doi:10.1037/xhp0000689 · Cited by 29
Self-citationThe confounding effects of eye blinking on pupillometry, and their remedy
Yoo, K., Ahn, J., & Lee, S. (2021) · PLoS ONE · doi:10.1371/journal.pone.0261463 · Cited by 29
Pupillary correlates of covert shifts of attention during working memory maintenance
Unsworth, N., & Robison, M. (2017) · Attention, Perception, & Psychophysics · doi:10.3758/s13414-016-1272-7 · Cited by 27
PuPl: an open-source tool for processing pupillometry data
Kinley, I., & Levy, Y. (2021) · Behavior Research Methods · doi:10.3758/s13428-021-01717-z · Cited by 26
Is working memory capacity related to baseline pupil diameter?
Nash Unsworth, A., Miller, A. L., & Robison, M. K. (2020) · Psychonomic Bulletin & Review · doi:10.3758/s13423-020-01817-5 · Cited by 23
Arousal-based pupil modulation is dictated by luminance
Pan, J., Klímová, M., McGuire, J. T., & Ling, S. (2022) · Scientific Reports · doi:10.1038/s41598-022-05280-1 · Cited by 22
(2016) · doi:10.1016/c2012-0-01278-1 · Cited by 21
Bowman, H., Brooks, J. L., Hajilou, O., Zoumpoulaki, A., & Vladimir Litvak, A. (2020) · PLoS Computational Biology · doi:10.1371/journal.pcbi.1008286 · Cited by 19
Interactions Between Visual Working Memory, Attention, and Color Categories: A Pupillometry Study
Wilschut, T., & Mathôt, S. (2022) · Journal of Cognition · doi:10.5334/joc.208 · Cited by 18
Self-citationPupil Dilation Reflects Task Relevance Prior to Search
Olmos-Solis, K., van Loon, A. M., & Olivers, C. N. L. (2018) · Journal of Cognition · doi:10.5334/joc.12 · Cited by 17
Emphasis on peripheral vision is accompanied by pupil dilation
Vilotijević, A., & Mathôt, S. (2023) · Psychonomic Bulletin & Review · doi:10.3758/s13423-023-02283-5 · Cited by 16
Self-citationSafe and sensible baseline correction of pupil-size dataPreprint
Mathôt, S., Fabius, J. H., van Heusden, E., & der Stigchel, S. V. (2017) · doi:10.7287/peerj.preprints.2725v1 · Cited by 14
Self-citationA Primer on Design and Data Analysis for Cognitive PupillometryPreprint
Reilly, J. J., Zuckerman, B. M., & Kelly, A. E. (2021) · doi:10.31234/osf.io/j6sdt · Cited by 4
Research works printed but not linked: 2
- Van de Kraats, J., Smit, E. P., & Slooter, J. H. (1977). Objective perimetric measurements by the pupil balance method. Documenta Ophthalmologica Proceedings Series, 14, 213–219.
- Vilotijević, A., & Mathôt, S. (2022). Covert shifts of attention towards the visual periphery induce pupil dilation (p. 2022.07.14.500035). bioRxiv. https://doi.org/10.1101/2022.07.14.500035 · DOI
Cited by
Sorted by citations
Neurobehavioral meaning of pupil size
Grujic, N., Polanía, R., & Burdakov, D. (2024) · Neuron · doi:10.1016/j.neuron.2024.05.029 · Cited by 108
(2013) · Natural language processing · doi:10.1075/nlp · Cited by 76
From pre-processing to advanced dynamic modeling of pupil data
Fink, L., Simola, J., Tavano, A., Lange, E. B., Wallot, S., & Laeng, B. (2023) · Behavior Research Methods · doi:10.3758/s13428-023-02098-1 · Cited by 80
The fundamentals of eye tracking part 2: From research question to operationalization
Hooge, I. T. C., Nuthmann, A., Nyström, M., Niehorster, D. C., Holleman, G. A., Andersson, R., & Hessels, R. S. (2025) · Behavior Research Methods · doi:10.3758/s13428-024-02590-2 · Cited by 69
Noradrenaline tracks emotional modulation of attention in human amygdala
Bang, D., Luo, Y., Barbosa, L. S., Batten, S. R., Hadj-Amar, B., Twomey, T., Melville, N., White, J. P., Torres, A. S., Celaya, X., et al. (2023) · Current Biology · doi:10.1016/j.cub.2023.09.074 · Cited by 43
Metadata
- Authors
- Mathôt, S., & Vilotijević, A.
- Affiliations
- University of Groningen (NL)
- Corresponding author
- Mathôt, Sebastiaan
- Venue
- Behavior Research Methods
- Published
- 2022-08-26
- Volume
- 55
- Issue
- 6
- Pages
- 3055-3077
- ISSN
- 1554-351X (ISSN-L)
- 1554-3528
- PMC
- PMC10556184
- OpenAlex
- W4293794846
- Cited by
- 235
- References
- 107
- Citations by year
- 2026: 65 · 2025: 95 · 2024: 46 · 2023: 22 · 2022: 5
- FWCI
- 20.78
- Type
- journal article
- Language
- en
- Open access
- hybrid
- doi.org
- Locations
- Behavior Research Methods (publishedVersion, cc-by)
- bioRxiv (Cold Spring Harbor Laboratory) (acceptedVersion, cc-by)
- PubMed Central (publishedVersion, cc-by)
- PubMed (publishedVersion)
- University of Groningen research database (University of Groningen / Centre for Information Technology) (submittedVersion, cc-by)
- OSF Preprints (OSF Preprints) (submittedVersion)
- Funders
- Nederlandse Organisatie voor Wetenschappelijk Onderzoek (VI.Vidi.191.045)
- Topics
- Physical Sciences › Computer Science › Human-Computer Interaction › Gaze Tracking and Assistive Technology
- Life Sciences › Neuroscience › Cognitive Neuroscience › Neural and Behavioral Psychology Studies
- Social Sciences › Human Factors and Ergonomics › Human-Automation Interaction and Safety
- Keywords
- pupil size, experimental design, multiple comparisons, statistical analysis, attention, cognitive effort, working memory, Python library
- MeSH terms
- Attention, Cognition, Humans, Memory, Short-Term, Pupil, Research Design
About these checks
Registry, retraction, Cites and statistics results are computed, not judged, with one exception: a printed reference that no index lists is read once by a model before it counts as a citation error. Claims are extracted by a model and kept only when their quote appears verbatim in the text; each cited source is then checked, with a model’s help, for whether it says what the claim relies on. Those verdicts can be wrong — read the claim’s quote and the cited source before relying on one.
Statistics and arithmetic are recomputed, not judged.
Confidence bands are shown only for fields calibrated on our annotated test set. None is calibrated yet, so no band is shown.
What counts as a claim ›How we measure confidence ›How we check this ›
Are you an author, or do you see a problem with this page? Request a review
