

The DOI matches its Crossref record; 45 of the 45 references it cites were found in a registry or an index.
M2 Phenotype Microglia-derived Cytokine Stimulates Proliferation and Neuronal Differentiation of Endogenous Stem Cells in Ischemic Brain
Abstract
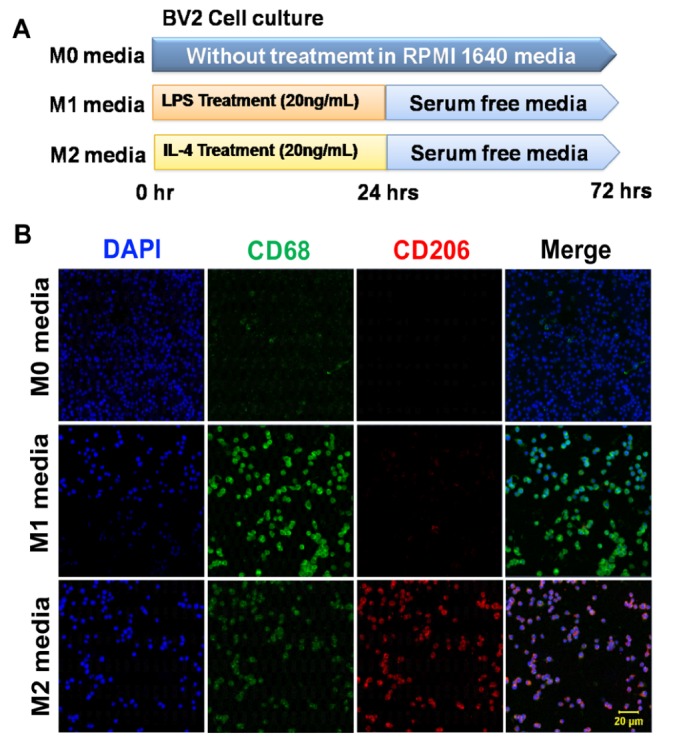
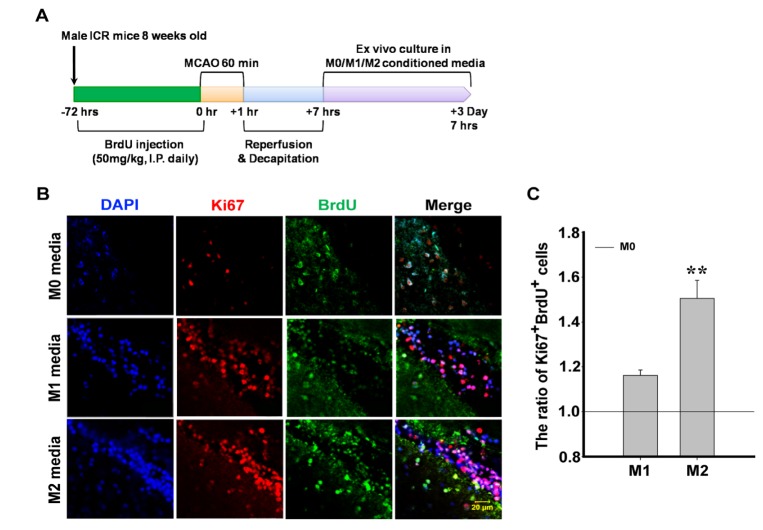
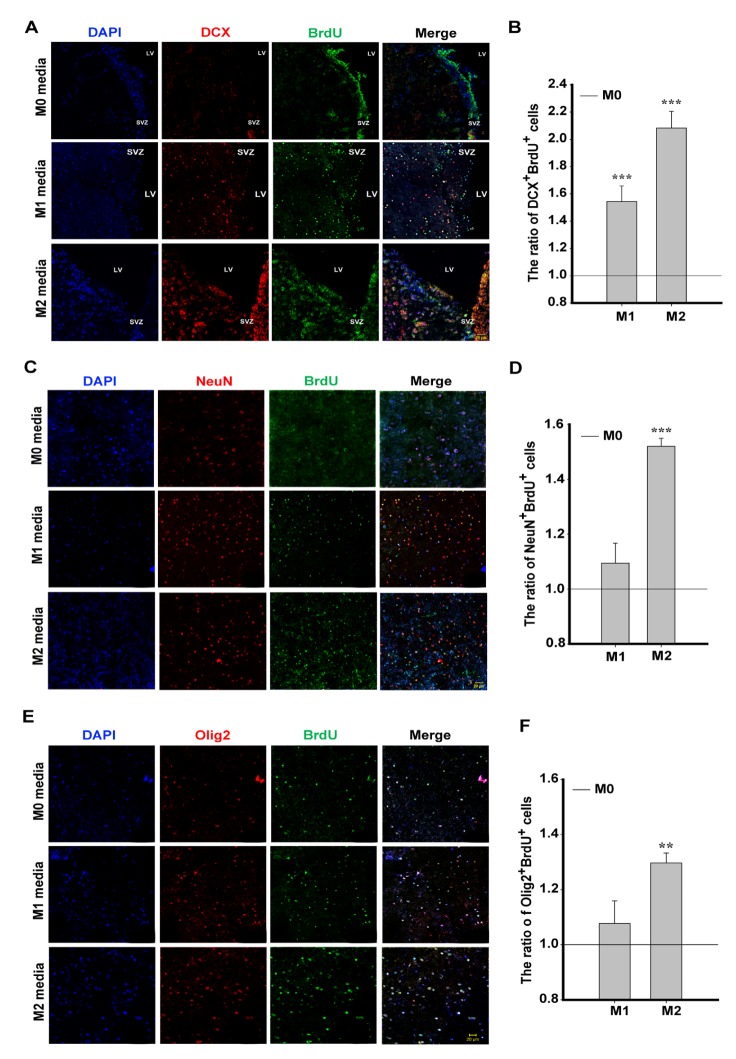
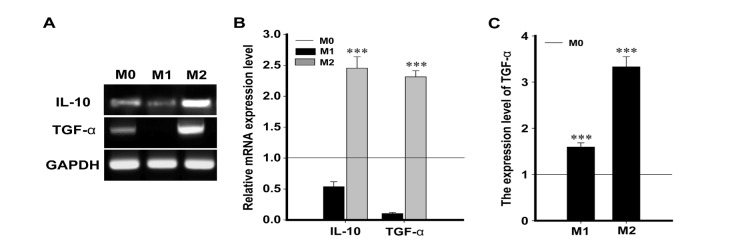
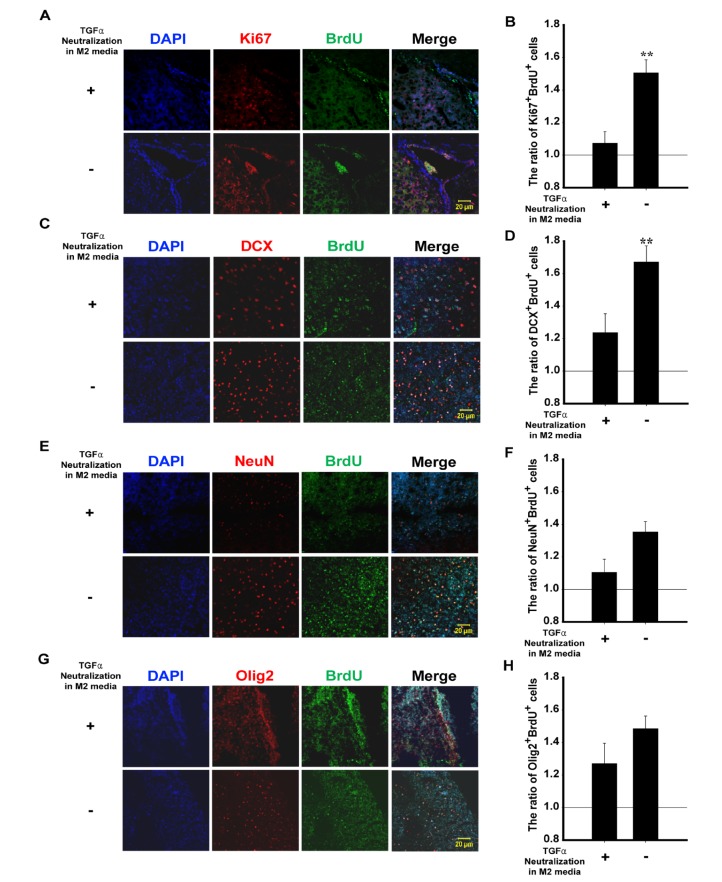
Microglia play a key role in the immune response and inflammatory reaction that occurs in response to ischemic stroke.Activated microglia promote neuronal damage or protection in injured brain tissue.Extracellular signals polarize the microglia towards the M1/M2 phenotype.The M1/M2 phenotype microglia released pro-and anti-inflammatory cytokines which induce the activation of neural stem/progenitor cells (NSPCs).In this study, we investigated how the cytokines released by microglia affect the activation of NSPCs.First, we treated BV2 cells with a lipopolysaccharide (LPS; 20 ng/ml) for M1 phenotype microglia and interleukin-4 (IL-4; 20 ng/ml) for M2 phenotype microglia in BV2 cells.Mice were subjected to transient middle cerebral artery occlusion (tMCAO) for 1 h.In ex vivo, brain sections containing the subventricular zone (SVZ) were cultured in conditioned media of M1 and M2 phenotypeconditioned media for 3 d.We measured the expression of cytokines in the conditioned media by RT-PCR and ELISA.The M2 phenotype microglia-conditioned media led to the proliferation and neural differentiation of NSPCs in the ipsilateral SVZ after ischemic stroke.The RT-PCR and ELISA results showed that the expression of TGF-α mRNA was significantly higher in the M2 phenotype microglia-conditioned media.These data support that M2 phenotype microglia-derived TGF-α is one of the key factors to enhance proliferation and neural differntiation of NSPCs after ischemic stroke.
Overview
The claims and statistics of this paper haven’t been checked yet.
Run the check — free, no account needed. It reads the open-access text and checks the sources it cites.
Integrity signals
Registry
Cites
Statistics
Figures
Verification
Claims the paper makes
The claims and statistics of this paper haven’t been checked yet.
Run the check — free, no account needed. It reads the open-access text and checks the sources it cites.
Claims other papers make about this one
Each is checked against this paper’s own text: does it say what the citing paper says it does?
The source backs part of the claim, not all of it — or backs it for a different population, condition or comparison.
In the citing paper
“IL-4-stimulated microglia could enhance NSC proliferation and differentiation following IS via TGF-α delivery [15].”
From M2 microglia-derived small extracellular vesicles modulate NSC fate after ischemic stroke via miR-25-3p/miR-93-5p-TGFBR/PTEN/FOXO3 axis (2025) · cites this paper as [15]
Experimental — accuracy not yet measured
Self-check
Percentages, sums and reported differences re-computed from the paper’s own numbers.
The self-check needs the paper’s full text.
Citations
Cites
Polazzi, E., Mengoni, I., Caprini, M., Peña-Altamira, E., Kurtys, E., & Monti, B. (2013) · Neurosignals · doi:10.1159/000337115 · Cited by 8,994
Monocyte and macrophage heterogeneity
Gordon, S., & Taylor, P. R. (2005) · Nature Reviews Immunology · doi:10.1038/nri1733 · Cited by 5,190
Microglia: Active sensor and versatile effector cells in the normal and pathologic brain
Hanisch, U.-K., & Kettenmann, H. (2007) · Nature Neuroscience · doi:10.1038/nn1997 · Cited by 3,676
A simple method for organotypic cultures of nervous tissue
Stoppini, L., Buchs, P.-A., & Muller, D. (1991) · Journal of Neuroscience Methods · doi:10.1016/0165-0270(91)90128-m · Cited by 3,089
Inflammatory Blockade Restores Adult Hippocampal Neurogenesis
Monje, M. L., Toda, H., & Palmer, T. D. (2003) · Science · doi:10.1126/science.1088417 · Cited by 2,426
Inflammation is detrimental for neurogenesis in adult brain
Ekdahl, C. T., Claasen, J.-H., Bonde, S., Kokaia, Z., & Lindvall, O. (2003) · Proceedings of the National Academy of Sciences · doi:10.1073/pnas.2234031100 · Cited by 1,559
The development of neural stem cells
Temple, S. (2001) · Nature · doi:10.1038/35102174 · Cited by 1,491
Microglial cell origin and phenotypes in health and disease
Saijo, K., & Glass, C. K. (2011) · Nature Reviews Immunology · doi:10.1038/nri3086 · Cited by 1,100
Immortalization of murine microglial cells by a v-raf / v-myc carrying retrovirus
Blasi, E., Barluzzi, R., Bocchini, V., Mazzolla, R., & Bistoni, F. (1990) · Journal of Neuroimmunology · doi:10.1016/0165-5728(90)90073-v · Cited by 1,076
Alternatively activated macrophages produce catecholamines to sustain adaptive thermogenesis
Nguyen, K. D., Qiu, Y., Cui, X., Goh, Y. P. S., Mwangi, J., David, T., Mukundan, L., Brombacher, F., Locksley, R. M., & Chawla, A. (2011) · Nature · doi:10.1038/nature10653 · Cited by 1,038
Heterogeneity of Microglial Activation in the Innate Immune Response in the Brain
Colton, C. A. (2009) · Journal of Neuroimmune Pharmacology · doi:10.1007/s11481-009-9164-4 · Cited by 917
Microglia and neurodegeneration: The role of systemic inflammation
Cunningham, C. (2013) · Glia · doi:10.1002/glia.22350 · Cited by 769
Unravelling mononuclear phagocyte heterogeneity
Geissmann, F., Gordon, S., Hume, D. A., Mowat, A. M., & Randolph, G. J. (2010) · Nature reviews. Immunology · doi:10.1038/nri2784 · Cited by 554
Control of Macrophage Activation and Function by PPARs
Chawla, A. (2010) · Circulation Research · doi:10.1161/circresaha.110.216523 · Cited by 531
Perego, C., Fumagalli, S., & De Simoni, M.-G. (2011) · Journal of Neuroinflammation · doi:10.1186/1742-2094-8-174 · Cited by 506
Microglia Enhance Neurogenesis and Oligodendrogenesis in the Early Postnatal Subventricular Zone
Shigemoto-Mogami, Y., Hoshikawa, K., Goldman, J. E., Sekino, Y., & Sato, K. (2014) · The Journal of Neuroscience · doi:10.1523/jneurosci.1619-13.2014 · Cited by 505
Regulation of neurogenesis by growth factors and neurotransmitters
Cameron, H. A., Hazel, T. G., & McKay, R. D. G. (1998) · Journal of Neurobiology · doi:10.1002/(sici)1097-4695(199808)36:2<287::aid-neu13>3.0.co;2-b · Cited by 494
Mittelbronn, M., Dietz, K., Schluesener, H. J., & Meyermann, R. (2001) · Acta Neuropathologica · doi:10.1007/s004010000284 · Cited by 482
Microglia instruct subventricular zone neurogenesis
Walton, N. M., Sutter, B. M., Laywell, E. D., Levkoff, L. H., Kearns, S. M., Marshall, G. P., Scheffler, B., & Steindler, D. A. (2006) · Glia · doi:10.1002/glia.20419 · Cited by 403
Cross-talk between neural stem cells and immune cells: the key to better brain repair?
Kokaia, Z., Martino, G., Schwartz, M., & Lindvall, O. (2012) · Nature Neuroscience · doi:10.1038/nn.3163 · Cited by 320
Adult Neurogenesis and the Ischemic Forebrain
Lichtenwalner, R. J., & Parent, J. M. (2006) · Journal of Cerebral Blood Flow & Metabolism · doi:10.1038/sj.jcbfm.9600170 · Cited by 281
Cell adhesion molecules and ischemic stroke
Yılmaz, G., & Granger, D. N. (2008) · Neurological Research · doi:10.1179/174313208x341085 · Cited by 276
Ortega, F., Gascón, S., Masserdotti, G., Deshpande, A., Simon, C., Fischer, J., Dimou, L., Chichung Lie, D., Schroeder, T., & Berninger, B. (2013) · Nature Cell Biology · doi:10.1038/ncb2736 · Cited by 247
Cacci, E., Ajmone‐Cat, M. A., Anelli, T., Biagioni, S., & Minghetti, L. (2008) · Glia · doi:10.1002/glia.20616 · Cited by 228
Neural progenitor cells regulate microglia functions and activity
Mosher, K. I., Andres, R. H., Fukuhara, T., Bieri, G., Hasegawa‐Moriyama, M., He, Y., Guzman, R. G., & Wyss‐Coray, T. (2012) · Nature Neuroscience · doi:10.1038/nn.3233 · Cited by 223
Microglial Activation – Tuning and Pruning Adult Neurogenesis
Ekdahl, C. T. (2012) · Frontiers in Pharmacology · doi:10.3389/fphar.2012.00041 · Cited by 218
Lai, A. Y., & Todd, K. G. (2006) · Canadian Journal of Physiology and Pharmacology · doi:10.1139/y05-143 · Cited by 202
Effects of Microglia on Neurogenesis
Sato, K. (2015) · Glia · doi:10.1002/glia.22858 · Cited by 187
The microglial-motoneuron dialogue in ALS.
Appel, S. H., Zhao, W., Beers, D. R., & Henkel-Tigges, J. (2011) · Europe PMC (PubMed Central) · Cited by 179
Cooper, O., & Ole Isacson, A. (2004) · Journal of Neuroscience · doi:10.1523/jneurosci.2344-04.2004 · Cited by 167
Chemokines Promote Quiescence and Survival of Human Neural Progenitor Cells
Krathwohl, M. D., & Kaiser, J. L. (2004) · Stem Cells · doi:10.1634/stemcells.22-1-109 · Cited by 166
Kornblum, H. I., Hussain, R., Bronstein, J. M., Gall, C. M., Lee, D. C., & Seroogy, K. B. (1997) · The Journal of Comparative Neurology · doi:10.1002/(sici)1096-9861(19970407)380:2<230::aid-cne6>3.0.co;2-4 · Cited by 159
Experimental Antileukocyte Interventions in Cerebral Ischemia
Härtl, R., Schürer, L., Schmid‐Schönbein, G. W., & del Zoppo, G. J. (1996) · Journal of Cerebral Blood Flow & Metabolism · doi:10.1097/00004647-199611000-00004 · Cited by 156
Challenges for Brain Repair: Insights from Adult Neurogenesis in Birds and Mammals
Doetsch, F. K., & Scharff, C. (2001) · Brain Behavior and Evolution · doi:10.1159/000057572 · Cited by 151
The role of the microglia in acute CNS injury
Kawabori, M., & Yenari, M. A. (2014) · Metabolic Brain Disease · doi:10.1007/s11011-014-9531-6 · Cited by 145
Novel Effector Molecules in Type 2 Inflammation: Lessons Drawn from Helminth Infection and Allergy
Nair, M. G., Guild, K. J., & Artis, D. (2006) · The Journal of Immunology · doi:10.4049/jimmunol.177.3.1393 · Cited by 130
Microglial polarization and plasticity: Evidence from organotypic hippocampal slice cultures
Ajmone‐Cat, M. A., Mancini, M., Simone, R. D., Cilli, P., & Minghetti, L. (2013) · Glia · doi:10.1002/glia.22550 · Cited by 114
Differential activation of microglia in neurogenic versus non‐neurogenic regions of the forebrain
Goings, G. E., Kozlowski, D. A., & Szele, F. G. (2006) · Glia · doi:10.1002/glia.20381 · Cited by 110
Roles of transforming growth factor-α and related molecules in the nervous system
Xian, C. J., & Zhou, X. (1999) · Molecular Neurobiology · doi:10.1007/bf02742440 · Cited by 83
Activated microglia enhance neurogenesis via trypsinogen secretion
Nikolakopoulou, A. M., Dutta, R., Chen, Z., Miller, R. H., & Trapp, B. D. (2013) · Proceedings of the National Academy of Sciences · doi:10.1073/pnas.1218856110 · Cited by 83
Zerlin, M., Milosevic, A., & Goldman, J. E. (2004) · Developmental Biology · doi:10.1016/j.ydbio.2004.02.024 · Cited by 69
Transforming growth factor α induces angiogenesis and neurogenesis following stroke
Leker, R. R., Tóth, Z., Shahar, T., Cassiani‐Ingoni, R., Szalayova, I., Key, S., Bratincsák, A., & Mezey, É. (2009) · Neuroscience · doi:10.1016/j.neuroscience.2009.05.050 · Cited by 68
Justicia, C., Pérez-Asensio, F. J., Burguete, M. C., Salom, J. B., & Planas, A. M. (2001) · Journal of Cerebral Blood Flow & Metabolism · doi:10.1097/00004647-200109000-00007 · Cited by 63
Kim, J. H., Lee, Y. W., Park, K. A., Lee, W. T., & Lee, J. E. (2009) · Journal of Cerebral Blood Flow & Metabolism · doi:10.1038/jcbfm.2009.260 · Cited by 60
Self-citationExtrinsic and Intrinsic Factors Governing Cell Fate in Cortical Progenitor Cultures
Irvin, D. K., Dhaka, A., Hicks, C. D., Weinmaster, G., & Kornblum, H. I. (2003) · Developmental Neuroscience · doi:10.1159/000072265 · Cited by 43
Research works printed but not linked: 2
- Appel, 2011, Acta Myol, 30, 4
- Kornblum, 1997, J Comp Neurol, 380, 243, 10.1002/(SICI)1096-9861(19970407)380:2<243::AID-CNE7>3.0.CO;2-3 · DOI
Cited by
Mitochondria-Targeted Therapeutics for Alzheimer's Disease: The Good, the Bad, the Potential
Mi, Y., Qi, G., Brinton, R. D., & Yin, F. (2021) · Antioxidants & Redox Signaling · doi:10.1089/ars.2020.8070 · Cited by 43
Zhang, Q., Yi, Y., Chen, T., Ai, Y., Chen, Z., Liu, G., Tang, Z., Chen, J., Xu, T., Chen, X., et al. (2025) · Journal of Nanobiotechnology · doi:10.1186/s12951-025-03390-2 · Cited by 27
Neurogenesis and Neuroinflammation in Dialogue: Mapping Gaps, Modulating Microglia, Rewiring Aging
Tanaka, M. (2026) · Cells · doi:10.3390/cells15010078 · Cited by 11
“M2-polarized M2-polarized microglia in particular foster neuronal differentiation and synaptic maturation, underscoring their capacity to translate systemic and local signals into pro-neurogenic outcomes [147–149].”
Metadata
- Authors
- Choi, J. Y., Kim, J. Y., Kim, J. Y., Park, J., Lee, W. T., & Lee, J. E.
- Affiliations
- Department of Anatomy, Yonsei University College of Medicine, Seoul 03722, Korea
- Venue
- Experimental Neurobiology
- Published
- 2017-02-28
- Volume
- 26
- Issue
- 1
- Pages
- 33-41
- ISSN
- 1226-2560
- 2093-8144
- PMC
- PMC5326713
- Cited by
- 65
- References
- 45
- Language
- en
- Licence
- creativecommons.org/licenses/by-nc/4.0 (tdm)
- Funders
- National Research Foundation of Korea (NRF-2016M3C7A1905098)
About these checks
Registry, retraction, Cites and statistics results are computed, not judged, with one exception: a printed reference that no index lists is read once by a model before it counts as a citation error. Claims are extracted by a model and kept only when their quote appears verbatim in the text; each cited source is then checked, with a model’s help, for whether it says what the claim relies on. Those verdicts can be wrong — read the claim’s quote and the cited source before relying on one.
Statistics and arithmetic are recomputed, not judged.
Confidence bands are shown only for fields calibrated on our annotated test set. None is calibrated yet, so no band is shown.
What counts as a claim ›How we measure confidence ›How we check this ›
Are you an author, or do you see a problem with this page? Request a review
Data sources
Bibliographic data: Semantic Scholar, OpenAlex, Crossref.
Contains information from the Semantic Scholar Academic Graph Datasets, made available under the ODC Attribution License (ODC-BY 1.0).
Semantic Scholar’s data is described in: Kinney, R., et al. (2023). The Semantic Scholar Open Data Platform. arXiv:2301.10140.
