

The DOI matches its Crossref record; 8 of the 8 references it cites were found in a registry or an index.
Extracellular vesicles derived from astrocyte-treated with haFGF14-154 attenuate Alzheimer phenotype in AD mice
Overview
The claims and statistics of this paper haven’t been checked yet.
Run the check — free, no account needed. It reads the open-access text and checks the sources it cites.
Integrity signals
Registry
Cites
Statistics
Figures
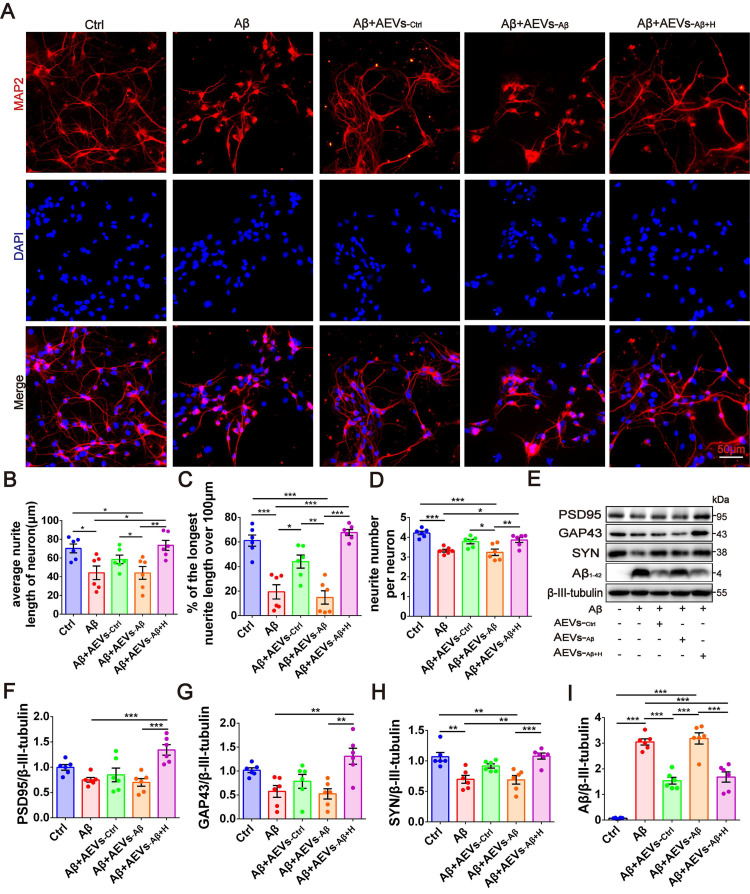
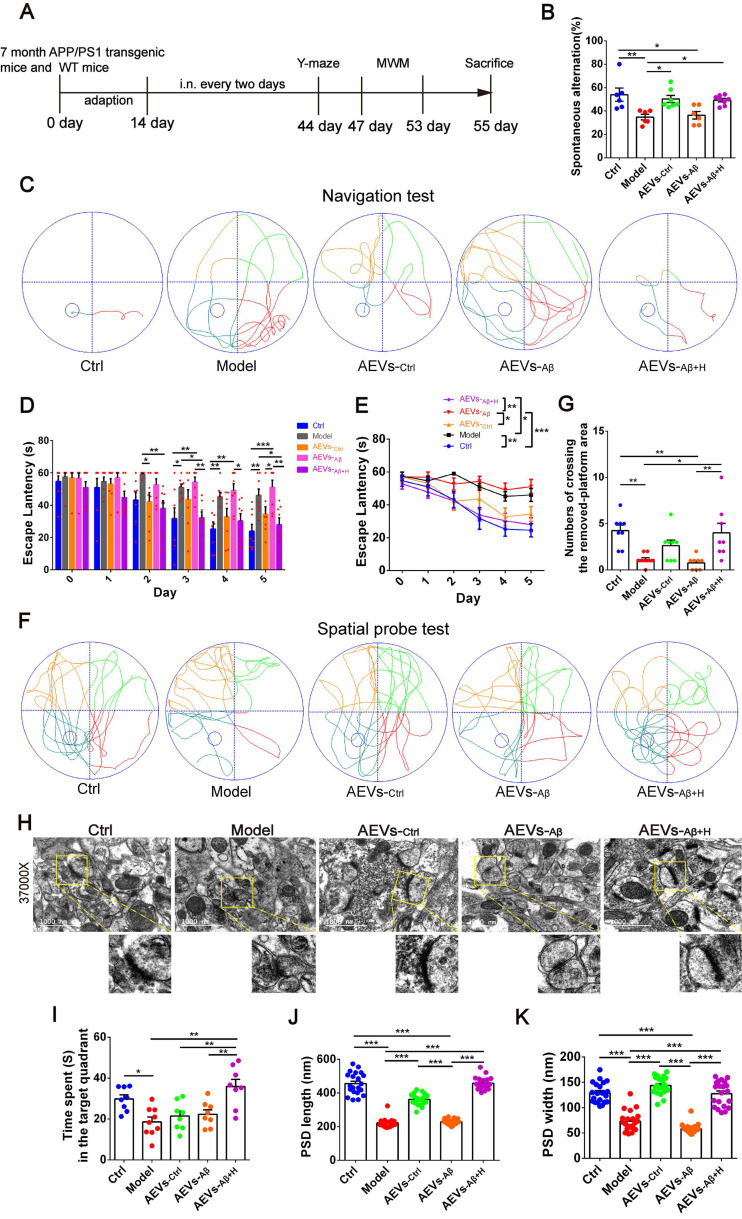
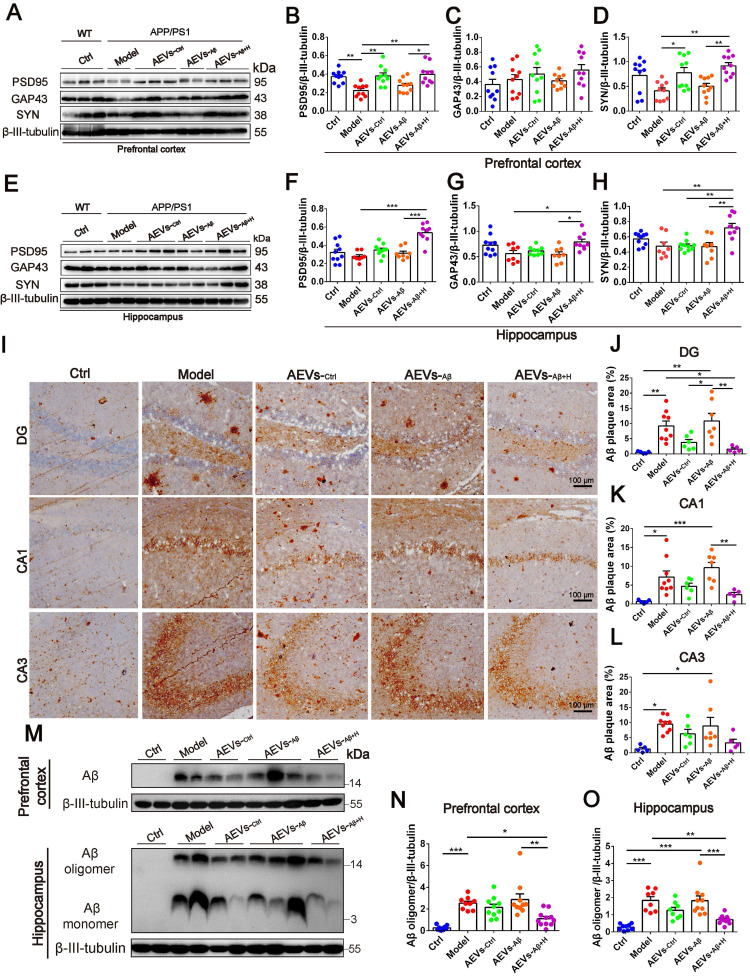
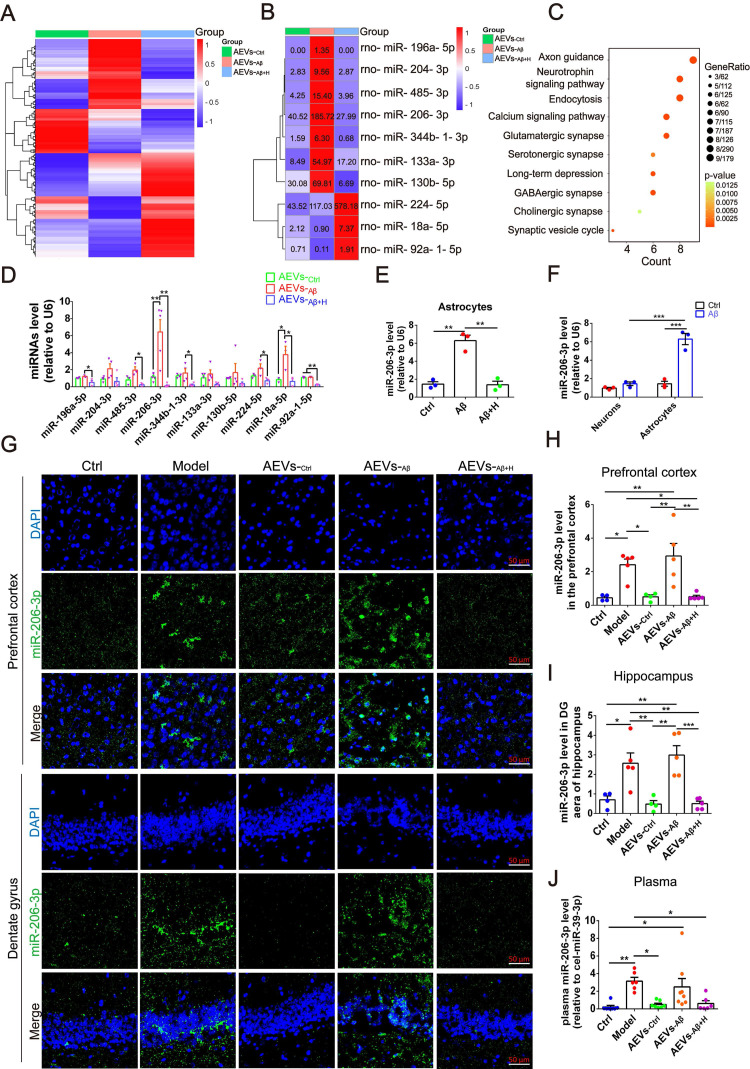
Verification
Claims the paper makes
The claims and statistics of this paper haven’t been checked yet.
Run the check — free, no account needed. It reads the open-access text and checks the sources it cites.
Claims other papers make about this one
Each is checked against this paper’s own text: does it say what the citing paper says it does?
The source backs part of the claim, not all of it — or backs it for a different population, condition or comparison.
In the citing paper
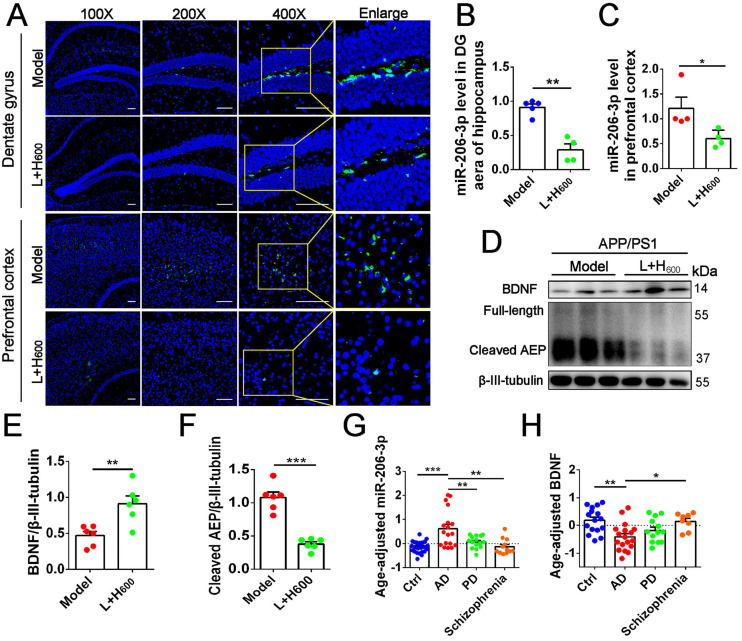
“For example, the EVs of astrocytes treated with aFGF or miR-206-3p inhibitor reduced the expression of miR-206-3p, improved synaptic plasticity and cognitive deficits and attenuated Aβ accumulation in AD mice [105].”
From MicroRNAs in Extracellular Vesicles of Alzheimer’s Disease (2023) · cites this paper as [105]
Experimental — accuracy not yet measuredThe cited source says what the claim attributes to it.
In the citing paper
“miR-9-5p [42,43], miR-16-5p [101], miR-29b [47], miR-124 [59] and miR-206-3p [105] were related to the generation of Aβ.”
From MicroRNAs in Extracellular Vesicles of Alzheimer’s Disease (2023) · cites this paper as [105]
In the citing paper
“For example, the EVs of astrocytes treated with aFGF or miR-206-3p inhibitor reduced the expression of miR-206-3p, improved synaptic plasticity and cognitive deficits and attenuated Aβ accumulation in AD mice [105].”
From MicroRNAs in Extracellular Vesicles of Alzheimer’s Disease (2023) · cites this paper as [105]
In the citing paper
“For example, the EVs of astrocytes treated with aFGF or miR-206-3p inhibitor reduced the expression of miR-206-3p, improved synaptic plasticity and cognitive deficits and attenuated Aβ accumulation in AD mice [105].”
From MicroRNAs in Extracellular Vesicles of Alzheimer’s Disease (2023) · cites this paper as [105]
Self-check
Percentages, sums and reported differences re-computed from the paper’s own numbers.
The self-check needs the paper’s full text.
Citations
Cites
Figurov, A., Pozzo-Miller, L. D., Olafsson, P., Wang, T., & Lu, B. (1996) · Nature · doi:10.1038/381706a0 · Cited by 1,106
The release and trans-synaptic transmission of Tau via exosomes
Wang, Y., Balaji, V., Kaniyappan, S., Krüger, L., Irsen, S., Tepper, K., Chandupatla, R., Maetzler, W., Schneider, A., Mandelkow, E., et al. (2017) · Molecular Neurodegeneration · doi:10.1186/s13024-016-0143-y · Cited by 674
Self-citationAstrocytes in Neurodegenerative Disease: Table 1.
Phatnani, H., & Maniatis, T. (2015) · Cold Spring Harbor Perspectives in Biology · doi:10.1101/cshperspect.a020628 · Cited by 420
Upadhya, R., Zingg, W., Shetty, S., & Shetty, A. K. (2020) · Journal of Controlled Release · doi:10.1016/j.jconrel.2020.04.017 · Cited by 282
Söllvander, S., Nikitidou, E., Brolin, R., Söderberg, L., Sehlin, D., Lannfelt, L., & Erlandsson, A. (2016) · Molecular Neurodegeneration · doi:10.1186/s13024-016-0098-z · Cited by 267
Varcianna, A., Myszczynska, M. A., Castelli, L. M., O'Neill, B., Kim, Y., Talbot, J., Nyberg, S., Nyamali, I., Heath, P. R., Stopford, M. J., et al. (2019) · EBioMedicine · doi:10.1016/j.ebiom.2018.11.067 · Cited by 194
You, Y., Borgmann, K., Edara, V. V., Stacy, S., Ghorpade, A., & Ikezu, T. (2020) · Journal of Extracellular Vesicles · doi:10.1080/20013078.2019.1706801 · Cited by 176
Dong, Y.-F., Kataoka, K., Toyama, K., Sueta, D., Koibuchi, N., Yamamoto, E., Yata, K., Tomimoto, H., Ogawa, H., & Kim-Mitsuyama, S. (2011) · Hypertension · doi:10.1161/hypertensionaha.111.173534 · Cited by 109
Research works printed but not linked: 46
- [1]Goedert M Spillantini MG A century of Alzheimer's disease Science 2006 314 777 81 17082447
- [2]Hardy J Selkoe DJ The amyloid hypothesis of Alzheimer's disease: progress and problems on the road to therapeutics Science 2002 297 353 6 12130773
- [3]Guo T Zhang D Zeng Y Huang TY Xu H Zhao Y Molecular and cellular mechanisms underlying the pathogenesis of Alzheimer's disease Mol Neurodegener 2020 15 40 32677986 PMC7364557
- [4]Gorshkov K Aguisanda F Thorne N Zheng W Astrocytes as targets for drug discovery Drug Discov Today 2018 23 673 80 29317338 PMC5937927
- [5]Phatnani H Maniatis T Astrocytes in neurodegenerative disease Cold Spring Harb Perspect Biol 2015 7 PMC4448607 25877220
- [9]Wang G Dinkins M He Q Zhu G Poirier C Campbell A Astrocytes secrete exosomes enriched with proapoptotic ceramide and prostate apoptosis response 4 (PAR-4): potential mechanism of apoptosis induction in Alzheimer disease (AD) J Biol Chem 2012 287 21384 95 22532571 PMC3375560
- [10]Elsherbini A Kirov AS Dinkins MB Wang G Qin H Zhu Z Association of Abeta with ceramide-enriched astrosomes mediates Abeta neurotoxicity Acta Neuropathol Commun 2020 8 60 32345374 PMC7189561
- [11]Mao S Sun Q Xiao H Zhang C Li L Secreted miR-34a in astrocytic shedding vesicles enhanced the vulnerability of dopaminergic neurons to neurotoxins by targeting Bcl-2 Protein Cell 2015 6 529 40 26091620 PMC4491052
- [13]Long Q Upadhya D Hattiangady B Kim DK An SY Shuai B Intranasal MSC-derived A1-exosomes ease inflammation, and prevent abnormal neurogenesis and memory dysfunction after status epilepticus Proc Natl Acad Sci U S A 2017 114 E3536 E45 28396435 PMC5410779
- [14]Long X Yao X Jiang Q Yang Y He X Tian W Astrocyte-derived exosomes enriched with miR-873a-5p inhibit neuroinflammation via microglia phenotype modulation after traumatic brain injury Journal of neuroinflammation 2020 17 89 32192523 PMC7082961
- [15]Chen W Wang H Zhu Z Feng J Chen L Exosome-Shuttled circSHOC2 from IPASs Regulates Neuronal Autophagy and Ameliorates Ischemic Brain Injury via the miR-7670-3p/SIRT1 Axis Molecular therapy Nucleic acids 2020 22 657 72 33230464 PMC7581834
- [16]Deng Z Wang J Xiao Y Li F Niu L Liu X Ultrasound-mediated augmented exosome release from astrocytes alleviates amyloid-beta-induced neurotoxicity Theranostics 2021 11 4351 62 33754065 PMC7977450
- [17]Kang W Hebert JM FGF Signaling Is Necessary for Neurogenesis in Young Mice and Sufficient to Reverse Its Decline in Old Mice J Neurosci 2015 35 10217 23 26180198 PMC4502262
- [18]Bouleau S Parvu-Ferecatu I Rodriguez-Enfedaque A Rincheval V Grimal H Mignotte B Fibroblast Growth Factor 1 inhibits p53-dependent apoptosis in PC12 cells Apoptosis 2007 12 1377 87 17473910
- [19]Wu Y Wu C Ye L Wang B Yuan Y Liu Y Exogenous fibroblast growth factor 1 ameliorates diabetes-induced cognitive decline via coordinately regulating PI3K/AKT signaling and PERK signaling Cell Commun Signal 2020 18 81 32460803 PMC7251863
- [20]Damon DH D'Amore PA Wagner JA Nerve growth factor and fibroblast growth factor regulate neurite outgrowth and gene expression in PC12 cells via both protein kinase C- and cAMP-independent mechanisms J Cell Biol 1990 110 1333 9 2157719 PMC2116059
- [21]Mashayekhi F Hadavi M Vaziri HR Naji M Increased acidic fibroblast growth factor concentrations in the serum and cerebrospinal fluid of patients with Alzheimer's disease J Clin Neurosci 2010 17 357 9 20079650
- [22]Lou G Zhang Q Xiao F Xiang Q Su Z Huang Y Intranasal TAT-haFGF Improves Cognition and Amyloid-beta Pathology in an AbetaPP/PS1 Mouse Model of Alzheimer's Disease Journal of Alzheimer's disease: JAD 2016 51 985 90 26890786
- [23]Meng T Cao Q Lei P Bush AI Xiang Q Su Z Tat-haFGF14-154 Upregulates ADAM10 to Attenuate the Alzheimer Phenotype of APP/PS1 Mice through the PI3K-CREB-IRE1alpha/XBP1 Pathway Molecular therapy Nucleic acids 2017 7 439 52 28624220 PMC5443968
- [24]Kang W Balordi F Su N Chen L Fishell G Hebert JM Astrocyte activation is suppressed in both normal and injured brain by FGF signaling Proc Natl Acad Sci U S A 2014 111 E2987 95 25002516 PMC4115557
- [25]Chompre G Cruz E Maldonado L Rivera-Amill V Porter JT Noel RJ Jr Astrocytic expression of HIV-1 Nef impairs spatial and recognition memory Neurobiol Dis 2013 49 128 36 22926191 PMC3530662
- [27]Seo J Giusti-Rodriguez P Zhou Y Rudenko A Cho S Ota KT Activity-dependent p25 generation regulates synaptic plasticity and Abeta-induced cognitive impairment Cell 2014 157 486 98 24725413 PMC4327772
- [28]Abdullah M Takase H Nunome M Enomoto H Ito J Gong JS Amyloid-beta Reduces Exosome Release from Astrocytes by Enhancing JNK Phosphorylation Journal of Alzheimer's disease: JAD 2016 53 1433 41 27392863
- [29]Ma X Huang M Zheng M Dai C Song Q Zhang Q ADSCs-derived extracellular vesicles alleviate neuronal damage, promote neurogenesis and rescue memory loss in mice with Alzheimer's disease J Control Release 2020 327 688 702 32931898
- [30]Nogueras-Ortiz CJ Mahairaki V Delgado-Peraza F Das D Avgerinos K Eren E Astrocyte- and Neuron-Derived Extracellular Vesicles from Alzheimer's Disease Patients Effect Complement-Mediated Neurotoxicity Cells 2020 9 PMC7407141 32635578
- [31]Chen C Wang Z Zhang Z Liu X Kang SS Zhang Y The prodrug of 7,8-dihydroxyflavone development and therapeutic efficacy for treating Alzheimer's disease Proc Natl Acad Sci U S A 2018 115 578 83 29295929 PMC5777001
- [32]Wang ZH Xiang J Liu X Yu SP Manfredsson FP Sandoval IM Deficiency in BDNF/TrkB Neurotrophic Activity Stimulates delta-Secretase by Upregulating C/EBPbeta in Alzheimer's Disease Cell Rep 2019 28 655 69 e5 31315045 PMC6684282
- [33]Baldwin KT Eroglu C Molecular mechanisms of astrocyte-induced synaptogenesis Curr Opin Neurobiol 2017 45 113 20 28570864 PMC5573249
- [34]Blanco-Suarez E Caldwell AL Allen NJ Role of astrocyte-synapse interactions in CNS disorders J Physiol 2017 595 1903 16 27381164 PMC5350444
- [35]Kim SK Nabekura J Koizumi S Astrocyte-mediated synapse remodeling in the pathological brain Glia 2017 65 1719 27 28569048
- [36]Allaman I Belanger M Magistretti PJ Astrocyte-neuron metabolic relationships: for better and for worse Trends Neurosci 2011 34 76 87 21236501
- [37]Verkhratsky A Parpura V Pekna M Pekny M Sofroniew M Glia in the pathogenesis of neurodegenerative diseases Biochem Soc Trans 2014 42 1291 301 25233406
- [38]Williams CJ Dexter DT Neuroprotective and symptomatic effects of targeting group III mGlu receptors in neurodegenerative disease J Neurochem 2014 129 4 20 24224472
- [39]Harada K Kamiya T Tsuboi T Gliotransmitter Release from Astrocytes: Functional, Developmental, and Pathological Implications in the Brain Front Neurosci 2015 9 499 26793048 PMC4709856
- [40]Kim YS Jung HM Yoon BE Exploring glia to better understand Alzheimer's disease Anim Cells Syst (Seoul) 2018 22 213 8 30460100 PMC6138241
- [41]Niranjan R The role of inflammatory and oxidative stress mechanisms in the pathogenesis of Parkinson's disease: focus on astrocytes Molecular neurobiology 2014 49 28 38 23783559
- [42]Goetzl EJ Schwartz JB Abner EL Jicha GA Kapogiannis D High complement levels in astrocyte-derived exosomes of Alzheimer disease Annals of neurology 2018 83 544 52 29406582 PMC5867263
- [43]Trotta T Panaro MA Cianciulli A Mori G Di Benedetto A Porro C Microglia-derived extracellular vesicles in Alzheimer's Disease: A double-edged sword Biochem Pharmacol 2018 148 184 92 29305855
- [45]Pascua-Maestro R Gonzalez E Lillo C Ganfornina MD Falcon-Perez JM Sanchez D Extracellular Vesicles Secreted by Astroglial Cells Transport Apolipoprotein D to Neurons and Mediate Neuronal Survival Upon Oxidative Stress Frontiers in cellular neuroscience 2018 12 526 30687015 PMC6335244
- [46]Mignani S Shi X Karpus A Majoral JP Non-invasive intranasal administration route directly to the brain using dendrimer nanoplatforms: An opportunity to develop new CNS drugs Eur J Med Chem 2021 209 112905 33069435 PMC7548078
- [47]Lee ST Chu K Jung KH Kim JH Huh JY Yoon H miR-206 regulates brain-derived neurotrophic factor in Alzheimer disease model Annals of neurology 2012 72 269 77 22926857
- [49]Ji Y Lu Y Yang F Shen W Tang TT Feng L Acute and gradual increases in BDNF concentration elicit distinct signaling and functions in neurons Nat Neurosci 2010 13 302 9 20173744 PMC4780419
- [50]Tyler WJ Pozzo-Miller L Miniature synaptic transmission and BDNF modulate dendritic spine growth and form in rat CA1 neurones J Physiol 2003 553 497 509 14500767 PMC2343578
- [51]Bates KA Verdile G Li QX Ames D Hudson P Masters CL Clearance mechanisms of Alzheimer's amyloid-beta peptide: implications for therapeutic design and diagnostic tests Mol Psychiatry 2009 14 469 86 18794889
- [52]Cone AS Yuan X Sun L Duke LC Vreones MP Carrier AN Mesenchymal stem cell-derived extracellular vesicles ameliorate Alzheimer's disease-like phenotypes in a preclinical mouse model Theranostics 2021 11 8129 42 34373732 PMC8344012
- [53]Wang ZH Gong K Liu X Zhang Z Sun X Wei ZZ C/EBPbeta regulates delta-secretase expression and mediates pathogenesis in mouse models of Alzheimer's disease Nat Commun 2018 9 1784 29725016 PMC5934399
Cited by
Sorted by citations
Filannino, F. M., Panaro, M. A., Benameur, T., Pizzolorusso, I., & Porro, C. (2024) · International Journal of Molecular Sciences · doi:10.3390/ijms25031629 · Cited by 60
MicroRNAs in Extracellular Vesicles of Alzheimer’s Disease
Li, W., & Zheng, Y. (2023) · Cells · doi:10.3390/cells12101378 · Cited by 43
Shanthi, K., Fischer, D., Sharma, A., Kiviniemi, A., Kaakinen, M., Vainio, S., & Bart, G. (2023) · Genes · doi:10.3390/genes14040853 · Cited by 5
Metadata
- Authors
- Peng, D., Wang, Y., Xiao, Y., Peng, M., Mai, W., Hu, B., Jia, Y., Chen, H., Yang, Y., Xiang, Q., Su, Z., Zhang, Q., & Huang, Y.
- Venue
- Theranostics
- Publisher
- Ivyspring International Publisher
- Published
- 2022
- Volume
- 12
- Issue
- 8
- Pages
- 3862-3881
- ISSN
- 1838-7640
- PMC
- PMC9131260
- Cited by
- 52
- References
- 8
- Language
- en
About these checks
Registry, retraction, Cites and statistics results are computed, not judged, with one exception: a printed reference that no index lists is read once by a model before it counts as a citation error. Claims are extracted by a model and kept only when their quote appears verbatim in the text; each cited source is then checked, with a model’s help, for whether it says what the claim relies on. Those verdicts can be wrong — read the claim’s quote and the cited source before relying on one.
Statistics and arithmetic are recomputed, not judged.
Confidence bands are shown only for fields calibrated on our annotated test set. None is calibrated yet, so no band is shown.
What counts as a claim ›How we measure confidence ›How we check this ›
Are you an author, or do you see a problem with this page? Request a review
