

The DOI matches its Crossref record; 55 of the 55 references it cites were found in a registry or an index.
ER-associated mitochondrial division links the distribution of mitochondria and mitochondrial DNA in yeast
Open accessAbstract
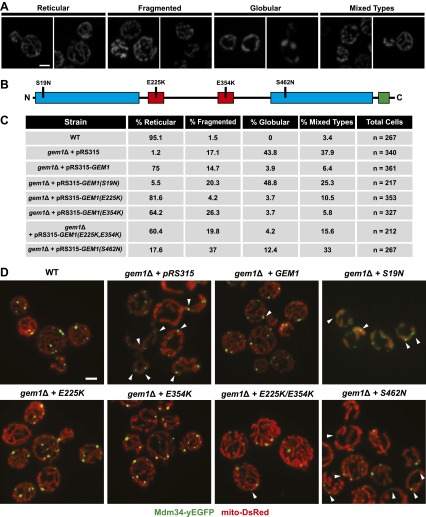
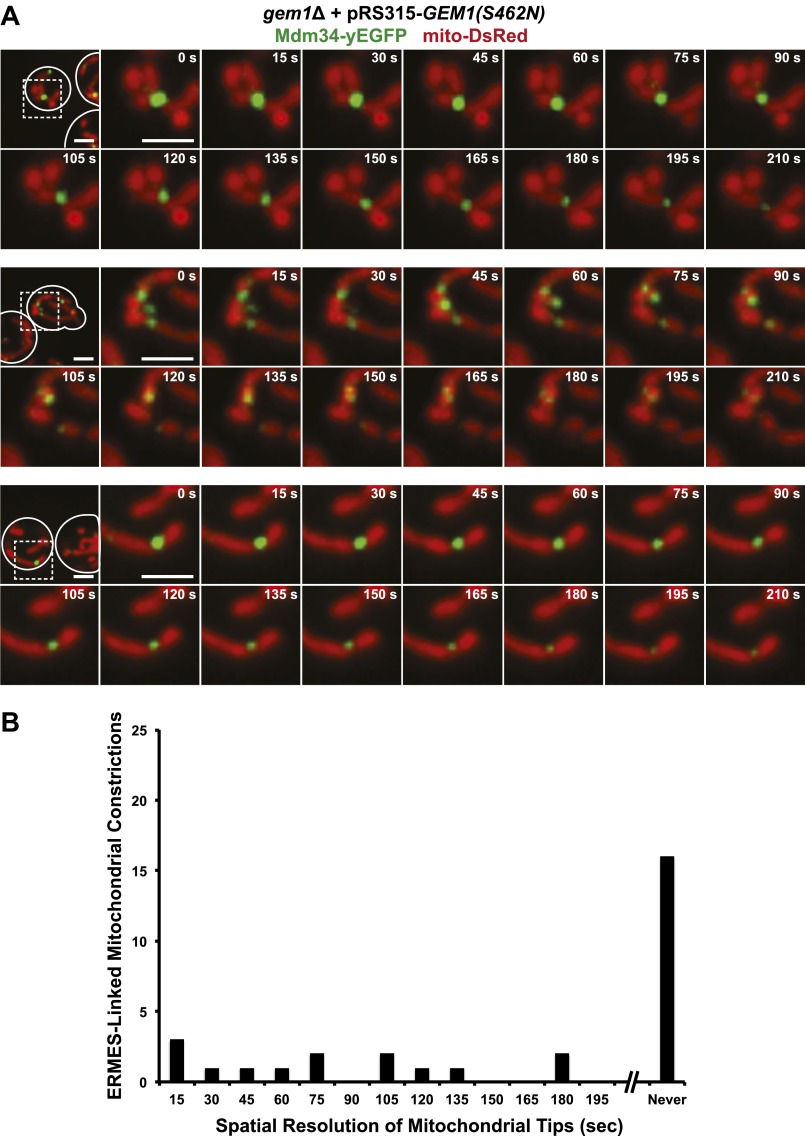
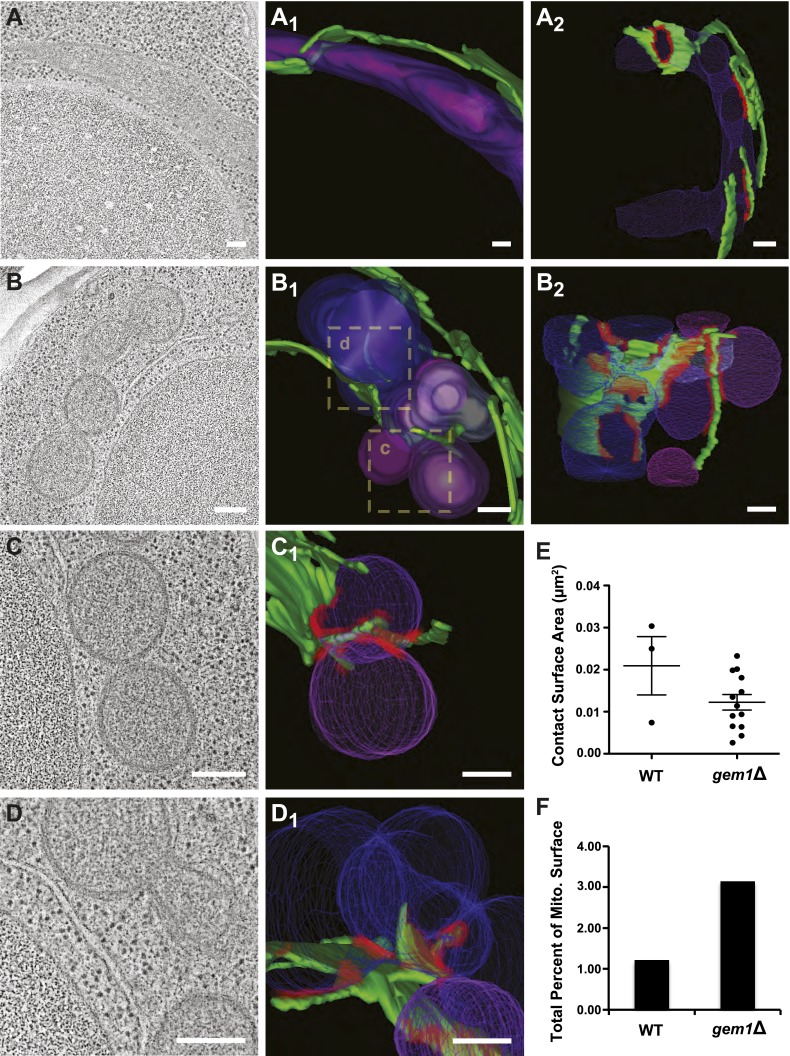
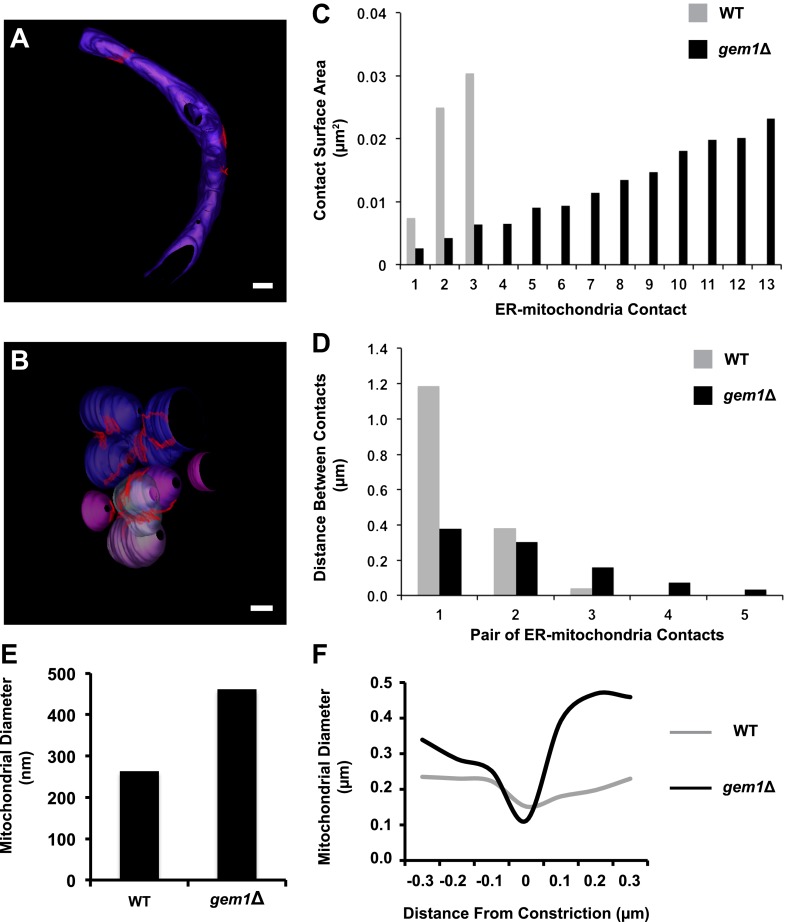
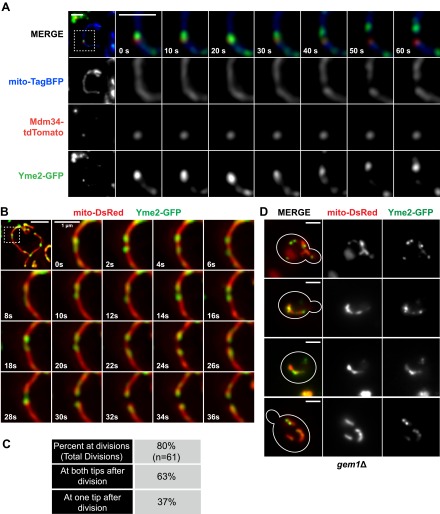
Mitochondrial division is important for mitochondrial distribution and function. Recent data have demonstrated that ER-mitochondria contacts mark mitochondrial division sites, but the molecular basis and functions of these contacts are not understood. Here we show that in yeast, the ER-mitochondria tethering complex, ERMES, and the highly conserved Miro GTPase, Gem1, are spatially and functionally linked to ER-associated mitochondrial division. Gem1 acts as a negative regulator of ER-mitochondria contacts, an activity required for the spatial resolution and distribution of newly generated mitochondrial tips following division. Previous data have demonstrated that ERMES localizes with a subset of actively replicating mitochondrial nucleoids. We show that mitochondrial division is spatially linked to nucleoids and that a majority of these nucleoids segregate prior to division, resulting in their distribution into newly generated tips in the mitochondrial network. Thus, we postulate that ER-associated division serves to link the distribution of mitochondria and mitochondrial nucleoids in cells. DOI:http://dx.doi.org/10.7554/eLife.00422.001.
Overview
The claims and statistics of this paper haven’t been checked yet.
Run the check — free, no account needed. It reads the open-access text and checks the sources it cites.
Integrity signals
Registry
Cites
Statistics
Figures
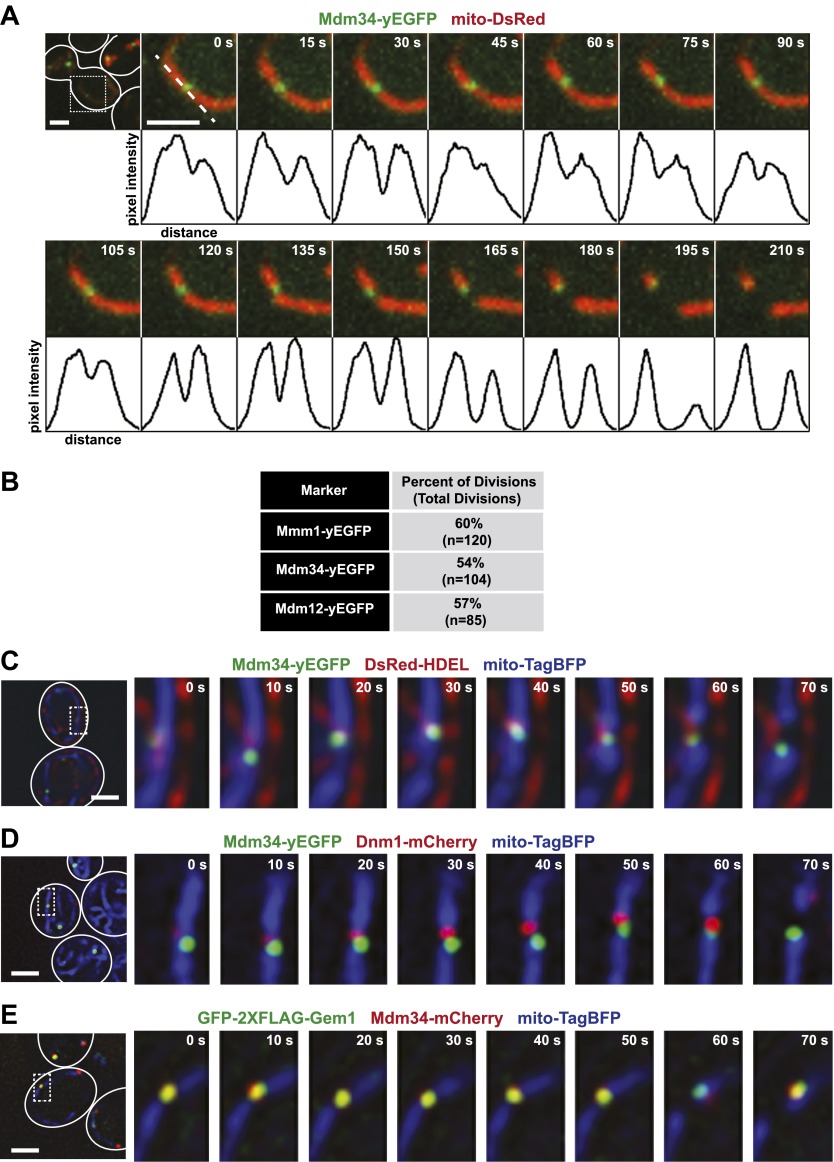
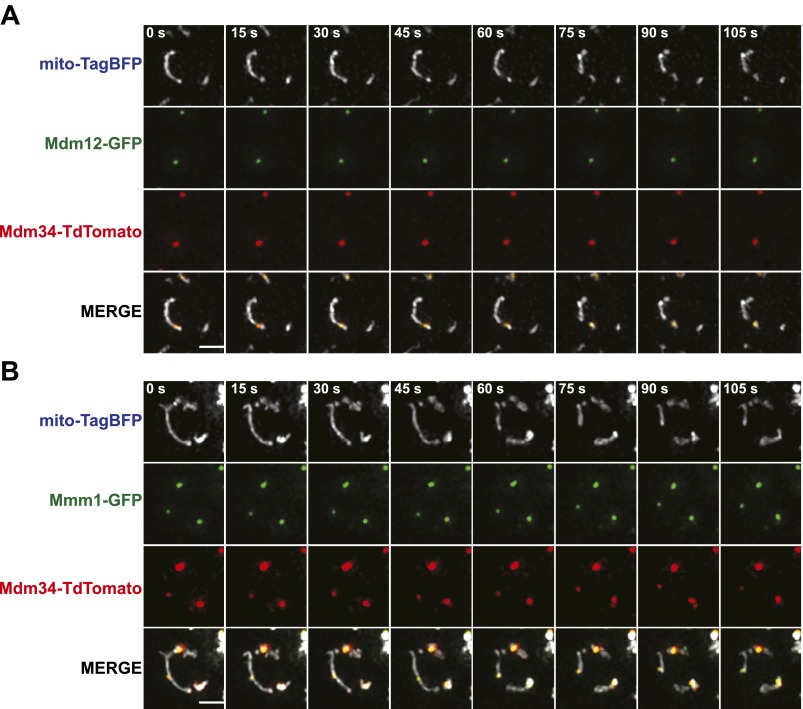
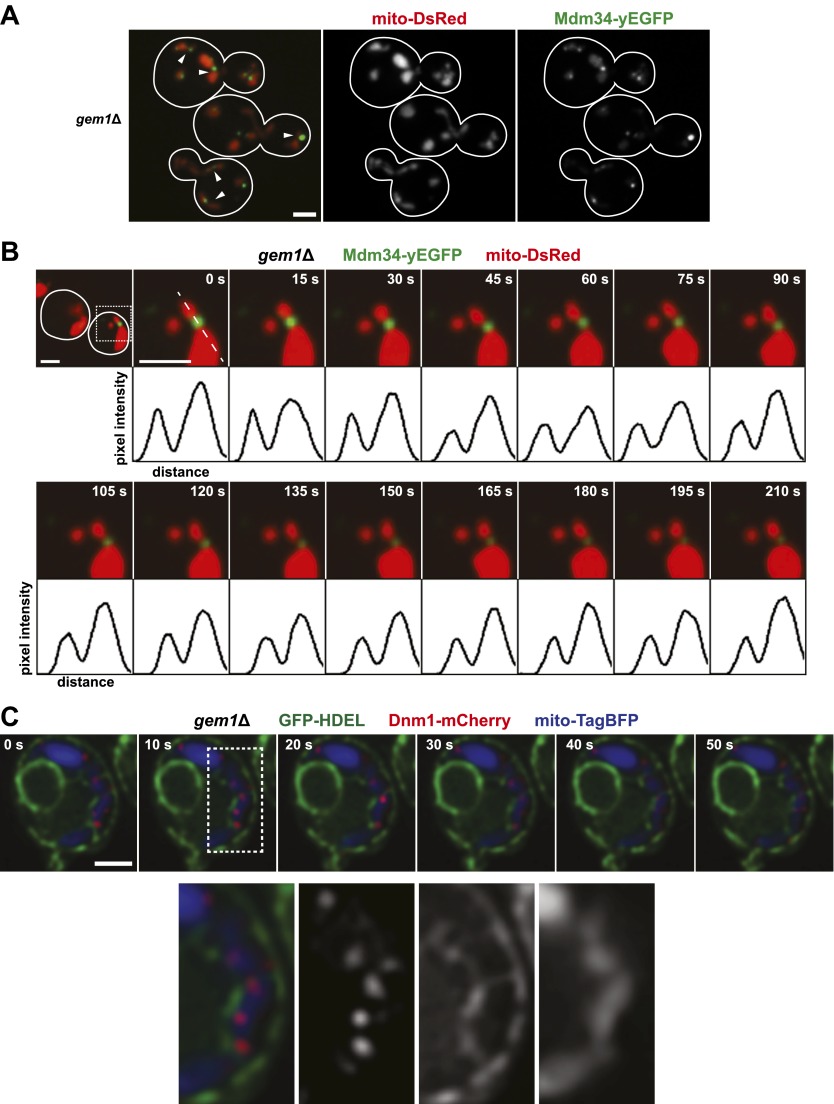
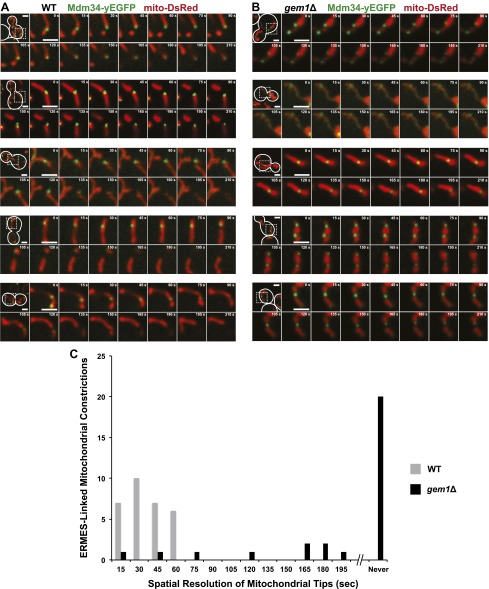
Verification
Claims the paper makes
The claims and statistics of this paper haven’t been checked yet.
Run the check — free, no account needed. It reads the open-access text and checks the sources it cites.
Claims other papers make about this one
Each is checked against this paper’s own text: does it say what the citing paper says it does?
The source backs part of the claim, not all of it — or backs it for a different population, condition or comparison.
In the citing paper
“At the fission site of mitochondria, the ERMES complex localizes adjacent to replicating mtDNA and is involved in the distribution of newly replicated mtDNA to the dividing mitochondria [33].”
From In Candida glabrata, ERMES Component GEM1 Controls Mitochondrial Morphology, mtROS, and Drug Efflux Pump Expression, Resulting in Azole Susceptibility (2023) · cites this paper as [33]
Experimental — accuracy not yet measuredThe source backs part of the claim, not all of it — or backs it for a different population, condition or comparison.
In the citing paper
“After mitochondrial fission, one of the dividing mitochondria is detached from the ER, a process that requires Gem1 in S. cerevisiae [33].”
From In Candida glabrata, ERMES Component GEM1 Controls Mitochondrial Morphology, mtROS, and Drug Efflux Pump Expression, Resulting in Azole Susceptibility (2023) · cites this paper as [33]
Experimental — accuracy not yet measuredThe source backs part of the claim, not all of it — or backs it for a different population, condition or comparison.
In the citing paper
“In S. cerevisiae, mutations leading to decreased GTPase activity, Gem1(S19N) or Gem1(S462N), impair the maintenance of mitochondrial morphology and dissociation of ERMES from the fission site [33].”
From In Candida glabrata, ERMES Component GEM1 Controls Mitochondrial Morphology, mtROS, and Drug Efflux Pump Expression, Resulting in Azole Susceptibility (2023) · cites this paper as [33]
Experimental — accuracy not yet measuredThe cited source says what the claim attributes to it.
In the citing paper
“The fission site of mitochondria is wrapped around by ER tubules [44], where the ERMES complex localizes [33].”
From In Candida glabrata, ERMES Component GEM1 Controls Mitochondrial Morphology, mtROS, and Drug Efflux Pump Expression, Resulting in Azole Susceptibility (2023) · cites this paper as [33]
The cited source says what the claim attributes to it.
In the citing paper
“As the ERMES plays an important role in mitochondrial fission [33], the impact of each subunit on azole resistance was evaluated.”
From In Candida glabrata, ERMES Component GEM1 Controls Mitochondrial Morphology, mtROS, and Drug Efflux Pump Expression, Resulting in Azole Susceptibility (2023) · cites this paper as [33]
Self-check
Percentages, sums and reported differences re-computed from the paper’s own numbers.
The self-check needs the paper’s full text.
Citations
Cites
Computer Visualization of Three-Dimensional Image Data Using IMOD
Kremer, J. R., Mastronarde, D. N., & McIntosh, J. R. (1996) · Journal of Structural Biology · doi:10.1006/jsbi.1996.0013 · Cited by 5,530
Shaner, N. C., Campbell, R. E., Steinbach, P. A., Giepmans, B. N. G., Palmer, A. E., & Tsien, R. Y. (2004) · Nature Biotechnology · doi:10.1038/nbt1037 · Cited by 4,619
Global analysis of protein localization in budding yeast
Huh, W.-K., Falvo, J. V., Gerke, L. C., Carroll, A. S., Howson, R. W., Weissman, J. S., & O'Shea, E. K. (2003) · Nature · doi:10.1038/nature02026 · Cited by 4,248 · cited 2×
“The detection of ERMES foci by fluorescence imaging may underestimate ERMES foci associated with mitochondrial division as we observed a positive correlation between the percentage of mitochondrial divisions associated with a given ERMES subunit and its estimated whole-cell abundance (Huh et al., 2003).”
BackgroundBrachmann, C. B., Davies, A., Cost, G. J., Caputo, E. M., Li, J., Hieter, P., & Boeke, J. D. (1998) · Yeast · doi:10.1002/(sici)1097-0061(19980130)14:2 · Cited by 3,418
[12] One-step gene disruption in yeast
Rothstein, R. J. (1983) · Methods in enzymology on CD-ROM/Methods in enzymology · doi:10.1016/0076-6879(83)01015-0 · Cited by 3,282
Mitofusin 2 tethers endoplasmic reticulum to mitochondria
de Brito, O. M., & Scorrano, L. (2008) · Nature · doi:10.1038/nature07534 · Cited by 2,442
Janke, C., Magiera, M., Rathfelder, N., Taxis, C., Reber, S., Maekawa, H., Moreno-Borchart, A. C., Doenges, G., Schwob, E., Schiebel, E., et al. (2004) · Yeast · doi:10.1002/yea.1142 · Cited by 2,251
ER Tubules Mark Sites of Mitochondrial Division
Friedman, J. R., Lackner, L. L., West, M., DiBenedetto, J. R., Nunnari, J., & Voeltz, G. K. (2011) · Science · doi:10.1126/science.1207385 · Cited by 2,072
Self-citationAn ER-Mitochondria Tethering Complex Revealed by a Synthetic Biology Screen
Kornmann, B., Currie, E., Collins, S. R., Schuldiner, M., Nunnari, J., Weissman, J. S., & Walter, P. (2009) · Science · doi:10.1126/science.1175088 · Cited by 1,275
Self-citationPINK1 and Parkin Target Miro for Phosphorylation and Degradation to Arrest Mitochondrial Motility
Wang, X., Winter, D., Ashrafi, G., Schlehe, J. S., Wong, Y. L., Selkoe, D. J., Rice, S. E., Steen, J. A. J., LaVoie, M. J., & Schwarz, T. L. (2011) · Cell · doi:10.1016/j.cell.2011.10.018 · Cited by 1,198
Cited by
Sorted by citations
Mitochondrial form and function
Friedman, J. R., & Nunnari, J. (2014) · Nature · doi:10.1038/nature12985 · Cited by 1,803
Self-citationMitochondrial dynamics: overview of molecular mechanisms
Tilokani, L., Nagashima, S., Paupe, V., & Prudent, J. (2018) · Essays in Biochemistry · doi:10.1042/ebc20170104 · Cited by 1,397
The Origin and Diversification of Mitochondria
Roger, A. J., Muñoz-Gómez, S. A., & Kamikawa, R. (2017) · Current Biology · doi:10.1016/j.cub.2017.09.015 · Cited by 1,142
Mitochondrial dynamics and inheritance during cell division, development and disease
Mishra, P., & Chan, D. C. (2014) · Nature Reviews Molecular Cell Biology · doi:10.1038/nrm3877 · Cited by 1,076
Structure and function of ER membrane contact sites with other organelles
Phillips, M. J., & Voeltz, G. K. (2016) · Nature Reviews Molecular Cell Biology · doi:10.1038/nrm.2015.8 · Cited by 933
Self-citationThe i -AAA protease YME1L and OMA1 cleave OPA1 to balance mitochondrial fusion and fission
Anand, R., Wai, T., Baker, M. J., Kladt, N., Schauss, A. C., Rugarli, E., & Langer, T. (2014) · Journal of Cell Biology · doi:10.1083/jcb.201308006 · Cited by 812
Distinct fission signatures predict mitochondrial degradation or biogenesis.
Kleele, T., Rey, T., Winter, J., Zaganelli, S., Mahecic, D., Perreten Lambert, H., Ruberto, F. P., Nemir, M., Wai, T., Pedrazzini, T., et al. (2021) · Nature · doi:10.1038/s41586-021-03510-6 · Cited by 794
Coming together to define membrane contact sites
Scorrano, L., Matteis, M. A. D., Emr, S. D., Giordano, F., Hajnóczky, G., Kornmann, B., Lackner, L. L., Levine, T. P., Pellegrini, L., Reinisch, K. M., et al. (2019) · Nature Communications · doi:10.1038/s41467-019-09253-3 · Cited by 774
Self-citationThe functional universe of membrane contact sites
Prinz, W. A., Toulmay, A., & Balla, T. (2019) · Nature Reviews Molecular Cell Biology · doi:10.1038/s41580-019-0180-9 · Cited by 770
Here, there, and everywhere: The importance of ER membrane contact sites
Wu, H., Carvalho, P., & Voeltz, G. K. (2018) · Science · doi:10.1126/science.aan5835 · Cited by 689
Self-citationER-mitochondria contacts couple mtDNA synthesis with mitochondrial division in human cells
Lewis, S. C., Uchiyama, L. F., & Nunnari, J. (2016) · Science · doi:10.1126/science.aaf5549 · Cited by 673
Self-citationEndoplasmic reticulum-mitochondrial contactology: structure and signaling functions
Csordás, G., Weaver, D., & Hajnóczky, G. (2018) · Trends in Cell Biology · doi:10.1016/j.tcb.2018.02.009 · Cited by 625
Mitochondria at the crossroads of health and disease
Suomalainen, A., & Nunnari, J. M. (2024) · Cell · doi:10.1016/j.cell.2024.04.037 · Cited by 528
Self-citationMolecular mechanisms of mitochondrial dynamics
Tábara, L. C., Segawa, M., & Prudent, J. (2024) · Nature Reviews Molecular Cell Biology · doi:10.1038/s41580-024-00785-1 · Cited by 445
ER Contact Sites Define the Position and Timing of Endosome Fission
Rowland, A. A., Chitwood, P. J., Phillips, M. J., & Voeltz, G. K. (2014) · Cell · doi:10.1016/j.cell.2014.10.023 · Cited by 399
Self-citationBridging the gap: Membrane contact sites in signaling, metabolism, and organelle dynamics
Prinz, W. A. (2014) · The Journal of Cell Biology · doi:10.1083/jcb.201401126 · Cited by 409
The Protein Import Machinery of Mitochondria—A Regulatory Hub in Metabolism, Stress, and Disease
Harbauer, A. B., Zahedi, R. P., Sickmann, A., Pfanner, N., & Meisinger, C. (2014) · Cell Metabolism · doi:10.1016/j.cmet.2014.01.010 · Cited by 395
A Dynamic Interface between Vacuoles and Mitochondria in Yeast
Elbaz‐Alon, Y., Rosenfeld-Gur, E., Shinder, V., Futerman, A. H., Geiger, T., & Schuldiner, M. (2014) · Developmental Cell · doi:10.1016/j.devcel.2014.06.007 · Cited by 377
Hung, V., Lam, S. S., Udeshi, N. D., Svinkina, T., Guzman, G., Mootha, V. K., Carr, S. A., & Ting, A. Y. (2017) · eLife · doi:10.7554/elife.24463 · Cited by 373
A Tether Is a Tether Is a Tether: Tethering at Membrane Contact Sites
Eisenberg‐Bord, M., Shai, N., Schuldiner, M., & Bohnert, M. (2016) · Developmental Cell · doi:10.1016/j.devcel.2016.10.022 · Cited by 382
mTOR Controls Mitochondrial Dynamics and Cell Survival via MTFP1
Morita, M., Prudent, J., Basu, K., Goyon, V., Katsumura, S., Hulea, L., Pearl, D., Siddiqui, N., Strack, S., McGuirk, S., et al. (2017) · Molecular Cell · doi:10.1016/j.molcel.2017.08.013 · Cited by 381
Structural basis of mitochondrial receptor binding and constriction by DRP1
Kalia, R., Wang, R. Y., Yusuf, A., Thomas, P. V., Agard, D. A., Shaw, J. M., & Frost, A. S. (2018) · Nature · doi:10.1038/s41586-018-0211-2 · Cited by 385
Mitochondrial fusion/fission dynamics in neurodegeneration and neuronal plasticity
Bertholet, A. M., Delerue, T., Millet, A. M., Moulis, M. F., David, C., Daloyau, M., Arnauné-Pelloquin, L., Davezac, N., Mils, V., Miquel, M. C., et al. (2016) · Neurobiology of Disease · doi:10.1016/j.nbd.2015.10.011 · Cited by 363
Wu, W., Lin, C., Wu, K., Jiang, L., Wang, X., Li, W., Zhuang, H., Zhang, X., Chen, H. H., Li, S., et al. (2016) · The EMBO Journal · doi:10.15252/embj.201593102 · Cited by 370
Determinants and outcomes of mitochondrial dynamics
Quintana–Cabrera, R., & Scorrano, L. (2023) · Molecular Cell · doi:10.1016/j.molcel.2023.02.012 · Cited by 362
Manor, U., Bartholomew, S. R., Golani, G., Christenson, E. T., Kozlov, M. M., Higgs, H. N., Spudich, J. A., & Lippincott‐Schwartz, J. (2015) · eLife · doi:10.7554/elife.08828 · Cited by 342
Mitochondrial DNA: Distribution, Mutations, and Elimination
Yan, C., Duanmu, X., Zeng, L., Liu, B., & Song, Z. (2019) · Cells · doi:10.3390/cells8040379 · Cited by 346
The AMPK-MFN2 axis regulates MAM dynamics and autophagy induced by energy stresses
Hu, Y., Chen, H., Zhang, L., Lin, X., Li, X., Zhuang, H., Fan, H., Meng, T., He, Z., Huang, H., et al. (2020) · Autophagy · doi:10.1080/15548627.2020.1749490 · Cited by 340
MAPL SUMOylation of Drp1 Stabilizes an ER/Mitochondrial Platform Required for Cell Death
Prudent, J., Zunino, R., Sugiura, A., Mattie, S., Shore, G. C., & McBride, H. M. (2015) · Molecular Cell · doi:10.1016/j.molcel.2015.08.001 · Cited by 335
Determinants and Functions of Mitochondrial Behavior
Labbè, K., Murley, A., & Nunnari, J. M. (2014) · Annual Review of Cell and Developmental Biology · doi:10.1146/annurev-cellbio-101011-155756 · Cited by 324
Self-citationFriedman, J. R., Mourier, A., Yamada, J., McCaffery, J. M., & Nunnari, J. (2015) · eLife · doi:10.7554/elife.07739 · Cited by 291
Self-citationMurley, A., Sarsam, R. D., Toulmay, A., Yamada, J., Prinz, W. A., & Nunnari, J. M. (2015) · The Journal of Cell Biology · doi:10.1083/jcb.201502033 · Cited by 293
Self-citationMitochondrial lipid trafficking
Tatsuta, T., Scharwey, M., & Langer, T. (2013) · Trends in Cell Biology · doi:10.1016/j.tcb.2013.07.011 · Cited by 295
MIROs and DRP1 drive mitochondrial-derived vesicle biogenesis and promote quality control
König, T., Nolte, H., Aaltonen, M. J., Tatsuta, T., Krols, M., Stroh, T., Langer, T., & McBride, H. M. (2021) · Nature Cell Biology · doi:10.1038/s41556-021-00798-4 · Cited by 288
The Emerging Network of Mitochondria-Organelle Contacts
Murley, A., & Nunnari, J. M. (2016) · Molecular Cell · doi:10.1016/j.molcel.2016.01.031 · Cited by 241
Self-citationFiladi, R., Theurey, P., & Pizzo, P. (2017) · Cell Calcium · doi:10.1016/j.ceca.2017.01.003 · Cited by 247
ER–mitochondrial junctions can be bypassed by dominant mutations in the endosomal protein Vps13
Lang, A. B., Peter, A. T. J., Walter, P., & Kornmann, B. (2015) · The Journal of Cell Biology · doi:10.1083/jcb.201502105 · Cited by 223
Self-citationDefining the physiological role of SRP in protein-targeting efficiency and specificity
Boydston, E. A., Subramanian, K., Nunnari, J. M., & Weissman, J. S. (2018) · Science · doi:10.1126/science.aar3607 · Cited by 216
Self-citationLoss of Miro1-directed mitochondrial movement results in a novel murine model for neuron disease
Nguyen, T., Oh, S. S., Weaver, D., Lewandowska, A., Maxfield, D., Schuler, M.-H., Smith, N. K., Macfarlane, J. L., Saunders, G. W., Palmer, C. A., et al. (2014) · Proceedings of the National Academy of Sciences · doi:10.1073/pnas.1402449111 · Cited by 223
Mitochondrial ER Contacts Are Crucial for Mitophagy in Yeast
Böckler, S., & Westermann, B. (2014) · Developmental Cell · doi:10.1016/j.devcel.2014.01.012 · Cited by 221
Endoplasmic reticulum–associated degradation regulates mitochondrial dynamics in brown adipocytes
Zhou, Z., Torres, M., Sha, H., Halbrook, C. J., den Bergh, F. V., Reinert, R. B., Yamada, T., Wang, S., Luo, Y., Hunter, A. H., et al. (2020) · Science · doi:10.1126/science.aay2494 · Cited by 219
Cheng, A. N., Cheng, L.-C., Kuo, C., Lo, Y. K., Chou, H.-Y., Chen, C., Wang, Y., Chuang, T., Cheng, S., & Lee, A. Y. (2020) · Journal for ImmunoTherapy of Cancer · doi:10.1136/jitc-2020-001372 · Cited by 210
The multifaceted regulation of mitophagy by endogenous metabolites
Zhang, T., Liu, Q., Gao, W., Sehgal, S. A., & Wu, H. (2021) · Autophagy · doi:10.1080/15548627.2021.1975914 · Cited by 209
Mitochondria as Cellular and Organismal Signaling Hubs
Shen, K., Pender, C. L., Bar‐Ziv, R., Zhang, H., Wickham, K., Willey, E., Durieux, J., Ahmad, Q., & Dillin, A. G. (2022) · Annual Review of Cell and Developmental Biology · doi:10.1146/annurev-cellbio-120420-015303 · Cited by 214
Mitochondrial dynamics and viral infections: A close nexus
Khan, M. A., Syed, G. H., Kim, S., & Siddiqui, A. (2015) · Biochimica et Biophysica Acta (BBA) - Molecular Cell Research · doi:10.1016/j.bbamcr.2014.12.040 · Cited by 195
Ishihara, T., Ban-Ishihara, R., Maeda, M., Matsunaga, Y., Ichimura, A., Kyogoku, S., Aoki, H., Katada, S., Nakada, K., Nomura, M., et al. (2014) · Molecular and Cellular Biology · doi:10.1128/mcb.01054-14 · Cited by 200
Mechanisms Orchestrating Mitochondrial Dynamics for Energy Homeostasis
Yu, S. B., & Pekkurnaz, G. (2018) · Journal of Molecular Biology · doi:10.1016/j.jmb.2018.07.027 · Cited by 184
Zhao, Y. G., Liu, N., Miao, G., Chen, Y., Zhao, H., & Zhang, H. (2018) · Current Biology · doi:10.1016/j.cub.2018.03.002 · Cited by 182
Modi, S., López‐Doménech, G., Halff, E. F., Covill‐Cooke, C., Ivankovic, D., Melandri, D., Arancibia‐Cárcamo, I. L., Burden, J. J., Lowe, A. R., & Kittler, J. T. (2019) · Nature Communications · doi:10.1038/s41467-019-12382-4 · Cited by 189
Hallmarks of a new era in mitochondrial biochemistryPreprint
Pagliarini, D. J., & Rutter, J. P. (2013) · Genes & Development · doi:10.1101/gad.229724.113 · Cited by 184
The different facets of organelle interplay—an overview of organelle interactions
Schrader, M., Godinho, L. F., Costello, J. L., & Islinger, M. (2015) · Frontiers in Cell and Developmental Biology · doi:10.3389/fcell.2015.00056 · Cited by 181
Directed Evolution of Split APEX2 Peroxidase
Han, Y., Branon, T. C., Martell, J. D., Boassa, D., Shechner, D. M., Ellisman, M. H., & Ting, A. Y. (2019) · ACS Chemical Biology · doi:10.1021/acschembio.8b00919 · Cited by 185
Regulation of Mammalian Mitochondrial Dynamics: Opportunities and Challenges
Yu, R., Lendahl, U., Nistér, M., & Zhao, J. (2020) · Frontiers in Endocrinology · doi:10.3389/fendo.2020.00374 · Cited by 183
Mitochondrial fusion is required for regulation of mitochondrial DNA replication
Ramos, E. S., Motori, E., Brüser, C., Kühl, I., Yeroslaviz, A., Ruzzenente, B., Kauppila, J. H. K., Busch, J. D., Hultenby, K. R., Habermann, B. H., et al. (2019) · PLoS Genetics · doi:10.1371/journal.pgen.1008085 · Cited by 175
Mitochondrial pathology: stress signals from the energy factory
Raimundo, N. (2014) · Trends in Molecular Medicine · doi:10.1016/j.molmed.2014.01.005 · Cited by 165
Membrane contact sites, gateways for lipid homeostasis
Lahiri, S., Toulmay, A., & Prinz, W. A. (2015) · Current Opinion in Cell Biology · doi:10.1016/j.ceb.2014.12.004 · Cited by 162
Novel roles for actin in mitochondrial fission
Hatch, A. L., Gurel, P. S., & Higgs, H. N. (2014) · Journal of Cell Science · doi:10.1242/jcs.153791 · Cited by 155
Shaping the dynamic mitochondrial network
Lackner, L. L. (2014) · BMC Biology · doi:10.1186/1741-7007-12-35 · Cited by 156
Self-citationDesai, R., Frazier, A. E., Durigon, R., Patel, H., Jones, A. W. E., Rosa, I. D., Lake, N. J., Compton, A. G., Mountford, H. S., Tucker, E. J., et al. (2017) · Brain · doi:10.1093/brain/awx094 · Cited by 150
The regulation of mitochondrial dynamics
Hoppins, S. C. (2014) · Current Opinion in Cell Biology · doi:10.1016/j.ceb.2014.03.005 · Cited by 150
Moltedo, O., Remondelli, P., & Amodio, G. (2019) · Frontiers in Cell and Developmental Biology · doi:10.3389/fcell.2019.00172 · Cited by 147
In situ architecture of the ER–mitochondria encounter structure
Wozny, M. R., Di Luca, A., Morado, D. R., Picco, A., Khaddaj, R., Campomanes, P., Ivanović, L., Hoffmann, P. C., Miller, E. A., Vanni, S., et al. (2023) · Nature · doi:10.1038/s41586-023-06050-3 · Cited by 134
Making connections: interorganelle contacts orchestrate mitochondrial behavior
Klecker, T., Böckler, S., & Westermann, B. (2014) · Trends in Cell Biology · doi:10.1016/j.tcb.2014.04.004 · Cited by 137
Shaping the Endoplasmic Reticulum into a Social Network
Zhang, H., & Hu, J. (2016) · Trends in Cell Biology · doi:10.1016/j.tcb.2016.06.002 · Cited by 126
ER–mitochondria contact sites in yeast: beyond the myths of ERMES
Lang, A. B., Peter, A. T. J., & Kornmann, B. (2015) · Current Opinion in Cell Biology · doi:10.1016/j.ceb.2015.03.002 · Cited by 123
Abeliovich, H., Zarei, M., Rigbolt, K. T. G., Youle, R. J., & Dengjel, J. (2013) · Nature Communications · doi:10.1038/ncomms3789 · Cited by 114
Mitochondria, lysosomes, and dysfunction: their meaning in neurodegeneration
Audano, M., Schneider, A., & Mitro, N. (2018) · Journal of Neurochemistry · doi:10.1111/jnc.14471 · Cited by 118
Mitochondrial Quality Control and Restraining Innate Immunity
Moehlman, A. T., & Youle, R. J. (2020) · Annual Review of Cell and Developmental Biology · doi:10.1146/annurev-cellbio-021820-101354 · Cited by 125
ER Stress-Sensor Proteins and ER-Mitochondrial Crosstalk—Signaling Beyond (ER) Stress Response
Kumar, V., & Maity, S. (2021) · Biomolecules · doi:10.3390/biom11020173 · Cited by 121
Jain, A., & Zoncu, R. (2022) · Molecular Metabolism · doi:10.1016/j.molmet.2022.101481 · Cited by 122
Jeong, H., Park, J., Jun, Y., & Lee, C. (2017) · Proceedings of the National Academy of Sciences · doi:10.1073/pnas.1715592114 · Cited by 108
MIRO-1 Determines Mitochondrial Shape Transition upon GPCR Activation and Ca2+ Stress
Nemani, N., Carvalho, E., Tomar, D., Dong, Z., Ketschek, A., Breves, S. L., Jaña, F., Worth, A. M., Heffler, J., Palaniappan, P., et al. (2018) · Cell Reports · doi:10.1016/j.celrep.2018.03.098 · Cited by 111
Lee, S., Lee, K., Huh, S., Liu, S., Lee, D.-Y., Hong, S. H., Yu, K., & Lu, B. (2016) · Developmental Cell · doi:10.1016/j.devcel.2016.03.023 · Cited by 107
Human Mitochondrial DNA-Protein Complexes Attach to a Cholesterol-Rich Membrane Structure
Gerhold, J. M., Cansız-Arda, Ş., Lõhmus, M., Engberg, O., Reyes, A., van Rennes, H., Sanz, A., Holt, I. J., Cooper, H. M., & Spelbrink, J. N. (2015) · Scientific Reports · doi:10.1038/srep15292 · Cited by 110
The MAMs Structure and Its Role in Cell Death
Wang, N., Wang, C., Zhao, H., He, Y., Lan, B., Sun, L., & Gao, Y. (2021) · Cells · doi:10.3390/cells10030657 · Cited by 110
The Expanding and Unexpected Functions of Mitochondria Contact Sites
Lackner, L. L. (2019) · Trends in Cell Biology · doi:10.1016/j.tcb.2019.02.009 · Cited by 113
Self-citationSuzuki, M., Danilchanka, O., & Mekalanos, J. J. (2014) · Cell Host & Microbe · doi:10.1016/j.chom.2014.09.015 · Cited by 106
The small GTPase Arf1 modulates mitochondrial morphology and function
Ackema, K. B., Hench, J., Böckler, S., Wang, S. C., Sauder, U., Mergentaler, H., Westermann, B., Bard, F., Frank, S., & Spang, A. (2014) · The EMBO Journal · doi:10.15252/embj.201489039 · Cited by 103
The Ancient and Widespread Nature of the ER–Mitochondria Encounter Structure
Wideman, J. G., Gawryluk, R. M. R., Gray, M. W., & Dacks, J. B. (2013) · Molecular Biology and Evolution · doi:10.1093/molbev/mst120 · Cited by 102
Osman, C., Noriega, T. R., Okreglak, V., Fung, J. C., & Walter, P. (2015) · Proceedings of the National Academy of Sciences · doi:10.1073/pnas.1501737112 · Cited by 101
Self-citationElgass, K., Smith, E. A., LeGros, M., Larabell, C. A., & Ryan, M. T. (2015) · Journal of Cell Science · doi:10.1242/jcs.169136 · Cited by 106
Light Microscopy of Mitochondria at the Nanoscale
Jakobs, S., Stephan, T., Ilgen, P., & Brüser, C. (2020) · Annual Review of Biophysics · doi:10.1146/annurev-biophys-121219-081550 · Cited by 92
The Maintenance of Mitochondrial DNA Integrity and Dynamics by Mitochondrial Membranes
Chapman, J., Ng, Y. S., & Nicholls, T. J. J. (2020) · Life · doi:10.3390/life10090164 · Cited by 100
Sidarala, V., Zhu, J., Levi-D’Ancona, E., Pearson, G. L., Reck, E. C., Walker, E. M., Kaufman, B. A., & Soleimanpour, S. A. (2022) · Nature Communications · doi:10.1038/s41467-022-29945-7 · Cited by 100
Highlighting the endoplasmic reticulum-mitochondria connection: Focus on Mitofusin 2
Filadi, R., Greotti, E., & Pizzo, P. (2018) · Pharmacological Research · doi:10.1016/j.phrs.2018.01.003 · Cited by 104
The mitochondria–endoplasmic reticulum contact sites: a signalling platform for cell death
Prudent, J., & McBride, H. M. (2017) · Current Opinion in Cell Biology · doi:10.1016/j.ceb.2017.03.007 · Cited by 94
Vallese, F., Catoni, C., Cieri, D., Barazzuol, L., Ramírez, O. A., Calore, V., Bonora, M., Giamogante, F., Pinton, P., Brini, M., et al. (2020) · Nature Communications · doi:10.1038/s41467-020-19892-6 · Cited by 98
Mitochondrial inheritance in yeast
Westermann, B. (2013) · Biochimica et Biophysica Acta (BBA) - Bioenergetics · doi:10.1016/j.bbabio.2013.10.005 · Cited by 87
Ellenrieder, L., Opaliński, Ł., Becker, L., Krüger, V., Mirus, O., Straub, S. P., Ebell, K., Flinner, N., Stiller, S. B., Guiard, B., et al. (2016) · Nature Communications · doi:10.1038/ncomms13021 · Cited by 84
Subramanian, K., Jochem, A., Vasseur, M. L., Lewis, S. C., Paulson, B. R., Reddy, T. R., Russell, J. D., Coon, J. J., Pagliarini, D. J., & Nunnari, J. M. (2019) · The Journal of Cell Biology · doi:10.1083/jcb.201808044 · Cited by 82
Self-citationIntegrating mitochondrial translation into the cellular context
Richter-Dennerlein, R., Dennerlein, S., & Rehling, P. (2015) · Nature Reviews Molecular Cell Biology · doi:10.1038/nrm4051 · Cited by 81
Lin, S., Huang, C., Gunda, V., Sun, J., Chellappan, S., Li, Z., Izumi, V., Fang, B., Koomen, J. M., Singh, P. K., et al. (2019) · Cell Reports · doi:10.1016/j.celrep.2019.08.011 · Cited by 82
Mitochondria-Associated Membranes (MAMs): Overview and Its Role in Parkinson’s Disease
Rodríguez‐Arribas, M., Yakhine-Diop, S. M. S., Pedro, J. M. B., Gómez‐Suaga, P., Gómez‐Sánchez, R., Martínez-Chacón, G., Fuentes, J. M., González‐Polo, R. A., & Niso‐Santano, M. (2016) · Molecular Neurobiology · doi:10.1007/s12035-016-0140-8 · Cited by 82
Ping, H. A., Kraft, L. M., Chen, W., Nilles, A. E., & Lackner, L. L. (2016) · Journal of Cell Biology · doi:10.1083/jcb.201511021 · Cited by 82
Self-citationMIRO GTPases in Mitochondrial Transport, Homeostasis and Pathology
Tang, B. L. (2015) · Cells · doi:10.3390/cells5010001 · Cited by 81
Maria Jose Perez, J., Ponce, D. P., Osorio‐Fuentealba, C., Behrens, M. I., & Quintanilla, R. A. (2017) · Frontiers in Neuroscience · doi:10.3389/fnins.2017.00553 · Cited by 81
Miro: A molecular switch at the center of mitochondrial regulation
Eberhardt, E. L., Ludlam, A. V., Tan, Z., & Cianfrocco, M. A. (2020) · Protein Science · doi:10.1002/pro.3839 · Cited by 82
Assembly of β-barrel proteins in the mitochondrial outer membrane
Höhr, A. I. C., Straub, S. P., Warscheid, B., Becker, T., & Wiedemann, N. (2014) · Biochimica et Biophysica Acta (BBA) - Molecular Cell Research · doi:10.1016/j.bbamcr.2014.10.006 · Cited by 78
Bioenergetic roles of mitochondrial fusion
Ramos, E. S., Larsson, N., & Mourier, A. (2016) · Biochimica et Biophysica Acta (BBA) - Bioenergetics · doi:10.1016/j.bbabio.2016.04.002 · Cited by 79
Structural coupling of the EF hand and C‐terminal GTPase domains in the mitochondrial protein Miro
Klosowiak, J. L., Focia, P. J., Chakravarthy, S., Landahl, E. C., Freymann, D. M., & Rice, S. E. (2013) · EMBO Reports · doi:10.1038/embor.2013.151 · Cited by 78
Metadata
- Authors
- Murley, A., Lackner, L. L., Osman, C., West, M., Voeltz, G. K., Walter, P., & Nunnari, J.
- Affiliations
- University of California, Davis (US)
- University of California, San Francisco (US)
- University of Colorado Boulder (US)
- Howard Hughes Medical Institute (US)
- Corresponding author
- Nunnari, Jodi
- Venue
- eLife
- Publisher
- eLife Sciences Publications, Ltd
- Published
- 2013-05-14
- Volume
- 2
- Pages
- e00422-e00422
- ISSN
- 2050-084X (ISSN-L)
- PMC
- PMC3654481
- OpenAlex
- W2130893307
- Cited by
- 326
- References
- 55
- Citations by year
- 2026: 7 · 2025: 20 · 2024: 17 · 2023: 16 · 2022: 19 · 2021: 26 · 2020: 34 · 2019: 27 · 2018: 32 · 2017: 26 · 2016: 29 · 2015: 28 · 2014: 31 · 2013: 14
- FWCI
- 15.24
- Type
- journal article
- Language
- en
- Open access
- gold
- doi.org
- Licence
- Locations
- eLife (publishedVersion, cc-by)
- Europe PMC (PubMed Central) (publishedVersion, cc-by)
- PubMed Central (publishedVersion, cc-by)
- PubMed (publishedVersion)
- DOAJ (DOAJ: Directory of Open Access Journals) (submittedVersion, cc-by-sa)
- eScholarship (California Digital Library) (submittedVersion)
- Funders
- National Institutes of Health (5T32GM007377-34, R01GM097432, RO1GM083977)
- Howard Hughes Medical Institute
- Human Frontier Science Program
- Topics
- Life Sciences › Biochemistry, Genetics and Molecular Biology › Molecular Biology › Mitochondrial Function and Pathology
- Life Sciences › Biochemistry, Genetics and Molecular Biology › Cell Biology › Autophagy in Disease and Therapy
- Life Sciences › Biochemistry, Genetics and Molecular Biology › Molecular Biology › Fungal and yeast genetics research
- Keywords
- mitochondrial division, ER-mitochondria contact sites, ERMES, mitochondrial nucleoids, mitochondrial DNA segregation, mitochondrial distribution, yeast
- MeSH terms
- DNA, Fungal, DNA, Mitochondrial, Endoplasmic Reticulum, Mitochondria, Saccharomyces cerevisiae, Signal Transduction, Saccharomyces cerevisiae Proteins, Multiprotein Complexes, Mitochondrial Dynamics
About these checks
Registry, retraction, Cites and statistics results are computed, not judged, with one exception: a printed reference that no index lists is read once by a model before it counts as a citation error. Claims are extracted by a model and kept only when their quote appears verbatim in the text; each cited source is then checked, with a model’s help, for whether it says what the claim relies on. Those verdicts can be wrong — read the claim’s quote and the cited source before relying on one.
Statistics and arithmetic are recomputed, not judged.
Confidence bands are shown only for fields calibrated on our annotated test set. None is calibrated yet, so no band is shown.
What counts as a claim ›How we measure confidence ›How we check this ›
Are you an author, or do you see a problem with this page? Request a review
