

The DOI matches its Crossref record; 64 of the 64 references it cites were found in a registry or an index.
Fatty acid remodeling by LPCAT3 enriches arachidonate in phospholipid membranes and regulates triglyceride transport
Open accessAbstract
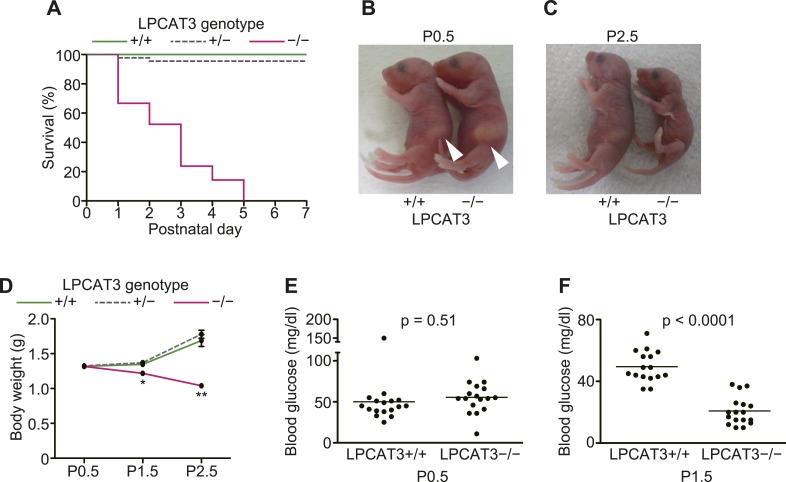
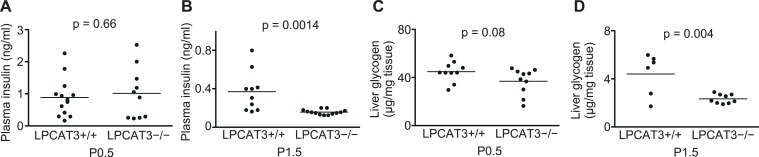
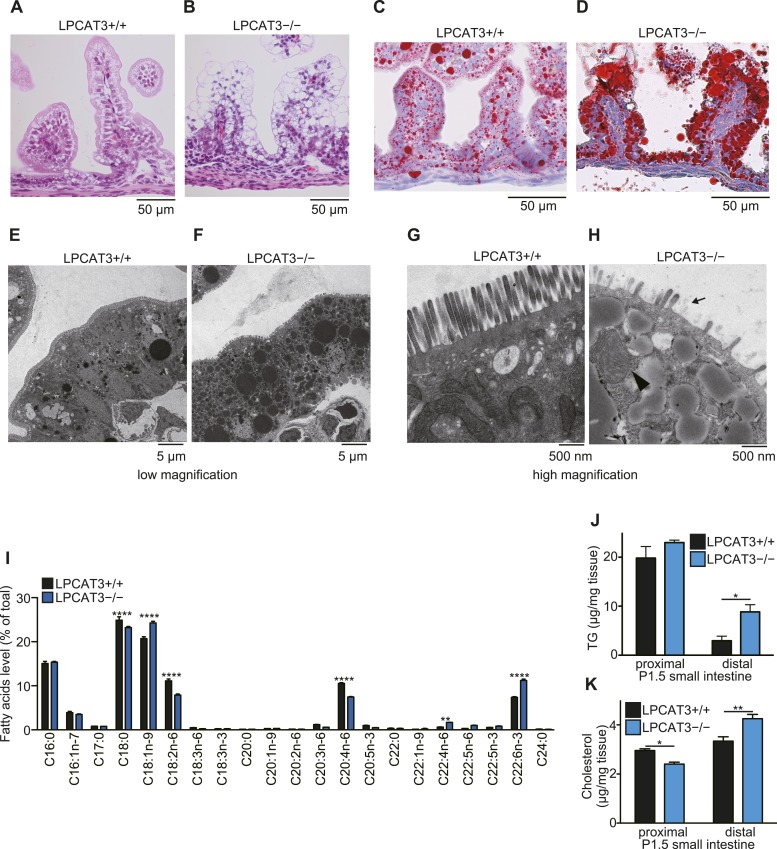
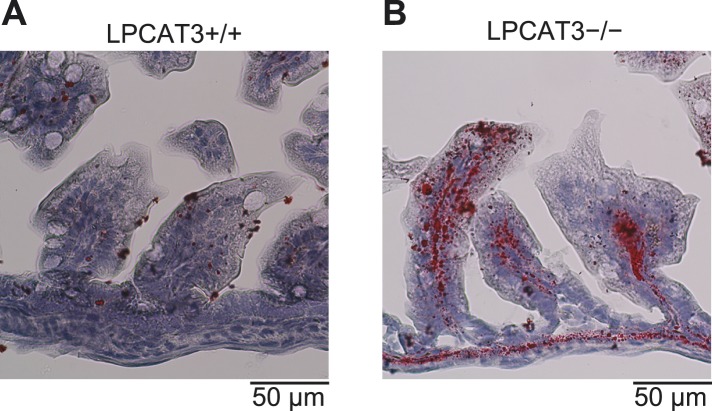
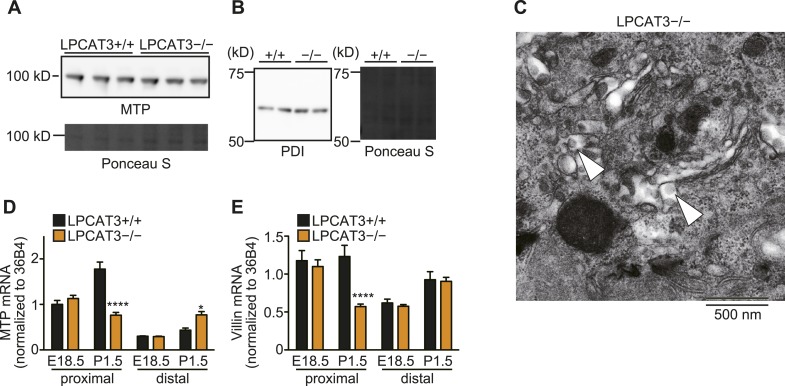
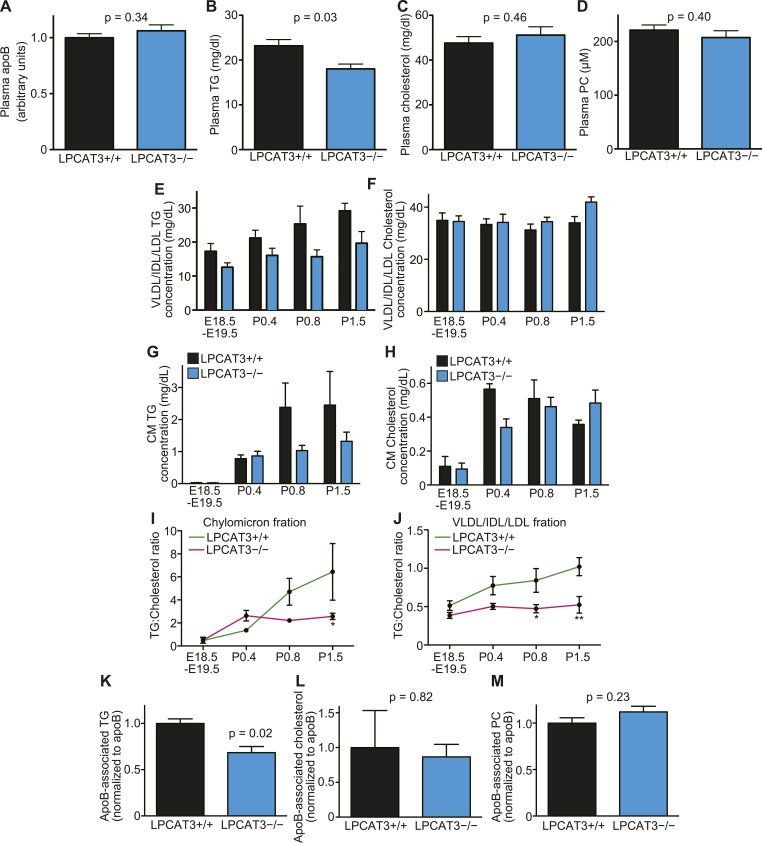
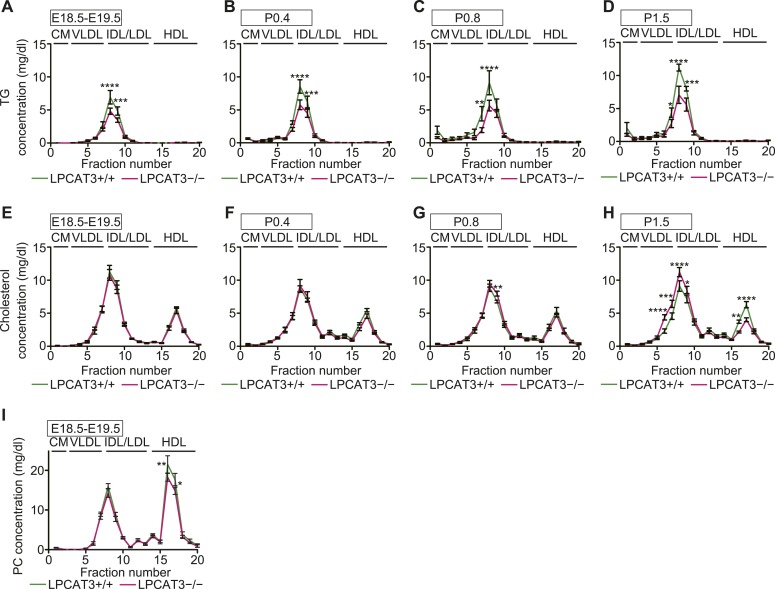
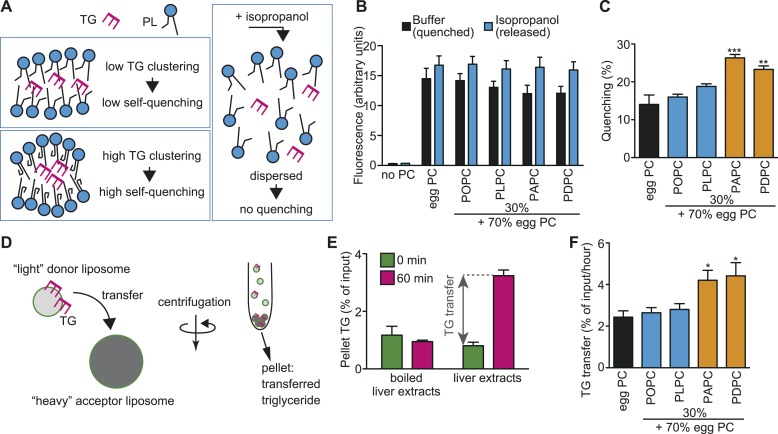
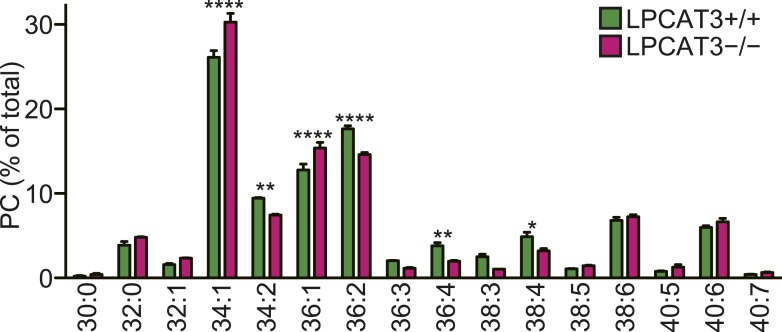
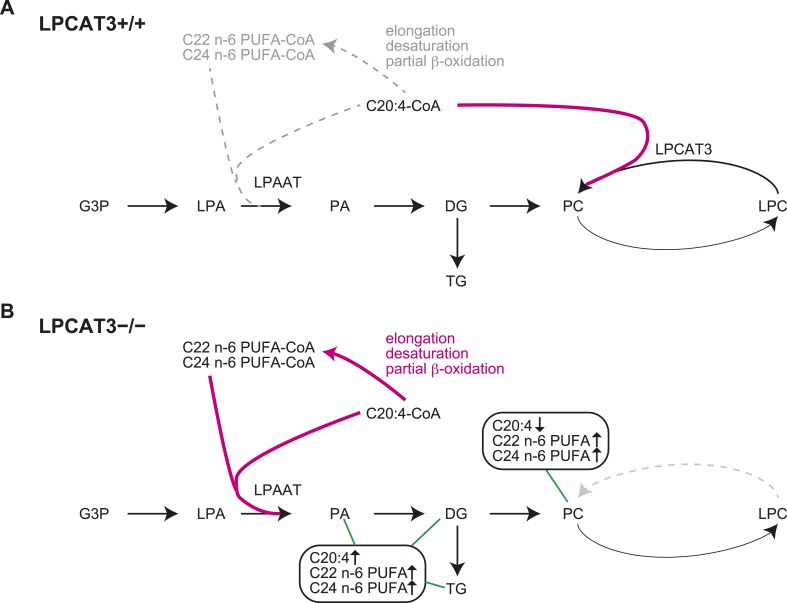
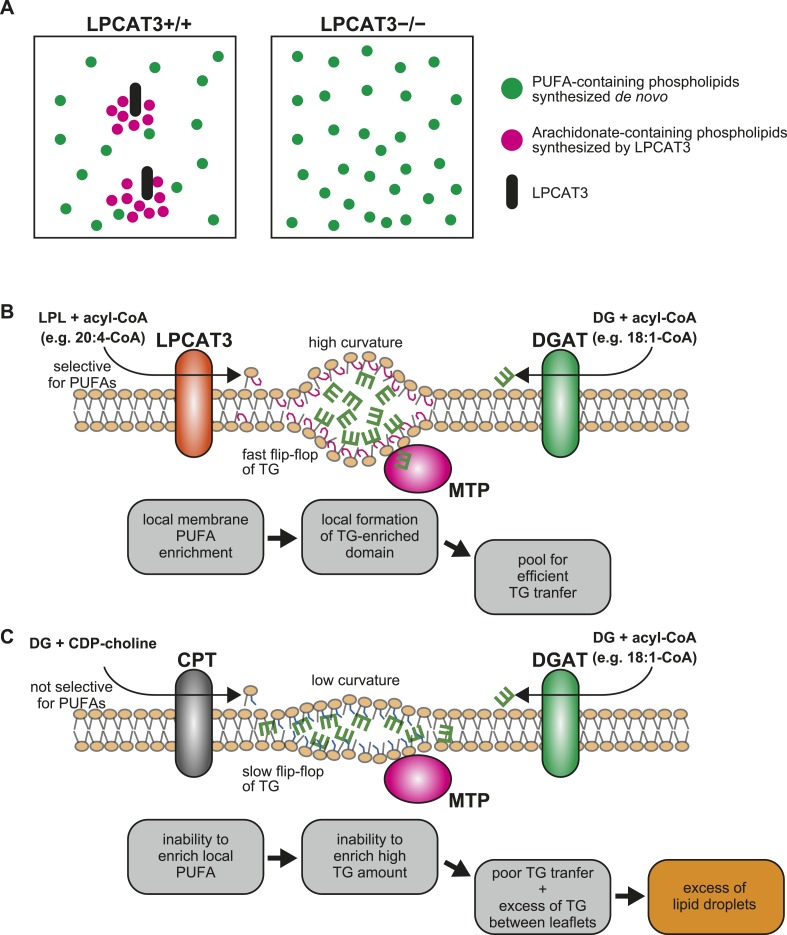
Polyunsaturated fatty acids (PUFAs) in phospholipids affect the physical properties of membranes, but it is unclear which biological processes are influenced by their regulation. For example, the functions of membrane arachidonate that are independent of a precursor role for eicosanoid synthesis remain largely unknown. Here, we show that the lack of lysophosphatidylcholine acyltransferase 3 (LPCAT3) leads to drastic reductions in membrane arachidonate levels, and that LPCAT3-deficient mice are neonatally lethal due to an extensive triacylglycerol (TG) accumulation and dysfunction in enterocytes. We found that high levels of PUFAs in membranes enable TGs to locally cluster in high density, and that this clustering promotes efficient TG transfer. We propose a model of local arachidonate enrichment by LPCAT3 to generate a distinct pool of TG in membranes, which is required for normal directionality of TG transfer and lipoprotein assembly in the liver and enterocytes.
Overview
The claims and statistics of this paper haven’t been checked yet.
Run the check — free, no account needed. It reads the open-access text and checks the sources it cites.
Integrity signals
Registry
Cites
Statistics
Figures
Verification
Claims the paper makes
The claims and statistics of this paper haven’t been checked yet.
Run the check — free, no account needed. It reads the open-access text and checks the sources it cites.
Claims other papers make about this one
Each is checked against this paper’s own text: does it say what the citing paper says it does?
The source backs part of the claim, not all of it — or backs it for a different population, condition or comparison.
In the citing paper
“High PL unsaturation may modify membrane physical properties and augment release of CE and TAG-containing vesicles from ER45,46.”
From An iPSC-derived astrocyte model of fragile X syndrome exhibits dysregulated cholesterol homeostasis (2023) · cites this paper as [45]
Experimental — accuracy not yet measured
Self-check
Percentages, sums and reported differences re-computed from the paper’s own numbers.
The self-check needs the paper’s full text.
Citations
Cites
A RAPID METHOD OF TOTAL LIPID EXTRACTION AND PURIFICATION
Bligh, E. G., & Dyer, W. J. (1959) · Canadian Journal of Biochemistry and Physiology · doi:10.1139/o59-099 · Cited by 54,751
Genome engineering using the CRISPR-Cas9 system
Ran, F. A., Hsu, P. D., Wright, J., Agarwala, V., Scott, D. A., & Zhang, F. (2013) · Nature Protocols · doi:10.1038/nprot.2013.143 · Cited by 11,133
Efficient selection for high-expression transfectants with a novel eukaryotic vector
Niwa, H., Yamamura, K., & Miyazaki, J. (1991) · Gene · doi:10.1016/0378-1119(91)90434-d · Cited by 5,149
A One Pot, One Step, Precision Cloning Method with High Throughput Capability
Engler, C., Kandzia, R., & Marillonnet, S. (2008) · PLoS ONE · doi:10.1371/journal.pone.0003647 · Cited by 2,434
Warnick, G. R., Benderson, J., & Albers, J. J. (1982) · Clinical Chemistry · doi:10.1093/clinchem/28.6.1379 · Cited by 2,154
Effect of Chain Length and Unsaturation on Elasticity of Lipid Bilayers
Rawicz, W., Olbrich, K. C., McIntosh, T. J., Needham, D., & Evans, E. A. (2000) · Biophysical Journal · doi:10.1016/s0006-3495(00)76295-3 · Cited by 1,938
The Opposing Effects of N-3 and n-6 Fatty Acids
Schmitz, G., & Ecker, J. (2008) · Progress in Lipid Research · doi:10.1016/j.plipres.2007.12.004 · Cited by 1,245
Dennis, E. A., Cao, J., Hsu, Y., Magrioti, V., & Kokotos, G. (2011) · Chemical Reviews · doi:10.1021/cr200085w · Cited by 1,241
Thematic review series: Glycerolipids. DGAT enzymes and triacylglycerol biosynthesis
Yen, C.-L. E., Stone, S. J., Koliwad, S., Harris, C., & Farese, R. V. (2008) · Journal of Lipid Research · doi:10.1194/jlr.r800018-jlr200 · Cited by 1,105
The biophysics and cell biology of lipid droplets
Thiam, A. R., Farese Jr, R. V., & Walther, T. C. (2013) · Nature Reviews Molecular Cell Biology · doi:10.1038/nrm3699 · Cited by 986
Cited by
Sorted by citations
Understanding the diversity of membrane lipid composition
原山, 武., & Riezman, H. (2018) · Nature Reviews Molecular Cell Biology · doi:10.1038/nrm.2017.138 · Cited by 2,140
van der Veen, J. N., Kennelly, J. P., Wan, S., Vance, J. E., Vance, D. E., & Jacobs, R. L. (2017) · Biochimica et Biophysica Acta (BBA) - Biomembranes · doi:10.1016/j.bbamem.2017.04.006 · Cited by 1,514
The Various Roles of Fatty Acids
de Carvalho, C. C. C. R., & Caramujo, M.-J. (2018) · Molecules · doi:10.3390/molecules23102583 · Cited by 997
Lipid metabolism in cancer: New perspectives and emerging mechanisms
Broadfield, L. A., Pane, A. A., Talebi, A., Swinnen, J. V., & Fendt, S. (2021) · Developmental Cell · doi:10.1016/j.devcel.2021.04.013 · Cited by 793
Lipidomics for studying metabolism
Han, X. (2016) · Nature Reviews Endocrinology · doi:10.1038/nrendo.2016.98 · Cited by 727
Liver X receptors in lipid signalling and membrane homeostasis
Wang, B., & Tontonoz, P. (2018) · Nature Reviews Endocrinology · doi:10.1038/s41574-018-0037-x · Cited by 722
Ferroptosis in cancer and cancer immunotherapy
Zhao, L., Zhou, X., Xie, F., Zhang, L., Yan, H., Huang, J., Zhang, C., Zhou, F., Chen, J., & Zhang, L. (2022) · Cancer Communications · doi:10.1002/cac2.12250 · Cited by 684
Lipid Peroxidation-Dependent Cell Death Regulated by GPx4 and Ferroptosis
Imai, H., Matsuoka, M., Kumagai, T., Sakamoto, T., & Koumura, T. (2016) · Current topics in microbiology and immunology · doi:10.1007/82_2016_508 · Cited by 635
Phospholipid Remodeling in Physiology and Disease
Wang, B., & Tontonoz, P. (2018) · Annual Review of Physiology · doi:10.1146/annurev-physiol-020518-114444 · Cited by 558
Lipid metabolism in sickness and in health: Emerging regulators of lipotoxicity
Yoon, H., Shaw, J. L., Haigis, M. C., & Greka, A. (2021) · Molecular Cell · doi:10.1016/j.molcel.2021.08.027 · Cited by 538
The application of Ferroptosis in diseases
Qiu, Y., Cao, Y., Cao, W., Jia, Y., & Lu, N. (2020) · Pharmacological Research · doi:10.1016/j.phrs.2020.104919 · Cited by 415
Ferroptosis in Cancer Cell Biology
Bebber, C. M., Müller, F., Clemente, L. P., Weber, J., & von Karstedt, S. (2020) · Cancers · doi:10.3390/cancers12010164 · Cited by 372
ER Membrane Phospholipids and Surface Tension Control Cellular Lipid Droplet Formation
M’Barek, K. B., Ajjaji, D., Chorlay, A., Vanni, S., Foret, L., & Thiam, A. R. (2017) · Developmental Cell · doi:10.1016/j.devcel.2017.05.012 · Cited by 278
Ferroptosis: when metabolism meets cell death
Zheng, J., & Conrad, M. (2024) · Physiological Reviews · doi:10.1152/physrev.00031.2024 · Cited by 286
Liver X receptors link lipid metabolism and inflammation
Schulman, I. G. (2017) · FEBS Letters · doi:10.1002/1873-3468.12702 · Cited by 244
Bi, J., Ichu, T.-A., Zanca, C., Yang, H., Zhang, W., Gu, Y., Chowdhry, S., Reed, A., Ikegami, S., Turner, K. M., et al. (2019) · Cell Metabolism · doi:10.1016/j.cmet.2019.06.014 · Cited by 229
Smagris, E., Gilyard, S., BasuRay, S., Cohen, J. C., & Hobbs, H. H. (2016) · Journal of Biological Chemistry · doi:10.1074/jbc.m116.719955 · Cited by 226
An integrated view of lipid metabolism in ferroptosis revisited via lipidomic analysis
Kim, J. W., Lee, J.-Y., Oh, M., & Lee, E. (2023) · Experimental & Molecular Medicine · doi:10.1038/s12276-023-01077-y · Cited by 251
Roles of polyunsaturated fatty acids, from mediators to membranes
原山, 武., & Shimizu, T. (2020) · Journal of Lipid Research · doi:10.1194/jlr.r120000800 · Cited by 224
Self-citationConza, G. D., Tsai, C.-H., Gallart‐Ayala, H., Yu, Y.-R., Franco, F., Zaffalon, L., Xie, X., Li, X., Xiao, Z., Raines, L. N., et al. (2021) · Nature Immunology · doi:10.1038/s41590-021-01047-4 · Cited by 216
Review of Eukaryote Cellular Membrane Lipid Composition, with Special Attention to the Fatty Acids
Ali, O., & Szabó, A. (2023) · International Journal of Molecular Sciences · doi:10.3390/ijms242115693 · Cited by 223
Targeting de novo lipogenesis and the Lands cycle induces ferroptosis in KRAS-mutant lung cancer
Bartolacci, C., Andreani, C., do Vale, G. D., Berto, S., Melegari, M., Crouch, A. C., Baluya, D. L., Kemble, G. W., Hodges, K. B., Starrett, J. H., et al. (2022) · Nature Communications · doi:10.1038/s41467-022-31963-4 · Cited by 183
Reed, A., Ichu, T.-A., Milosevich, N., Melillo, B. N., Schafroth, M. A., Otsuka, Y., Scampavia, L. D., Spicer, T., & Cravatt, B. F. (2022) · ACS Chemical Biology · doi:10.1021/acschembio.2c00317 · Cited by 169
Metabolism and functions of docosahexaenoic acid‐containing membrane glycerophospholipids
Hishikawa, D., Valentine, W. J., Iizuka‐Hishikawa, Y., Shindou, H., & Shimizu, T. (2017) · FEBS Letters · doi:10.1002/1873-3468.12825 · Cited by 172
Self-citationManni, M. M., Tiberti, M. L., Pagnotta, S., Barelli, H., Gautier, R., & Antonny, B. (2018) · eLife · doi:10.7554/elife.34394 · Cited by 150
Lipid Metabolism in Ferroptosis
Lin, Z., Liu, J., Kang, R., Yang, M., & Tang, D. (2021) · Advanced Biology · doi:10.1002/adbi.202100396 · Cited by 157
Xu, Y., Li, K., Zhao, Y., Zhou, L., Liu, Y., & Zhao, J. (2022) · Cellular and Molecular Neurobiology · doi:10.1007/s10571-022-01196-6 · Cited by 151
D’Aquila, T., Hung, Y.-H., Carreiro, A. L., & Buhman, K. K. (2016) · Biochimica et Biophysica Acta (BBA) - Molecular and Cell Biology of Lipids · doi:10.1016/j.bbalip.2016.04.012 · Cited by 142
Wang, B., Rong, X., Duerr, M. A., Hermanson, D. J., Hedde, P. N., Wong, J. S., Vallim, T. Q. D. A., Cravatt, B. F., Gratton, E., Ford, D. A., et al. (2016) · Cell Metabolism · doi:10.1016/j.cmet.2016.01.001 · Cited by 129
New appreciation for an old pathway: the Lands Cycle moves into new arenas in health and disease
O’Donnell, V. B. (2022) · Biochemical Society Transactions · doi:10.1042/bst20210579 · Cited by 125
Valentine, W. J., Yanagida, K., Kawana, H., Kono, N., Noda, N. N., Aoki, J., & Shindou, H. (2021) · Journal of Biological Chemistry · doi:10.1016/j.jbc.2021.101470 · Cited by 127
Self-citationThe structural basis for the phospholipid remodeling by lysophosphatidylcholine acyltransferase 3
Zhang, Q., Yao, D., Rao, B., Jian, L., Chen, Y., Hu, K., Xia, Y., Li, S., Shen, Y., Qin, A., et al. (2021) · Nature Communications · doi:10.1038/s41467-021-27244-1 · Cited by 113
Lipid unsaturation and organelle dynamics
Barelli, H., & Antonny, B. (2016) · Current Opinion in Cell Biology · doi:10.1016/j.ceb.2016.03.012 · Cited by 119
Regulation of Chylomicron Secretion: Focus on Post-Assembly Mechanisms
Xiao, C., Stahel, P., & Lewis, G. F. (2018) · Cellular and Molecular Gastroenterology and Hepatology · doi:10.1016/j.jcmgh.2018.10.015 · Cited by 114
Cytosolic phospholipase A2 and lysophospholipid acyltransferases
Kita, Y., Shindou, H., & Shimizu, T. (2018) · Biochimica et Biophysica Acta (BBA) - Molecular and Cell Biology of Lipids · doi:10.1016/j.bbalip.2018.08.006 · Cited by 105
Self-citationThe lipid basis of cell death and autophagy
Lin, Z., Long, F., Kang, R., Klionsky, D. J., Yang, M., & Tang, D. (2023) · Autophagy · doi:10.1080/15548627.2023.2259732 · Cited by 107
Regulation of ferroptosis by PI3K/Akt signaling pathway: a promising therapeutic axis in cancer
Su, H., Peng, C., & Liu, Y. (2024) · Frontiers in Cell and Developmental Biology · doi:10.3389/fcell.2024.1372330 · Cited by 105
Cheng, H., Wang, M., Su, J., Li, Y., Jiao, L., Chu, J., Wan, X., Cao, Y., & Li, Q. (2022) · Life · doi:10.3390/life12060784 · Cited by 116
Bouchaoui, H., Mahoney‐Sanchez, L., Garçon, G., Berdeaux, O., Alleman, L., Devos, D., Duce, J. A., & Devedjian, J.-C. (2022) · Free Radical Biology and Medicine · doi:10.1016/j.freeradbiomed.2022.12.086 · Cited by 112
Johnson, S. M., Bao, H., McMahon, C. E., Chen, Y., Burr, S. D., Anderson, A. M., Madeyski-Bengtson, K., Lindén, D., Han, X., & Liu, J. (2024) · Nature Communications · doi:10.1038/s41467-024-49224-x · Cited by 100
Intestinal CD36 and Other Key Proteins of Lipid Utilization: Role in Absorption and Gut Homeostasis
Cifarelli, V., & Abumrad, N. A. (2018) · Comprehensive physiology · doi:10.1002/cphy.c170026 · Cited by 127
MBOAT7 down-regulation by genetic and environmental factors predisposes to MAFLD
Meroni, M., Longo, M., Fracanzani, A. L., & Dongiovanni, P. (2020) · EBioMedicine · doi:10.1016/j.ebiom.2020.102866 · Cited by 92
Gong, Z., Guo, J., Liu, B., Guo, Y., Cheng, C., Jiang, Y., Liang, N., Hu, M., Song, T., Yang, L., et al. (2024) · Frontiers in Immunology · doi:10.3389/fimmu.2023.1287857 · Cited by 97
MBOAT7 Down-Regulation by Hyperinsulinemia Induces Fat Accumulation in Hepatocytes
Meroni, M., Dongiovanni, P., Longo, M., Carli, F., Baselli, G., Rametta, R., Pelusi, S., Badiali, S., Maggioni, M., Gaggini, M., et al. (2019) · EBioMedicine · doi:10.1016/j.ebiom.2020.102658 · Cited by 84
Fat of the Gut: Epithelial Phospholipids in Inflammatory Bowel Diseases
Boldyreva, L. V., Morozova, M. V., Medvedeva, S. S., & Kozhevnikova, E. N. (2021) · International Journal of Molecular Sciences · doi:10.3390/ijms222111682 · Cited by 94
Ferroptosis in viral infection: the unexplored possibility
Wang, M., Banda, J., Jin, N., Du, S., & Li, C. (2021) · Acta Pharmacologica Sinica · doi:10.1038/s41401-021-00814-1 · Cited by 92
Li, Z., Jiang, H., Ding, T., Lou, C., Bui, H. H., Kuo, M., & Jiang, X. (2015) · Gastroenterology · doi:10.1053/j.gastro.2015.07.012 · Cited by 84
Zooming in and out of ferroptosis in human disease
Wang, X., Zhou, Y., Min, J., & Wang, F. (2023) · Frontiers of Medicine · doi:10.1007/s11684-023-0992-z · Cited by 85
Ferroptosis and Iron Homeostasis: Molecular Mechanisms and Neurodegenerative Disease Implications
Abdukarimov, N., Kokabi, K., & Kunz, J. (2025) · Antioxidants · doi:10.3390/antiox14050527 · Cited by 93
Emerging Role of Ferroptosis in the Pathogenesis of Ischemic Stroke: A New Therapeutic Target?
Bu, Z., Yu, H., Wang, J., He, X., Cui, Y., Feng, J., & Feng, J. (2021) · ASN NEURO · doi:10.1177/17590914211037505 · Cited by 91
Ferroptosis: From regulation of lipid peroxidation to the treatment of diseases
Lv, Y., Wu, M., Wang, Z., & Wang, J. (2022) · Cell Biology and Toxicology · doi:10.1007/s10565-022-09778-2 · Cited by 87
Kolahi, K. S., Louey, S., Varlamov, O., & Thornburg, K. L. R. (2016) · PLoS ONE · doi:10.1371/journal.pone.0153522 · Cited by 81
Iizuka‐Hishikawa, Y., Hishikawa, D., Sasaki, J., Takubo, K., Goto, M., Nagata, K., Nakanishi, H., Shindou, H., Okamura, T., Ito, C., et al. (2017) · Journal of Biological Chemistry · doi:10.1074/jbc.m117.791277 · Cited by 82
Self-citationRecent advances in triacylglycerol mobilization by the gut
Xiao, C., Stahel, P., Carreiro, A. L., Buhman, K. K., & Lewis, G. F. (2018) · Trends in Endocrinology & Metabolism · doi:10.1016/j.tem.2017.12.001 · Cited by 77
Beyond Fluidity: The Role of Lipid Unsaturation in Membrane FunctionPreprint
原山, 武., & Antonny, B. (2023) · Cold Spring Harbor Perspectives in Biology · doi:10.1101/cshperspect.a041409 · Cited by 76
Sets of coregulated serum lipids are associated with Alzheimer's disease pathophysiology
Barupal, D. K., Baillie, R., Fan, S., Saykin, A. J., Meikle, P. J., Arnold, M., Nho, K. T., Fiehn, O., Kaddurah‐Daouk, R., & Initiative, A. D. N. (2019) · Alzheimer s & Dementia Diagnosis Assessment & Disease Monitoring · doi:10.1016/j.dadm.2019.07.002 · Cited by 68
Lack of VMP1 impairs hepatic lipoprotein secretion and promotes non-alcoholic steatohepatitis
Jiang, X., Fulte, S., Deng, F., Chen, S., Xie, Y., Chao, X., He, X. C., Zhang, Y., Li, T., Li, F., et al. (2022) · Journal of Hepatology · doi:10.1016/j.jhep.2022.04.010 · Cited by 76
Naoe, S., Tsugawa, H., Takahashi, M., Ikeda, K., & Arita, M. (2019) · Metabolites · doi:10.3390/metabo9100241 · Cited by 72
LipidSig: a web-based tool for lipidomic data analysis
Lin, W.-J., Shen, P.-C., Liu, H.-C., Cho, Y.-C., Hsu, M.-K., Lin, I.-C., Chen, G. T. Y., Yang, J., Ma, W., & Cheng, W. (2021) · Nucleic Acids Research · doi:10.1093/nar/gkab419 · Cited by 68
Phadnis, V. V., Snider, J. D., Varadharajan, V., Ramachandiran, I., Deik, A., Lai, Z. W., Kunchok, T., Eaton, E. N., Sebastiany, C., Lyakisheva, A., et al. (2023) · Cell Reports · doi:10.1016/j.celrep.2023.113023 · Cited by 73
Pancreatic and mucosal enzymes in choline phospholipid digestion
Nilsson, Å., & Duan, R. (2018) · American Journal of Physiology-Gastrointestinal and Liver Physiology · doi:10.1152/ajpgi.00320.2018 · Cited by 70
Ferroptosis as a new tool for tumor suppression through lipid peroxidation
Yang, X. P., Liu, Y., Wang, Z., Jin, Y., & Gu, W. J. (2024) · Communications Biology · doi:10.1038/s42003-024-07180-8 · Cited by 73
A role for phosphatidylcholine and phosphatidylethanolamine in hepatic insulin signaling
van der Veen, J. N., Lingrell, S., McCloskey, N. S., LeBlond, N. D., Galleguillos, D., Zhao, Y., Curtis, J. M., Sipione, S., Fullerton, M. D., Vance, D. E., et al. (2019) · The FASEB Journal · doi:10.1096/fj.201802117r · Cited by 65
Miranda, D. A., Krause, W. C., Cazenave‐Gassiot, A., Suzawa, M., Escusa, H. S., Foo, J. C., Shihadih, D. S., Stahl, A., Fitch, M. D., Nyangau, E., et al. (2018) · JCI Insight · doi:10.1172/jci.insight.96151 · Cited by 64
Thomas, M. H., Pelleïeux, S., Vitale, N., & Olivier, J. L. (2016) · Biochimie · doi:10.1016/j.biochi.2016.07.013 · Cited by 60
Hyperuricemia induces lipid disturbances mediated by LPCAT3 upregulation in the liver
Liu, N., Sun, Q., Xu, H., Yu, X., Chen, W., Wei, H., Jiang, J., Xu, Y., & Lu, W. (2020) · The FASEB Journal · doi:10.1096/fj.202000950r · Cited by 57
Digestion and Absorption of Milk Phospholipids in Newborns and Adults
Nilsson, Å., Duan, R., & Ohlsson, L. (2021) · Frontiers in Nutrition · doi:10.3389/fnut.2021.724006 · Cited by 57
Ma, X., Qian, H., Chen, A., Ni, H., & Ding, W. (2021) · Cells · doi:10.3390/cells10092273 · Cited by 61
Ferroptosis in cancer immunity and immunotherapy: Multifaceted interplay and clinical implications
Zhai, X., Lin, Y., Zhu, L., Wang, Y., Zhang, J., Liu, J., Li, L., & Lu, X. (2023) · Cytokine & Growth Factor Reviews · doi:10.1016/j.cytogfr.2023.08.004 · Cited by 58
Lagrost, L., & Masson, D. (2022) · Current Opinion in Lipidology · doi:10.1097/mol.0000000000000820 · Cited by 57
Liver X receptors and liver physiology
Russo-Savage, L., & Schulman, I. G. (2021) · Biochimica et Biophysica Acta (BBA) - Molecular Basis of Disease · doi:10.1016/j.bbadis.2021.166121 · Cited by 55
Acyl-CoA synthetases as regulators of brain phospholipid acyl-chain diversity
Fernandez, R. F., & Ellis, J. M. (2020) · Prostaglandins Leukotrienes and Essential Fatty Acids · doi:10.1016/j.plefa.2020.102175 · Cited by 53
Ferroptosis: A Promising Therapeutic Target for Neonatal Hypoxic-Ischemic Brain Injury
Peeples, E. S., & Genaro‐Mattos, T. C. (2022) · International Journal of Molecular Sciences · doi:10.3390/ijms23137420 · Cited by 51
Zhang, P., Csaki, L. S., Ronquillo, E., Baufeld, L., Lin, J. Y., Gutierrez, A., Dwyer, J. R., Brindley, D. N., Fong, L. G., Tontonoz, P., et al. (2018) · Journal of Clinical Investigation · doi:10.1172/jci122595 · Cited by 49
Thomas, C., Jalil, A., Magnani, C., Ishibashi, M., Quéré, R., Bourgeois, T., Bergas, V., Ménégaut, L., Patoli, D., Guern, N. L., et al. (2018) · Atherosclerosis · doi:10.1016/j.atherosclerosis.2018.05.023 · Cited by 49
Genome-Wide Epistatic Interaction Networks Affecting Feed Efficiency in Duroc and Landrace Pigs
Banerjee, P., Carmelo, V. A. O., & Kadarmideen, H. N. (2020) · Frontiers in Genetics · doi:10.3389/fgene.2020.00121 · Cited by 48
A Unique Junctional Interface at Contact Sites Between the Endoplasmic Reticulum and Lipid Droplets
Choudhary, V., & Schneiter, R. (2021) · Frontiers in Cell and Developmental Biology · doi:10.3389/fcell.2021.650186 · Cited by 46
Raman microscopy-based quantification of the physical properties of intracellular lipids
Uematsu, M., & Shimizu, T. (2021) · Communications Biology · doi:10.1038/s42003-021-02679-w · Cited by 43
Self-citationGu, X., Huang, Z., Ying, X., Liu, X., Ruan, K., Hua, S., Zhang, X., Jin, H., Liu, Q., & Yang, J. (2024) · Cell Death Discovery · doi:10.1038/s41420-024-02007-1 · Cited by 43
Revisiting the Role of LXRs in PUFA Metabolism and Phospholipid Homeostasis
Jalil, A., Bourgeois, T., Ménégaut, L., Lagrost, L., Thomas, C., & Masson, D. (2019) · International Journal of Molecular Sciences · doi:10.3390/ijms20153787 · Cited by 44
Kabir, I., Li, Z., Bui, H. H., Kuo, M., Gao, G., & Jiang, X. (2016) · Journal of Biological Chemistry · doi:10.1074/jbc.m115.697011 · Cited by 42
Matsuo, N., Nagao, K., Suito, T., Juni, N., Kato, U., Hara, Y., & Umeda, M. (2019) · Journal of Lipid Research · doi:10.1194/jlr.m090779 · Cited by 38
The Lysophosphatidylserines—An Emerging Class of Signalling Lysophospholipids
Shanbhag, K., Mhetre, A. B., Khandelwal, N., & Kamat, S. S. (2020) · The Journal of Membrane Biology · doi:10.1007/s00232-020-00133-2 · Cited by 40
Hishikawa, D., Yanagida, K., Nagata, K., Kanatani, A., Iizuka, Y., Hamano, F., Yasuda, M., Okamura, T., Shindou, H., & Shimizu, T. (2020) · iScience · doi:10.1016/j.isci.2020.101495 · Cited by 45
Self-citationHayashi, Y., Lee, H., Nakamura, E., Tada, N., Yokomizo, T., Fujiwara, Y., & Ichi, I. (2021) · FEBS Letters · doi:10.1002/1873-3468.14134 · Cited by 38
Depletion of TM6SF2 disturbs membrane lipid composition and dynamics in HuH7 hepatoma cells
Ruhanen, H., Nidhina Haridas, P. A., Eskelinen, E.-L., Eriksson, O., Olkkonen, V. M., & Käkelä, R. (2017) · Biochimica et Biophysica Acta (BBA) - Molecular and Cell Biology of Lipids · doi:10.1016/j.bbalip.2017.04.004 · Cited by 37
Gil‐de‐Gómez, L., Astudillo, A. M., Lebrero, P., Balboa, M. A., & Balsinde, J. (2017) · Frontiers in Immunology · doi:10.3389/fimmu.2017.01251 · Cited by 36
Ichu, T.-A., Reed, A., Ogasawara, D., Ulanovskaya, O. A., Roberts, A. J., Aguirre, C., Bar‐Peled, L., Gao, J., Germain, J., Barbas, S., et al. (2020) · Biochemistry · doi:10.1021/acs.biochem.0c00292 · Cited by 34
Chen, S., Wu, Q., Zhu, L., Zong, G., Li, H., Zheng, H., Zeng, R., Lin, X., & Sun, L. D. (2021) · American Journal of Clinical Nutrition · doi:10.1093/ajcn/nqab050 · Cited by 35
Obesity-Associated Neuropathy: Recent Preclinical Studies and Proposed Mechanisms
Bonomo, R. R., Krämer, S., & Mansuy‐Aubert, V. (2022) · Antioxidants and Redox Signaling · doi:10.1089/ars.2021.0278 · Cited by 37
Kalsbeek, A., Veenstra, J., Westra, J., Disselkoen, C., Koch, K., McKenzie, K. A., O’Bott, J., Woude, J. V., Fischer, K., Shearer, G. C., et al. (2018) · PLoS ONE · doi:10.1371/journal.pone.0194882 · Cited by 33
Valentine, W. J., Hashidate‐Yoshida, T., Yamamoto, S., & Shindou, H. (2020) · Advances in experimental medicine and biology · doi:10.1007/978-3-030-50621-6_2 · Cited by 32
Self-citationA guide to ferroptosis in cancer
Yapici, F. I., Bebber, C. M., & von Karstedt, S. (2024) · Molecular Oncology · doi:10.1002/1878-0261.13649 · Cited by 35
Lipid Acyl Chain Remodeling in Yeast
Renne, M. F., Bao, X., Smet, C. H. D., & de Kroon, A. I. P. M. (2015) · Lipid Insights · doi:10.4137/lpi.s31780 · Cited by 31
Mechanisms of intestinal triacylglycerol synthesis
Stone, S. J. (2022) · Biochimica et Biophysica Acta (BBA) - Molecular and Cell Biology of Lipids · doi:10.1016/j.bbalip.2022.159151 · Cited by 32
The Differential Metabolomes in Cumulus and Mural Granulosa Cells from Human Preovulatory Follicles
Gao, E.-M., Turathum, B., Wang, L., Zhang, D., Liu, Y., Tang, R., & Chian, R.-C. (2021) · Reproductive Sciences · doi:10.1007/s43032-021-00691-3 · Cited by 30
Metabolic routing maintains the unique fatty acid composition of phosphoinositides
Kim, Y. J., Sengupta, N., Sohn, M., Mandal, A., Pemberton, J. G., Choi, U., & Balla, T. (2022) · EMBO Reports · doi:10.15252/embr.202154532 · Cited by 30
Witt, A., Mateska, I., Palladini, A., Sinha, A. N., Wölk, M., Harauma, A., Bechmann, N., Pamporaki, C., Dahl, A., Rothe, M., et al. (2023) · Science Advances · doi:10.1126/sciadv.adf6710 · Cited by 31
Remodeling glycerophospholipids affects obesity-related insulin signaling in skeletal muscle
Wolfgang, M. J. (2021) · Journal of Clinical Investigation · doi:10.1172/jci148176 · Cited by 30
Detection of genome-edited mutant clones by a simple competition-based PCR method
原山, 武., & Riezman, H. (2017) · PLoS ONE · doi:10.1371/journal.pone.0179165 · Cited by 28
Metadata
- Authors
- Hashidate-Yoshida, T., Harayama, T., Hishikawa, D., Morimoto, R., Hamano, F., Tokuoka, S. M., Eto, M., Tamura-Nakano, M., Yanobu-Takanashi, R., Mukumoto, Y., Kiyonari, H., Okamura, T., Kita, Y., Shindou, H., & Shimizu, T.
- Affiliations
- Department of Lipid Signaling, National Center for Global Health and Medicine, Tokyo, Japan
- National Center for Global Health and Medicine (JP)
- The University of Tokyo (JP)
- Communal Laboratory, National Center for Global Health and Medicine, Tokyo, Japan
- Department of Laboratory Animal Medicine, National Center for Global Health and Medicine, Tokyo, Japan
- Laboratory for Animal Resources and Genetic Engineering, RIKEN Center for Developmental Biology, Kobe, Japan
- Japan Science and Technology Agency (JP)
- Corresponding author
- Shimizu, Takao
- ORCID
- Venue
- eLife
- Publisher
- eLife Sciences Publications, Ltd
- Published
- 2015-04-21
- Volume
- 4
- ISSN
- 2050-084X (ISSN-L)
- PMC
- PMC4436788
- OpenAlex
- W1976336399
- Cited by
- 270
- References
- 64
- Citations by year
- 2026: 31 · 2025: 32 · 2024: 40 · 2023: 26 · 2022: 31 · 2021: 26 · 2020: 17 · 2019: 17 · 2018: 21 · 2017: 13 · 2016: 12 · 2015: 4
- FWCI
- 8.30
- Type
- journal article
- Language
- en
- Open access
- gold
- doi.org
- Licence
- Locations
- eLife (publishedVersion, cc-by)
- PubMed Central (publishedVersion, cc-by)
- PubMed (publishedVersion)
- DiVA at Umeå University (Umeå University) (submittedVersion, other-oa)
- DOAJ (DOAJ: Directory of Open Access Journals) (submittedVersion, cc-by-sa)
- Funders
- Japan Society for the Promotion of Science (JSPS) (24229003, 26460380, 26860202, 26870879)
- Takeda Science Foundation (Special Research grant 2013)
- National Center for Global Health and Medicine (24-001,25-201, 26A105)
- Japan Science and Technology Agency (JST) (CREST)
- Topics
- Life Sciences › Biochemistry, Genetics and Molecular Biology › Biochemistry › Lipid metabolism and biosynthesis
- Life Sciences › Biochemistry, Genetics and Molecular Biology › Molecular Biology › Lipid Membrane Structure and Behavior
- Health Sciences › Nursing › Nutrition and Dietetics › Fatty Acid Research and Health
- Keywords
- LPCAT3, lysophosphatidylcholine acyltransferase, arachidonic acid, phospholipid membranes, polyunsaturated fatty acids, enterocytes, neonatal lethality, lipoprotein assembly, membrane lipid remodeling, hepatic lipoprotein secretion
- MeSH terms
- Animals, Cell Membrane, Fatty Acids, Fatty Acids, Unsaturated, Liver, 1-Acylglycerophosphocholine O-Acyltransferase, Phospholipids, Triglycerides, Arachidonic Acid, Cell Culture Techniques, Enterocytes, Mice
About these checks
Registry, retraction, Cites and statistics results are computed, not judged, with one exception: a printed reference that no index lists is read once by a model before it counts as a citation error. Claims are extracted by a model and kept only when their quote appears verbatim in the text; each cited source is then checked, with a model’s help, for whether it says what the claim relies on. Those verdicts can be wrong — read the claim’s quote and the cited source before relying on one.
Statistics and arithmetic are recomputed, not judged.
Confidence bands are shown only for fields calibrated on our annotated test set. None is calibrated yet, so no band is shown.
What counts as a claim ›How we measure confidence ›How we check this ›
Are you an author, or do you see a problem with this page? Request a review
