Cited by 223Protein Structure and DynamicsEnzyme Structure and FunctionRNA and protein synthesis mechanisms

The DOI matches its Crossref record; 79 of the 80 references it cites were found in a registry or an index.

Large-scale determination of previously unsolved protein structures using evolutionary information

Open access

Abstract

The prediction of the structures of proteins without detectable sequence similarity to any protein of known structure remains an outstanding scientific challenge. Here we report significant progress in this area. We first describe de novo blind structure predictions of unprecendented accuracy we made for two proteins in large families in the recent CASP11 blind test of protein structure prediction methods by incorporating residue-residue co-evolution information in the Rosetta structure prediction program. We then describe the use of this method to generate structure models for 58 of the 121 large protein families in prokaryotes for which three-dimensional structures are not available. These models, which are posted online for public access, provide structural information for the over 400,000 proteins belonging to the 58 families and suggest hypotheses about mechanism for the subset for which the function is known, and hypotheses about function for the remainder.

Overview

The claims and statistics of this paper haven’t been checked yet.

Run the check — free, no account needed. It reads the open-access text and checks the sources it cites.

A few free checks a day · papers already verified open instantly · results are public

Integrity signals

Registry

Crossref · 10.7554/elife.09248

Cites

79 of 79 references verified0 citation errors · 0 not checkable

Statistics

Figures

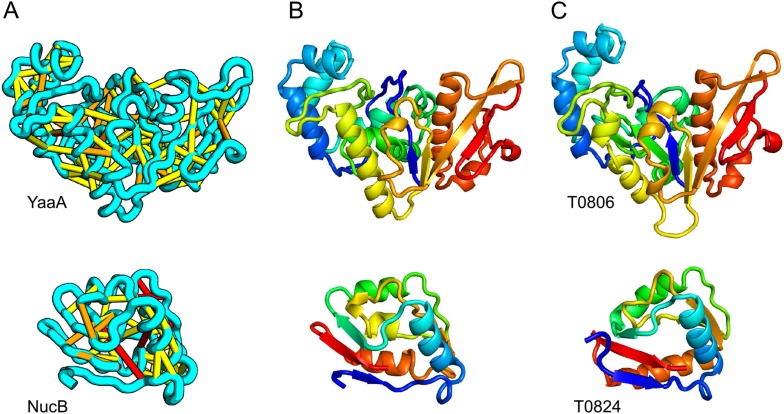
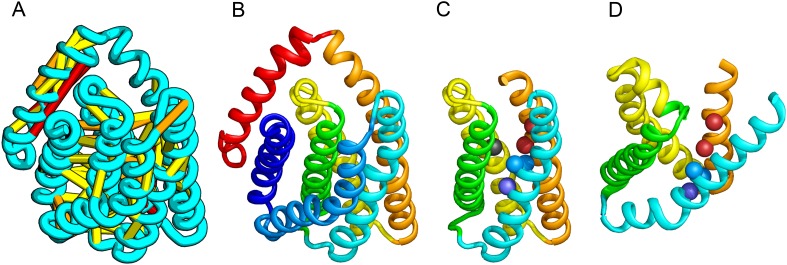
Figure 1. Accurate blind structure prediction of CASP11 targets T0806 and T0824. (A) Location of the most strongly co-evolving residue pairs. Lines connect residue pairs with normalized coupling strength greater than 1.0; yellow, distance less than 5 Å; orange, distance less than 10 Å and red, greater than 10 Å in the models. (B) CASP11 submitted models, colored from N to C terminus (blue to red). (C) X-ray crystal structures. For T0806, the Cα RMSD over the full-length protein is 3.6 Å and 2.9 Å over 223 aligned residues. For T0824; the Cα RMSD over the full-length protein is 4.2 Å and 2.7 Å over 77 aligned residues. For statistics on all five models submitted during CASP, see Figure 1—source data 1. DOI: http://dx.doi.org/10.7554/eLife.09248.003
Figure 1. Accurate blind structure prediction of CASP11 targets T0806 and T0824. (A) Location of the most strongly co-evolving residue pairs. Lines connect residue pairs with normalized coupling strength greater than 1.0; yellow, distance less than 5 Å; orange, distance less than 10 Å and red, greater than 10 Å in the models. (B) CASP11 submitted models, colored from N to C terminus (blue to red). (C) X-ray crystal structures. For T0806, the Cα RMSD over the full-length protein is 3.6 Å and 2.9 Å over 223 aligned residues. For T0824; the Cα RMSD over the full-length protein is 4.2 Å and 2.7 Å over 77 aligned residues. For statistics on all five models submitted during CASP, see Figure 1—source data 1. DOI: http://dx.doi.org/10.7554/eLife.09248.003CC BY · PubMed Central
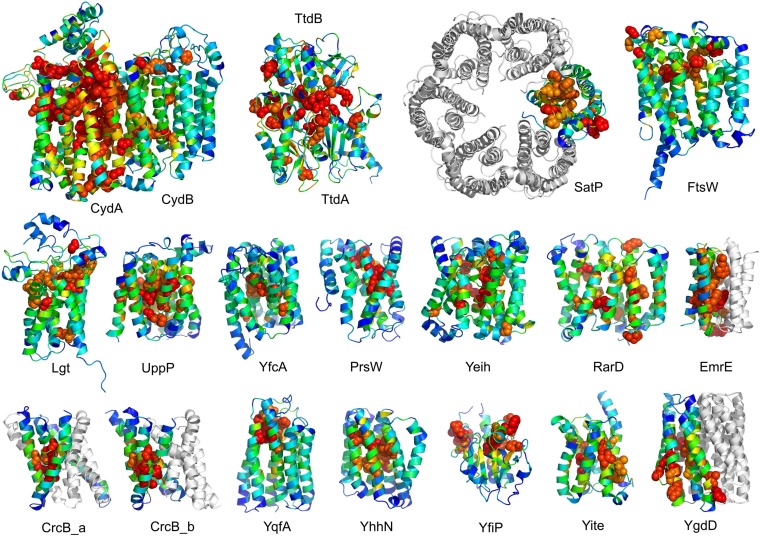
Figure 2. Conserved residues tend to cluster in the predicted structures. Residue conservations from multiple sequence alignments were mapped to predicted structures using Al2Co (Pei and Grishin, 2001) and are colored in rainbow from blue (variable) to red (conserved). The most conserved residues (red or orange), displayed as spheres to highlight their positions, tend to line interaction surfaces and indicate potential functional sites. DOI: http://dx.doi.org/10.7554/eLife.09248.008
Figure 2. Conserved residues tend to cluster in the predicted structures. Residue conservations from multiple sequence alignments were mapped to predicted structures using Al2Co (Pei and Grishin, 2001) and are colored in rainbow from blue (variable) to red (conserved). The most conserved residues (red or orange), displayed as spheres to highlight their positions, tend to line interaction surfaces and indicate potential functional sites. DOI: http://dx.doi.org/10.7554/eLife.09248.008CC BY · PubMed Central
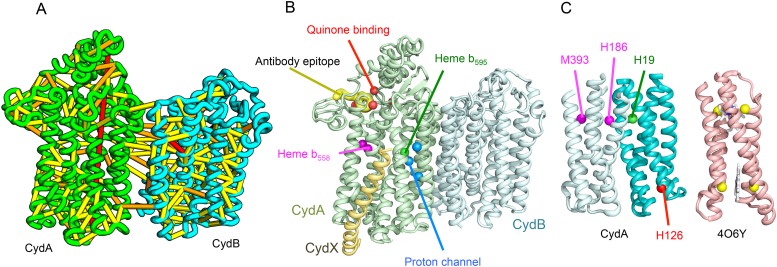
Figure 3. Predicted structure of the Cytochrome bd oxidase complex. (A) Location of the top co-evolving residue pairs in our model. For clarity, the monomers have been pulled apart slightly. (B) Location of conserved and experimentally characterized residues (Borisov et al., 2011) on structure model. (C) Residues that coordinate heme in CydA are in the same location as histidines (yellow spheres) in Cytochrome b561 (PDB: 4O6Y). H126 (red sphere) overlaps one of these histidines and is the proposed as a heme d coordination site. For clarity, both the model of CydA and the structure of Cyt b562 (4O6Y) are trimmed to highlight the four helix bundle(s). DOI: http://dx.doi.org/10.7554/eLife.09248.009
Figure 3. Predicted structure of the Cytochrome bd oxidase complex. (A) Location of the top co-evolving residue pairs in our model. For clarity, the monomers have been pulled apart slightly. (B) Location of conserved and experimentally characterized residues (Borisov et al., 2011) on structure model. (C) Residues that coordinate heme in CydA are in the same location as histidines (yellow spheres) in Cytochrome b561 (PDB: 4O6Y). H126 (red sphere) overlaps one of these histidines and is the proposed as a heme d coordination site. For clarity, both the model of CydA and the structure of Cyt b562 (4O6Y) are trimmed to highlight the four helix bundle(s). DOI: http://dx.doi.org/10.7554/eLife.09248.009CC BY · PubMed Central
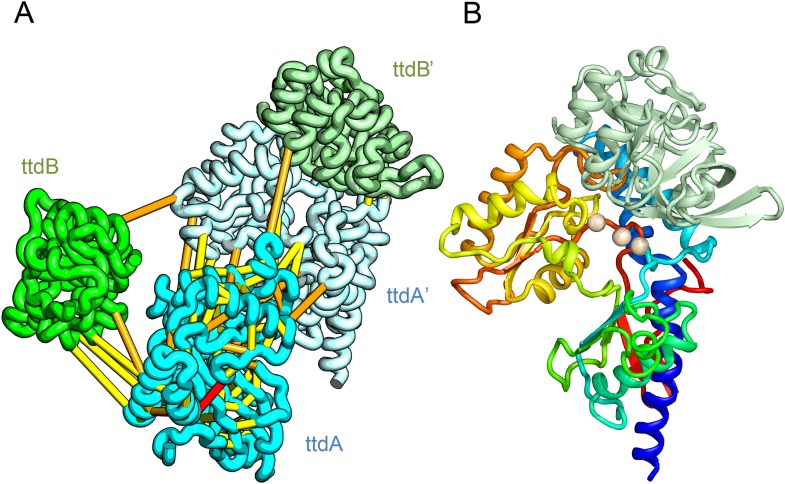
Figure 4. Predicted structure of the tartrate dehydratase heterotetramer composed of two copies each of ttdA and ttdB. (A) Co-evolving residue pairs. The monomers have been pulled apart to reveal the contacts. (B) The ttdA subunit (rainbow) contains a 4Fe-4S cluster (white spheres) that is near the interface with ttdB (green). DOI: http://dx.doi.org/10.7554/eLife.09248.010
Figure 4. Predicted structure of the tartrate dehydratase heterotetramer composed of two copies each of ttdA and ttdB. (A) Co-evolving residue pairs. The monomers have been pulled apart to reveal the contacts. (B) The ttdA subunit (rainbow) contains a 4Fe-4S cluster (white spheres) that is near the interface with ttdB (green). DOI: http://dx.doi.org/10.7554/eLife.09248.010CC BY · PubMed Central
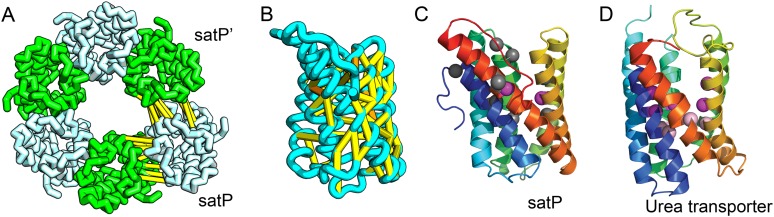
Figure 5. Succinate-acetate/proton symporter SatP (YaaH). (A) Co-evolving residue pairs in homo-oligomer model. (B) Co-evolving residue pairs in SatP monomer model. (C) SatP co-evolution-based model places known acetate selective residues (magenta spheres) lining the channel. Conserved residues (gray spheres) line the periplasmic surface. The 6TMH channels are formed by threefold pseudo-symmetric TMH hairpins. (D) Proton-gated UreI channel protomer. C-alpha positions at the periplasmic constriction site (magenta spheres) and the cytoplasmic constriction site (pink spheres) are highlighted. The SatP model has the same fold as UreI (C vs D). DOI: http://dx.doi.org/10.7554/eLife.09248.011
Figure 5. Succinate-acetate/proton symporter SatP (YaaH). (A) Co-evolving residue pairs in homo-oligomer model. (B) Co-evolving residue pairs in SatP monomer model. (C) SatP co-evolution-based model places known acetate selective residues (magenta spheres) lining the channel. Conserved residues (gray spheres) line the periplasmic surface. The 6TMH channels are formed by threefold pseudo-symmetric TMH hairpins. (D) Proton-gated UreI channel protomer. C-alpha positions at the periplasmic constriction site (magenta spheres) and the cytoplasmic constriction site (pink spheres) are highlighted. The SatP model has the same fold as UreI (C vs D). DOI: http://dx.doi.org/10.7554/eLife.09248.011CC BY · PubMed Central
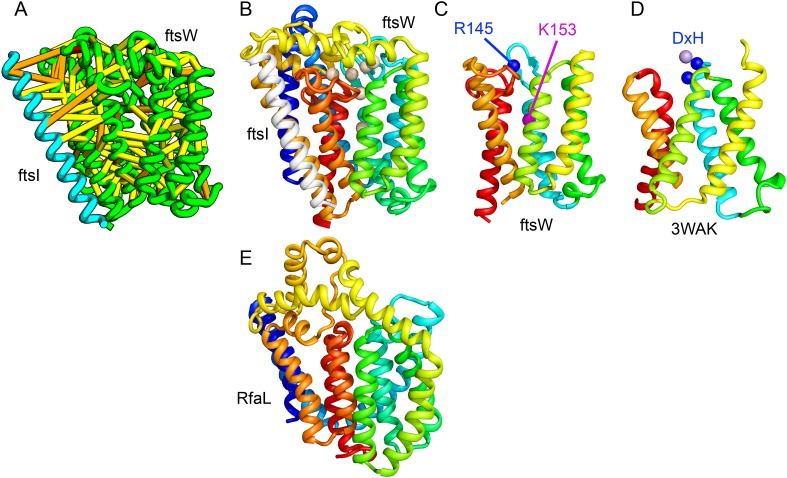
Figure 6. Lipid II flippase (FtsW) in complex with the transmembrane domain of Peptidoglycan synthase (FtsI). FtsW is an essential cell division protein that transports lipids across the cytoplasmic membrane and is required for localization of FtsI. (A) Location of the top co-evolving residue pairs. (B) White spheres indicate conserved positions in FtsW that when mutated to alanine result in loss of flippase activity. (C, D) The last seven transmembrane (TM) helices of FtsW (TMH4-TMH10) adopting a similar topology as TMH4-TMH7 and TMH10-12 of the TM domain of STT3 (PDB: 3WAK). Both the model of FtsW and 3WAK was trimmed over the aligned helices for clarity. (C) Two residues from the corresponding TMH4 of FtsW (R145 and K153) are essential for flippase activity. (D) The side chain of R145 overlaps the residues that coordinate the divalent metal in the conserved DxH motif at the N-terminus of STT3 TMH4. (E) The model of RfaL adopts a similar fold as ftsW. DOI: http://dx.doi.org/10.7554/eLife.09248.012
Figure 6. Lipid II flippase (FtsW) in complex with the transmembrane domain of Peptidoglycan synthase (FtsI). FtsW is an essential cell division protein that transports lipids across the cytoplasmic membrane and is required for localization of FtsI. (A) Location of the top co-evolving residue pairs. (B) White spheres indicate conserved positions in FtsW that when mutated to alanine result in loss of flippase activity. (C, D) The last seven transmembrane (TM) helices of FtsW (TMH4-TMH10) adopting a similar topology as TMH4-TMH7 and TMH10-12 of the TM domain of STT3 (PDB: 3WAK). Both the model of FtsW and 3WAK was trimmed over the aligned helices for clarity. (C) Two residues from the corresponding TMH4 of FtsW (R145 and K153) are essential for flippase activity. (D) The side chain of R145 overlaps the residues that coordinate the divalent metal in the conserved DxH motif at the N-terminus of STT3 TMH4. (E) The model of RfaL adopts a similar fold as ftsW. DOI: http://dx.doi.org/10.7554/eLife.09248.012CC BY · PubMed Central
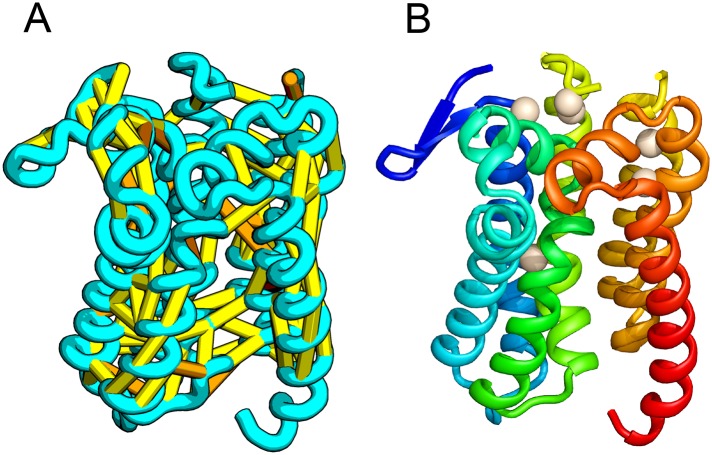
Figure 7. Prolipoprotein diacylglyceryl transferase (LGT). (A) Predicted contacts indicated on model, (B) model with conserved positions at which alanine mutations result in loss in activity indicated in white spheres; five of these are clustered at the periplasmic end of the model. DOI: http://dx.doi.org/10.7554/eLife.09248.013
Figure 7. Prolipoprotein diacylglyceryl transferase (LGT). (A) Predicted contacts indicated on model, (B) model with conserved positions at which alanine mutations result in loss in activity indicated in white spheres; five of these are clustered at the periplasmic end of the model. DOI: http://dx.doi.org/10.7554/eLife.09248.013CC BY · PubMed Central
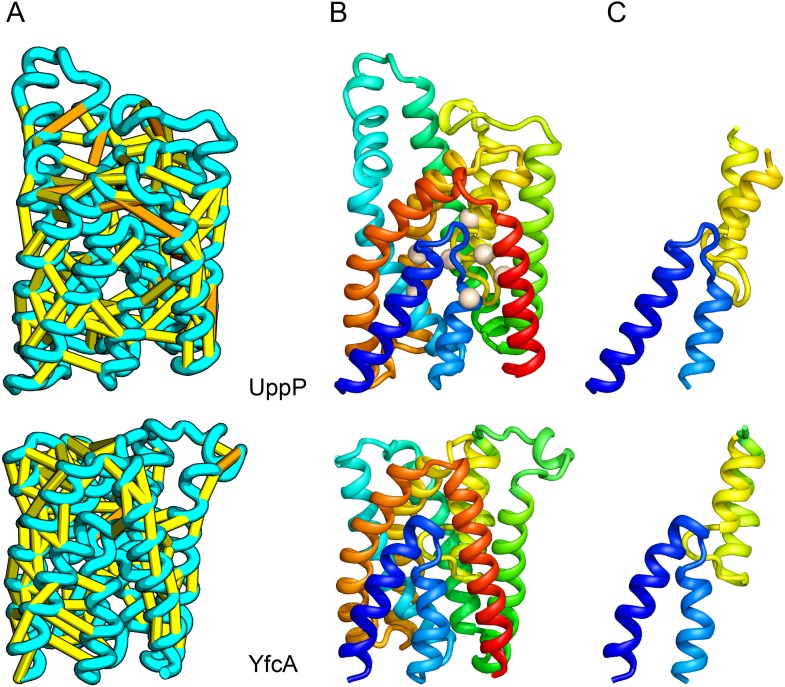
Figure 8. UppP catalyzes the dephosphorylation of undecaprenyl diphophate (UPP). (A) Location of the top co-evolving residue pairs. (B) Spheres in white indicate conserved residues experimentally shown to decrease activity to <1% (Chang et al., 2014); all these residues are in the core in the model. YfcA, a protein of unknown function is a very distant sequence homologue of UppP (they are in different PFAM families); (C) the predicted structure of YfcA has the same fold as UppP with prominent broken helices (highlighted in blue and yellow). DOI: http://dx.doi.org/10.7554/eLife.09248.014
Figure 8. UppP catalyzes the dephosphorylation of undecaprenyl diphophate (UPP). (A) Location of the top co-evolving residue pairs. (B) Spheres in white indicate conserved residues experimentally shown to decrease activity to <1% (Chang et al., 2014); all these residues are in the core in the model. YfcA, a protein of unknown function is a very distant sequence homologue of UppP (they are in different PFAM families); (C) the predicted structure of YfcA has the same fold as UppP with prominent broken helices (highlighted in blue and yellow). DOI: http://dx.doi.org/10.7554/eLife.09248.014CC BY · PubMed Central
Figure 9. PrsW is an intramembrane protease that is crucial in the resistance to antimicrobial peptides. (A) Location of the top co-evolving residue pairs. Our model of PrsW (B) contains a 4TMH substructure ([TMHs 3–6], (C) which is very similar to a substructure of type II CAAX prenyl protease [TMHs 4–7; D]). The predicted active site residues in PrsW motifs EExxK (TMH3; blue spheres, C) and HxxxD (TMH6; red spheres, C) are in positions similar to those of conserved residues in motifs EExxxR (TMH4; blue spheres, D) and HxxxN (TMH7; red spheres, D) of type II CAAX prenyl protease. Another conserved histidine in the fifth TMH of PrsW (but absent in type II CAAX prenyl protease) is also located in the predicted active site of PrsW (black sphere). DOI: http://dx.doi.org/10.7554/eLife.09248.015
Figure 9. PrsW is an intramembrane protease that is crucial in the resistance to antimicrobial peptides. (A) Location of the top co-evolving residue pairs. Our model of PrsW (B) contains a 4TMH substructure ([TMHs 3–6], (C) which is very similar to a substructure of type II CAAX prenyl protease [TMHs 4–7; D]). The predicted active site residues in PrsW motifs EExxK (TMH3; blue spheres, C) and HxxxD (TMH6; red spheres, C) are in positions similar to those of conserved residues in motifs EExxxR (TMH4; blue spheres, D) and HxxxN (TMH7; red spheres, D) of type II CAAX prenyl protease. Another conserved histidine in the fifth TMH of PrsW (but absent in type II CAAX prenyl protease) is also located in the predicted active site of PrsW (black sphere). DOI: http://dx.doi.org/10.7554/eLife.09248.015CC BY · PubMed Central
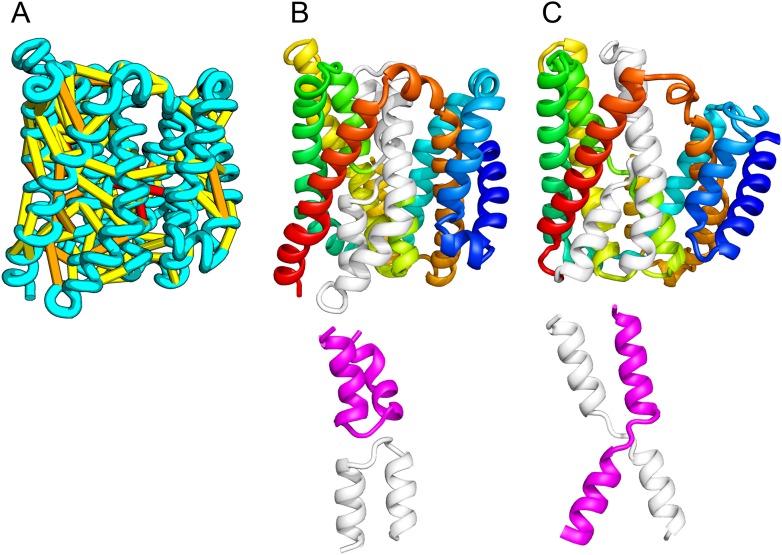
Figure 10. Our model of the inner membrane protein YeiH (A, B) is structurally similar to the structure of the antiporter NapA (C). Lower panels: TM helices of core domains are highlighted in white and magenta: while these helices cross over each other in NapA (right), the core of our model of YeiH (left) is formed by two pairs of broken helices (TM5, 6 and TM8, 9) that exit the membrane on the same side. DOI: http://dx.doi.org/10.7554/eLife.09248.016
Figure 10. Our model of the inner membrane protein YeiH (A, B) is structurally similar to the structure of the antiporter NapA (C). Lower panels: TM helices of core domains are highlighted in white and magenta: while these helices cross over each other in NapA (right), the core of our model of YeiH (left) is formed by two pairs of broken helices (TM5, 6 and TM8, 9) that exit the membrane on the same side. DOI: http://dx.doi.org/10.7554/eLife.09248.016CC BY · PubMed Central
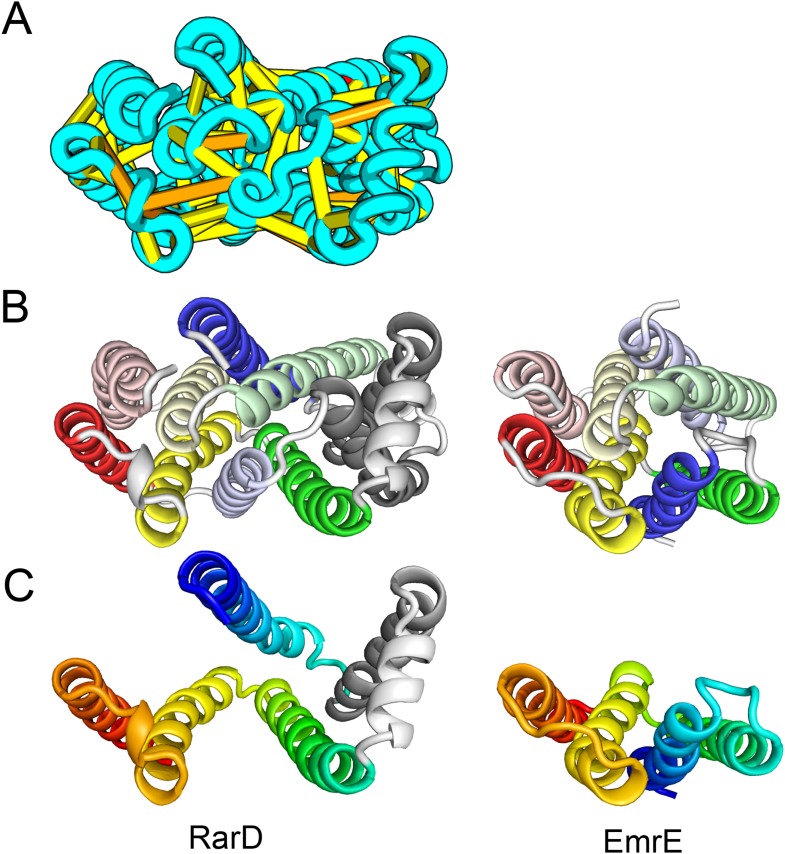
Figure 11. Our model of RarD has a similar architecture to EmrE but different fold. (A, B) Full-length RarD and EmrE homodimer. (C) RarD internal repeat and EmrE monomer. The N-terminus helix (blue) is swapped in RarD relative to EmrE due to helix insertion (gray). DOI: http://dx.doi.org/10.7554/eLife.09248.017
Figure 11. Our model of RarD has a similar architecture to EmrE but different fold. (A, B) Full-length RarD and EmrE homodimer. (C) RarD internal repeat and EmrE monomer. The N-terminus helix (blue) is swapped in RarD relative to EmrE due to helix insertion (gray). DOI: http://dx.doi.org/10.7554/eLife.09248.017CC BY · PubMed Central
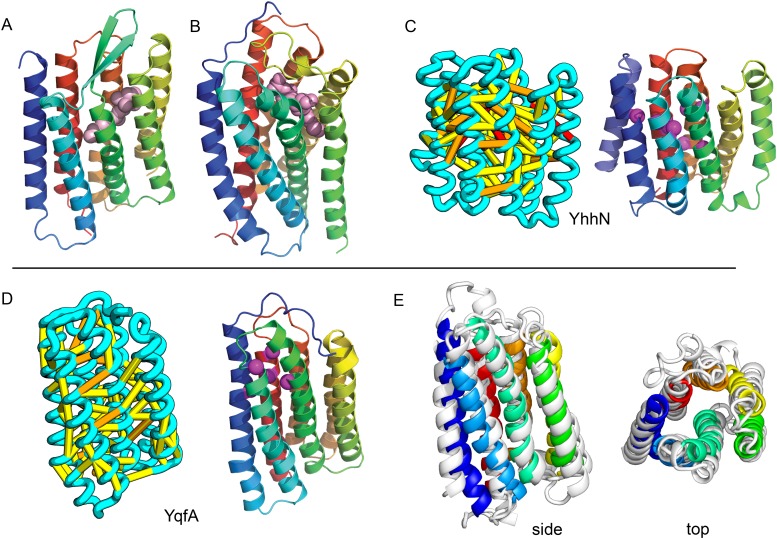
Figure 12. Predicted structures of YqfA and YhhN have topologies similar to G protein-coupled receptors (GPCR-like). The core seven TM helix (TMH) fold exhibited by members of the GPCR superfamily is colored in rainbow from the N- to the C-terminus. (A) Bacteriorhodopsin binds retinal (pink spheres) in a pocket formed by TMH3-7 [PDB ID: 1m0k]. (B) The agonist (pink spheres) binding site of P2Y12 receptor is formed by the same set of helices [PDB ID: 4pxz]. (C) A co-evolution-based structure model for YhhN has the GPCR topology with an N-terminal TMH extension. Conserved residues that might form an active site (magenta spheres) cluster in a similar place as the YqfA catalytic residues. (D) Our co-evolution-based structure model for YqfA has a GPCR like topology and clusters residues that may form an active site (magenta spheres mark the Calpha position) in a region that corresponds to the GPCR ligand-binding pocket. (E) Side and top view of the TMalign superposition of YqfA model (in rainbow) over the recently released 3wxw (in white) human ortholog. The N- and C-terminal loops were trimmed for clarity. The TMalign score between the model and the homolog is 0.8. DOI: http://dx.doi.org/10.7554/eLife.09248.018
Figure 12. Predicted structures of YqfA and YhhN have topologies similar to G protein-coupled receptors (GPCR-like). The core seven TM helix (TMH) fold exhibited by members of the GPCR superfamily is colored in rainbow from the N- to the C-terminus. (A) Bacteriorhodopsin binds retinal (pink spheres) in a pocket formed by TMH3-7 [PDB ID: 1m0k]. (B) The agonist (pink spheres) binding site of P2Y12 receptor is formed by the same set of helices [PDB ID: 4pxz]. (C) A co-evolution-based structure model for YhhN has the GPCR topology with an N-terminal TMH extension. Conserved residues that might form an active site (magenta spheres) cluster in a similar place as the YqfA catalytic residues. (D) Our co-evolution-based structure model for YqfA has a GPCR like topology and clusters residues that may form an active site (magenta spheres mark the Calpha position) in a region that corresponds to the GPCR ligand-binding pocket. (E) Side and top view of the TMalign superposition of YqfA model (in rainbow) over the recently released 3wxw (in white) human ortholog. The N- and C-terminal loops were trimmed for clarity. The TMalign score between the model and the homolog is 0.8. DOI: http://dx.doi.org/10.7554/eLife.09248.018CC BY · PubMed Central
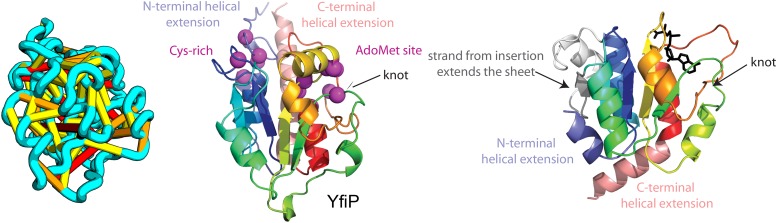
Figure 13. YfiP predicted structure has methyltransferase-like fold with knot. Left: the top co-evolving residues pairs. Middle: conserved residues (magenta) surround the AdoMet-binding site and a conserved Cys could bind a Fe4S cluster. Right: 3nk7 methyltransferase bound to AdoMet. DOI: http://dx.doi.org/10.7554/eLife.09248.019
Figure 13. YfiP predicted structure has methyltransferase-like fold with knot. Left: the top co-evolving residues pairs. Middle: conserved residues (magenta) surround the AdoMet-binding site and a conserved Cys could bind a Fe4S cluster. Right: 3nk7 methyltransferase bound to AdoMet. DOI: http://dx.doi.org/10.7554/eLife.09248.019CC BY · PubMed Central
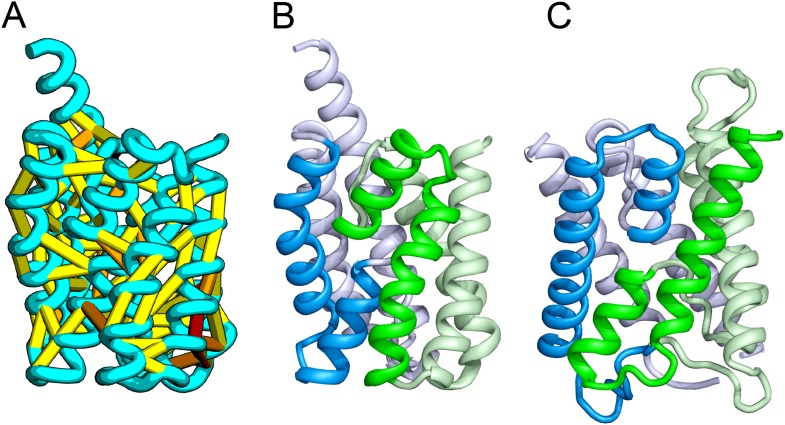
Figure 14. Bacillus subtilis YitE model. (A) The top co-evolving residues. YitE (B) has architecture similar to aquaporin (PDB:2B6P) (C), including the internal pseudo-symmetry (blue vs green), but completely different connectivity. DOI: http://dx.doi.org/10.7554/eLife.09248.020
Figure 14. Bacillus subtilis YitE model. (A) The top co-evolving residues. YitE (B) has architecture similar to aquaporin (PDB:2B6P) (C), including the internal pseudo-symmetry (blue vs green), but completely different connectivity. DOI: http://dx.doi.org/10.7554/eLife.09248.020CC BY · PubMed Central
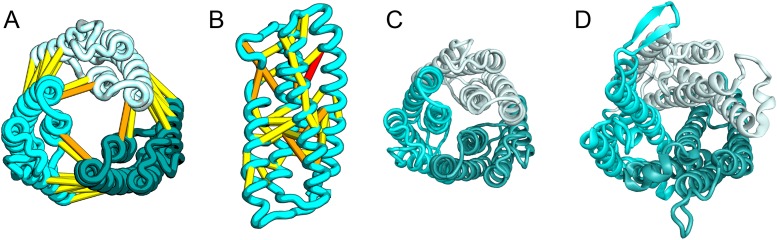
Figure 15. Escherichia coli protein YgdD. Our model of the E. coli protein YgdD trimer (C) is based on predicted contacts satisfied within the monomer (B) and between monomers in the homo-trimer (A). Structural similarity to heme copper oxidase (D) along with a weak HHpred sequence match over part of the protein suggests that YgdD is evolutionarily related to heme–copper oxidases. DOI: http://dx.doi.org/10.7554/eLife.09248.021
Figure 15. Escherichia coli protein YgdD. Our model of the E. coli protein YgdD trimer (C) is based on predicted contacts satisfied within the monomer (B) and between monomers in the homo-trimer (A). Structural similarity to heme copper oxidase (D) along with a weak HHpred sequence match over part of the protein suggests that YgdD is evolutionarily related to heme–copper oxidases. DOI: http://dx.doi.org/10.7554/eLife.09248.021CC BY · PubMed Central
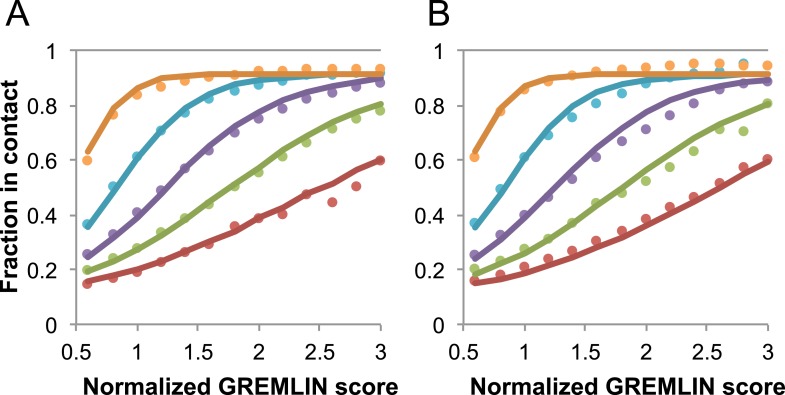
Figure 16. Dependence of the accuracy of predicted contacts on the normalized GREMLIN score (sco), the effective number of sequences (seq), the length (len), and the sequence separation (sep). Contacts are defined based on amino acid specific Cβ-Cβ distance cutoffs as described in SI Table 3 in Kamisetty et al. (2013). (A) Observed vs predicted accuracies over a large data set of proteins of known structure with deep alignments (Supplementary file 3), sub sampled to different extents (seq/√(len) = 4 (red), 8 (green), 15 (purple), 32 (cyan), and 96 (orange)). Circles represent observed contact prediction accuracies, solid lines, a fit to a sigmoid function of the normalized coupling value, the number of sequences, the length, and the sequence separation (see Figure 16—figure supplement 1 and Figure 16—figure supplement 2). (B) Observed vs predicted accuracies in an independent data set of variable length alignments for 7047 pdb chains (Supplementary file 3), using maximum number of sequences obtained with HHblits as opposed to subsampling a large alignment. Circles again represent observed contact prediction accuracies; solid lines, the predicted accuracy using the model obtained by fitting to the data in (A). The contact prediction accuracy is correctly modeled for the independent data set, justifying its use on the unknown cases described in this article. The Equation use to calculate P(contact|sco,seq,len,sep) is P(contact|sco,seq,len,sep)≈(0.89(1–P(contact|sep)))/(1+exp(−0.58(seq/(√len))^0.50(sco−5.46(seq/(√len))^(−0.53))))+P(contact|sep). DOI: http://dx.doi.org/10.7554/eLife.09248.022
Figure 16. Dependence of the accuracy of predicted contacts on the normalized GREMLIN score (sco), the effective number of sequences (seq), the length (len), and the sequence separation (sep). Contacts are defined based on amino acid specific Cβ-Cβ distance cutoffs as described in SI Table 3 in Kamisetty et al. (2013). (A) Observed vs predicted accuracies over a large data set of proteins of known structure with deep alignments (Supplementary file 3), sub sampled to different extents (seq/√(len) = 4 (red), 8 (green), 15 (purple), 32 (cyan), and 96 (orange)). Circles represent observed contact prediction accuracies, solid lines, a fit to a sigmoid function of the normalized coupling value, the number of sequences, the length, and the sequence separation (see Figure 16—figure supplement 1 and Figure 16—figure supplement 2). (B) Observed vs predicted accuracies in an independent data set of variable length alignments for 7047 pdb chains (Supplementary file 3), using maximum number of sequences obtained with HHblits as opposed to subsampling a large alignment. Circles again represent observed contact prediction accuracies; solid lines, the predicted accuracy using the model obtained by fitting to the data in (A). The contact prediction accuracy is correctly modeled for the independent data set, justifying its use on the unknown cases described in this article. The Equation use to calculate P(contact|sco,seq,len,sep) is P(contact|sco,seq,len,sep)≈(0.89(1–P(contact|sep)))/(1+exp(−0.58(seq/(√len))^0.50(sco−5.46(seq/(√len))^(−0.53))))+P(contact|sep). DOI: http://dx.doi.org/10.7554/eLife.09248.022CC BY · PubMed Central
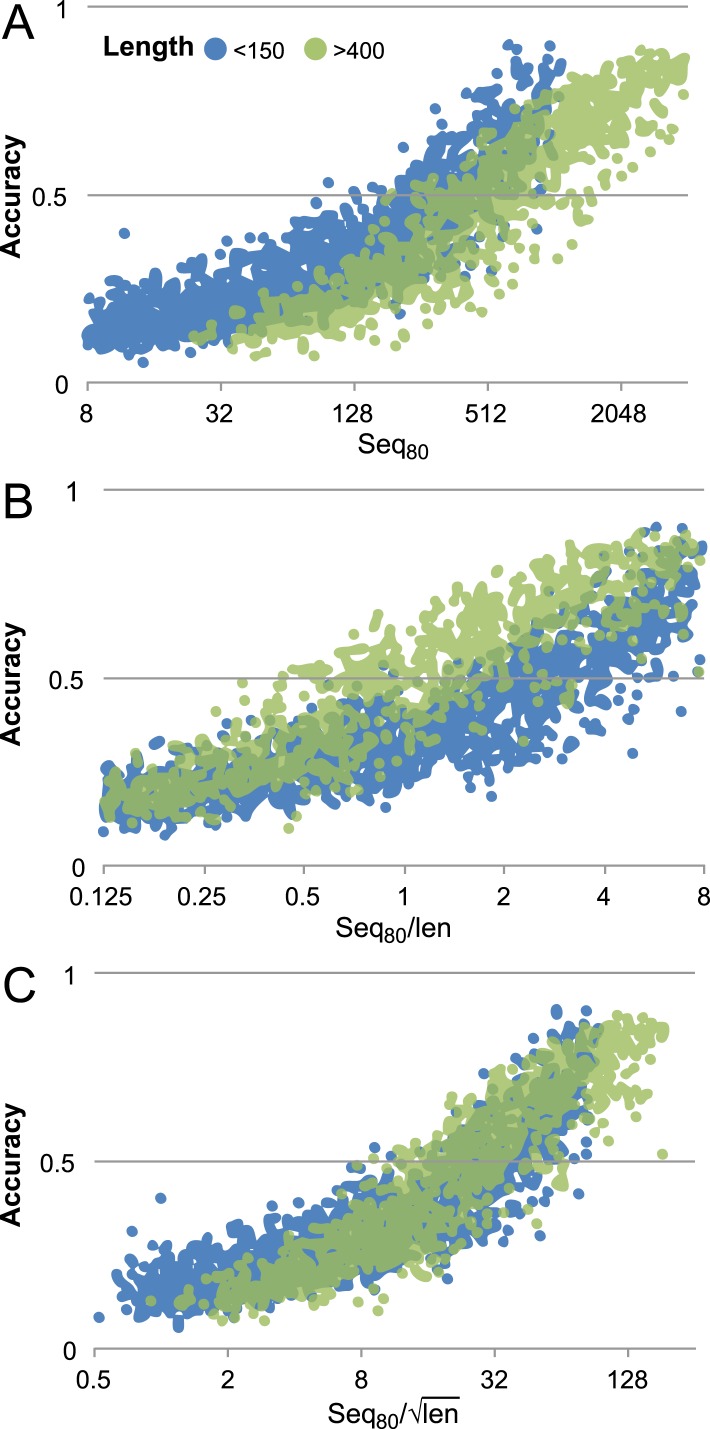
Figure 16—figure supplement 1. Contact prediction accuracy is better correlated with (#sequences/sqrt(length)) than with (#sequences/length). Accuracy is computed for the top 3L/2 GREMLIN predictions, with sequence separation ≥3, based on Cβ-Cβ amino acid specific distance as described in SI Table 3 in Kamisetty et al. (2013). The number of sequences after reducing the redundancy to 80% is shown. A set of 7047 pdb chains (see Supplemental file 3) was divided into two groups by length (less than 150 and greater than 400). (A) Larger proteins with similar number of sequence were less accurate then the smaller proteins. (B) #Sequences/length as often used does not accurately account for length dependence. There is a clear separation between the blue and green distributions. (C) #Sequences/√length better accounts for the length dependency. The blue and green distributions overlap. DOI: http://dx.doi.org/10.7554/eLife.09248.023
Figure 16—figure supplement 1. Contact prediction accuracy is better correlated with (#sequences/sqrt(length)) than with (#sequences/length). Accuracy is computed for the top 3L/2 GREMLIN predictions, with sequence separation ≥3, based on Cβ-Cβ amino acid specific distance as described in SI Table 3 in Kamisetty et al. (2013). The number of sequences after reducing the redundancy to 80% is shown. A set of 7047 pdb chains (see Supplemental file 3) was divided into two groups by length (less than 150 and greater than 400). (A) Larger proteins with similar number of sequence were less accurate then the smaller proteins. (B) #Sequences/length as often used does not accurately account for length dependence. There is a clear separation between the blue and green distributions. (C) #Sequences/√length better accounts for the length dependency. The blue and green distributions overlap. DOI: http://dx.doi.org/10.7554/eLife.09248.023CC BY · PubMed Central
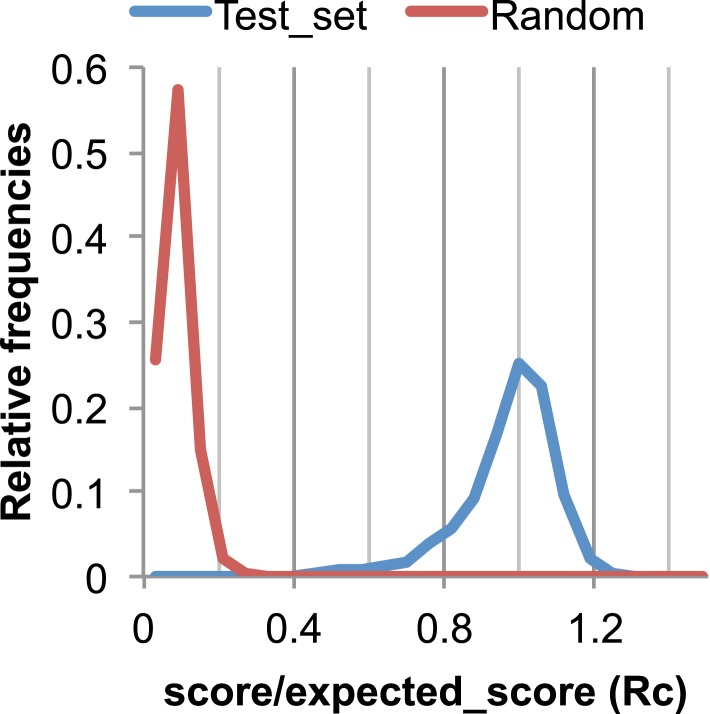
Figure 17. The Rc metric used to assess fit of predicted contacts to a model. The expected total GREMLIN score if the structure was native was estimated by summing sco*P(contact|sco, seq, len, sep) over all contacts with sep ≥6. To evaluate the fit of a particular model to a predicted contact set, we take the ratio of the actual total GREMLIN score of the model to the expected total score computed as above; we refer to this ratio of observed and expected contact scores as ‘Rc’. Blue line: the distribution of Rc in native structures with 4L–10L sequences; Red line: distribution of Rc after randomly reassigning contact predictions to structures. Rc values less than 0.7 are very infrequently observed for native structures; we use this value as a cutoff to evaluate the fit of a predicted contact set to a model. DOI: http://dx.doi.org/10.7554/eLife.09248.005
Figure 17. The Rc metric used to assess fit of predicted contacts to a model. The expected total GREMLIN score if the structure was native was estimated by summing sco*P(contact|sco, seq, len, sep) over all contacts with sep ≥6. To evaluate the fit of a particular model to a predicted contact set, we take the ratio of the actual total GREMLIN score of the model to the expected total score computed as above; we refer to this ratio of observed and expected contact scores as ‘Rc’. Blue line: the distribution of Rc in native structures with 4L–10L sequences; Red line: distribution of Rc after randomly reassigning contact predictions to structures. Rc values less than 0.7 are very infrequently observed for native structures; we use this value as a cutoff to evaluate the fit of a predicted contact set to a model. DOI: http://dx.doi.org/10.7554/eLife.09248.005CC BY · PubMed Central

Verification

Claims the paper makes

The claims and statistics of this paper haven’t been checked yet.

Run the check — free, no account needed. It reads the open-access text and checks the sources it cites.

A few free checks a day · papers already verified open instantly · results are public

Claims other papers make about this one

Each is checked against this paper’s own text: does it say what the citing paper says it does?

Self-check

Percentages, sums and reported differences re-computed from the paper’s own numbers.

The self-check needs the paper’s full text.

Citations

Cites

Show all 80 references

Research works printed but not linked: 1

  1. Hayat, 2014, Accurate prediction of transmembrane β-barrel proteins from sequences, 10.1101/006577 · DOI

Cited by

Sorted by citations

See all 223

Metadata

Authors
Ovchinnikov, S., Kinch, L., Park, H., Liao, Y., Pei, J., Kim, D. E., Kamisetty, H., Grishin, N. V., & Baker, D.
Affiliations
  • University of Washington (US)
  • Howard Hughes Medical Institute (US)
  • The University of Texas Southwestern Medical Center (US)
  • Meta (United States) (US)
Corresponding author
Baker, David
Venue
eLife
Published
2015-09-03
Volume
4
Pages
e09248-e09248
ISSN
2050-084X (ISSN-L)
OpenAlex
W1895528264
Cited by
222
References
80
Citations by year
2026: 3 · 2025: 4 · 2024: 2 · 2023: 12 · 2022: 17 · 2021: 20 · 2020: 25 · 2019: 42 · 2018: 30 · 2017: 39 · 2016: 24 · 2015: 4
FWCI
14.18
Type
journal article
Language
en
Open access
Locations
  • eLife (publishedVersion, cc-by)
  • Europe PMC (PubMed Central) (publishedVersion, cc-by)
  • PubMed Central (publishedVersion, cc-by)
  • PubMed (publishedVersion)
  • DOAJ (DOAJ: Directory of Open Access Journals) (submittedVersion, cc-by-sa)
Funders
  • National Institutes of Health (NIH) (R01GM092802, GM094575)
  • Welch Foundation (Robert A. Welch Foundation) (I-1505)
Topics
  • Life Sciences › Biochemistry, Genetics and Molecular Biology › Molecular Biology › Protein Structure and Dynamics
  • Life Sciences › Biochemistry, Genetics and Molecular Biology › Structural Biology › Enzyme Structure and Function
  • Life Sciences › Biochemistry, Genetics and Molecular Biology › Molecular Biology › RNA and protein synthesis mechanisms
Keywords
protein structure prediction, de novo structure prediction, Rosetta, prokaryotic proteins, structural model, protein function prediction, evolutionary information
MeSH terms
Bacterial Proteins, Models, Molecular, Protein Conformation, Evolution, Molecular, Computational Biology

About these checks

Registry, retraction, Cites and statistics results are computed, not judged, with one exception: a printed reference that no index lists is read once by a model before it counts as a citation error. Claims are extracted by a model and kept only when their quote appears verbatim in the text; each cited source is then checked, with a model’s help, for whether it says what the claim relies on. Those verdicts can be wrong — read the claim’s quote and the cited source before relying on one.

Statistics and arithmetic are recomputed, not judged.

Confidence bands are shown only for fields calibrated on our annotated test set. None is calibrated yet, so no band is shown.

What counts as a claim ›How we measure confidence ›How we check this ›

Are you an author, or do you see a problem with this page? Request a review