

The DOI matches its Crossref record; 40 of the 40 references it cites were found in a registry or an index.
Tetherin is an exosomal tether
Open accessAbstract
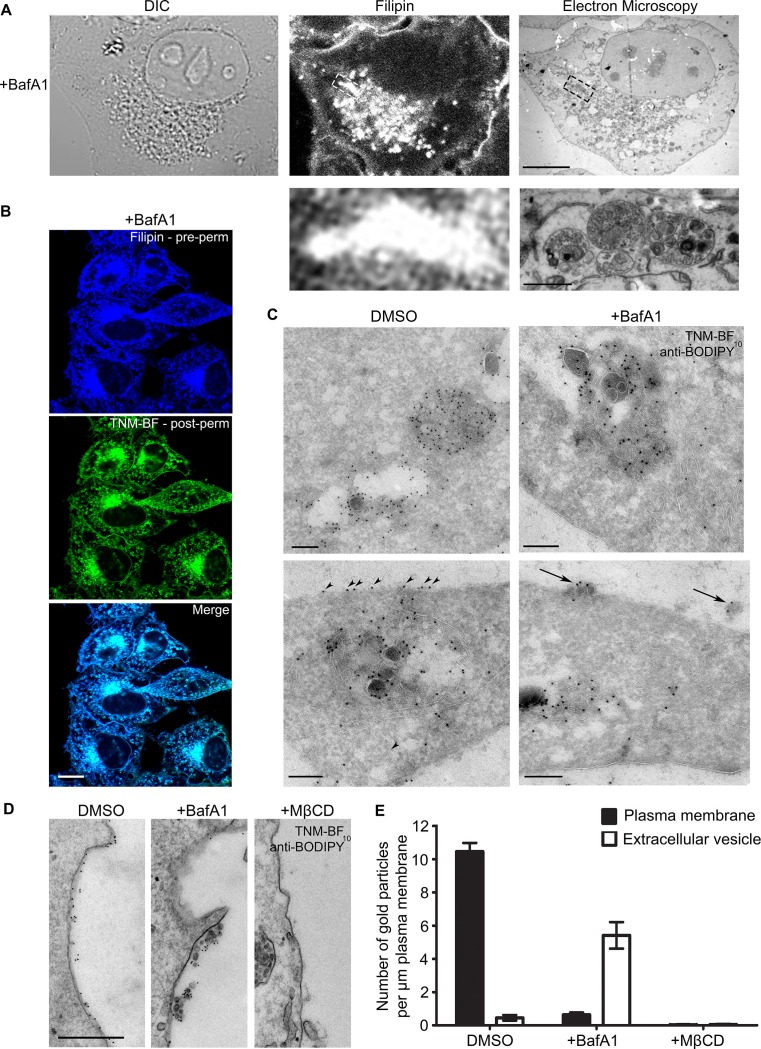
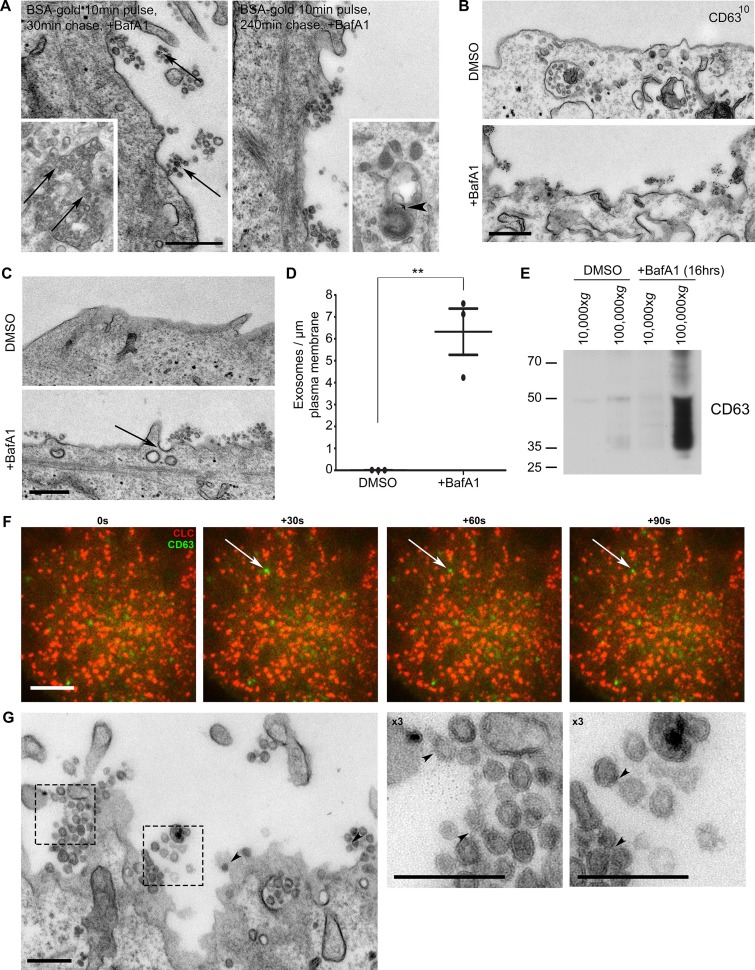
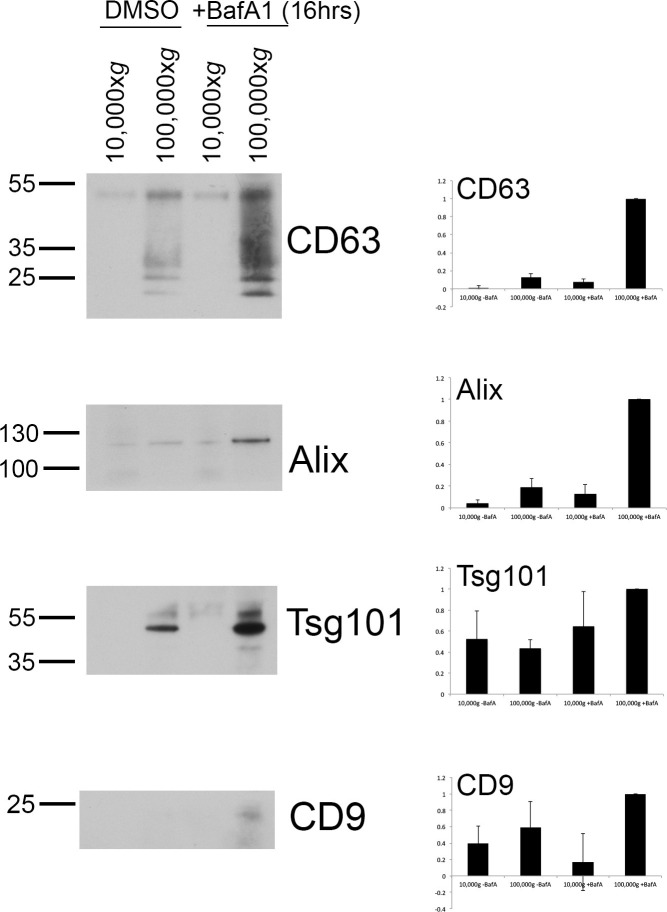
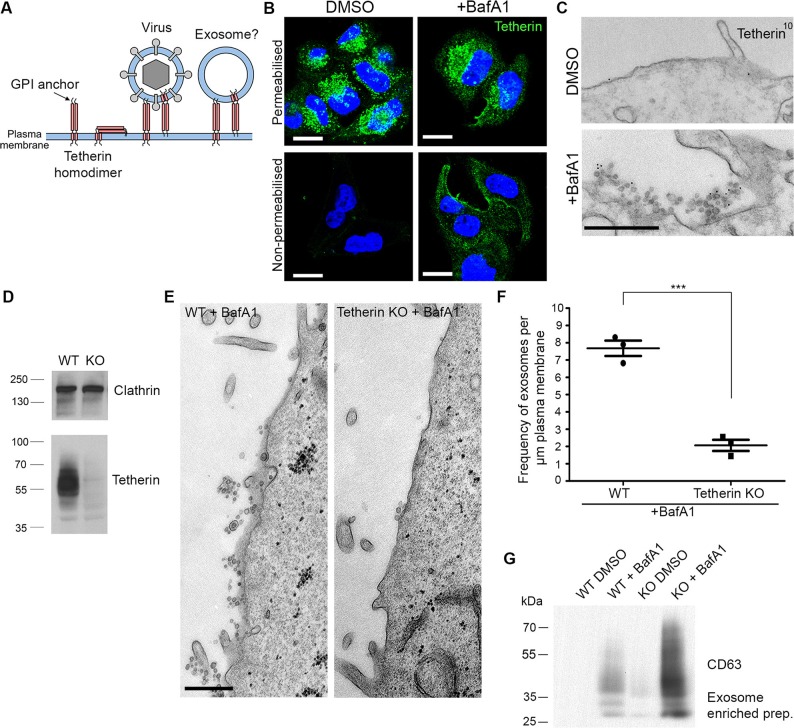
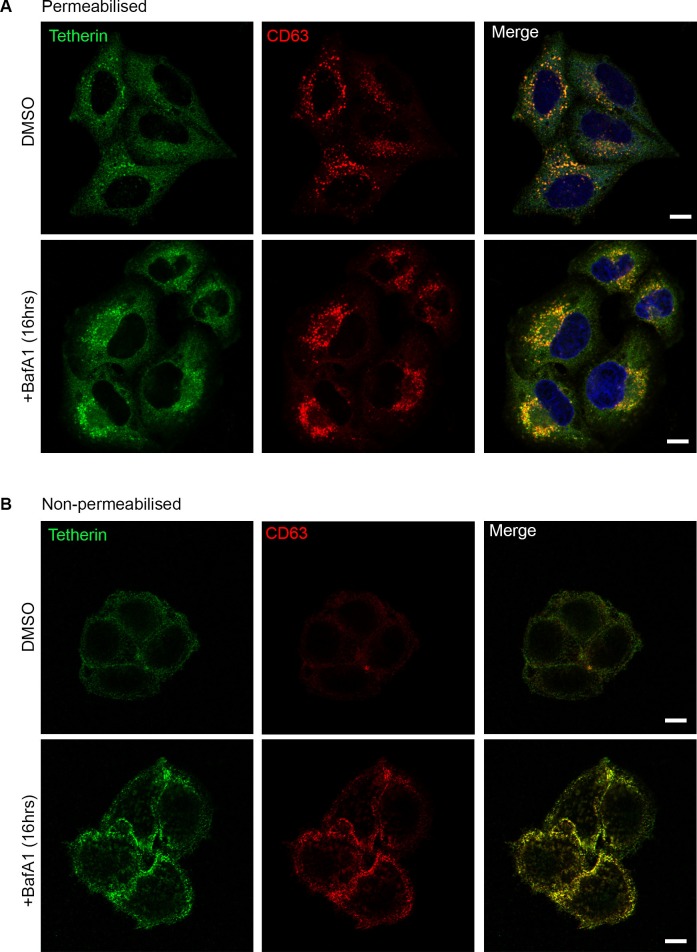
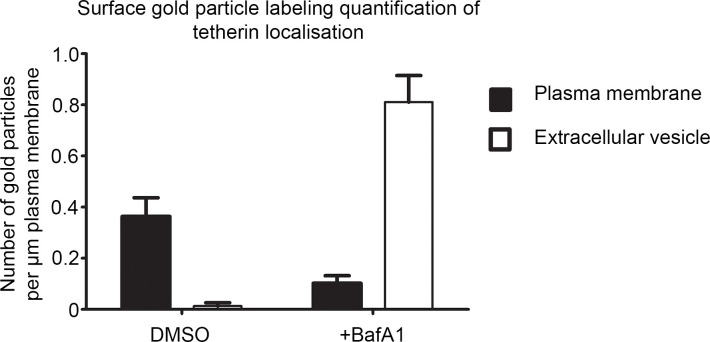
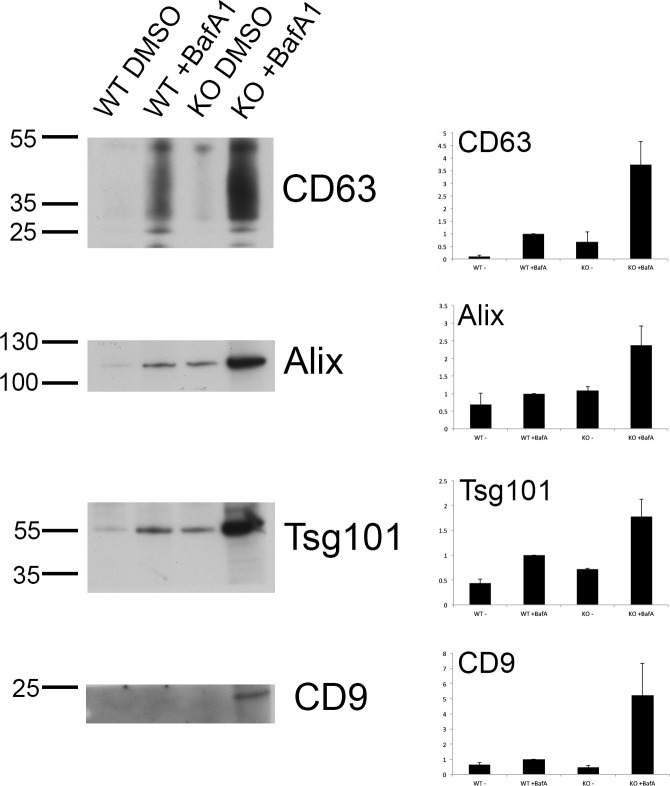
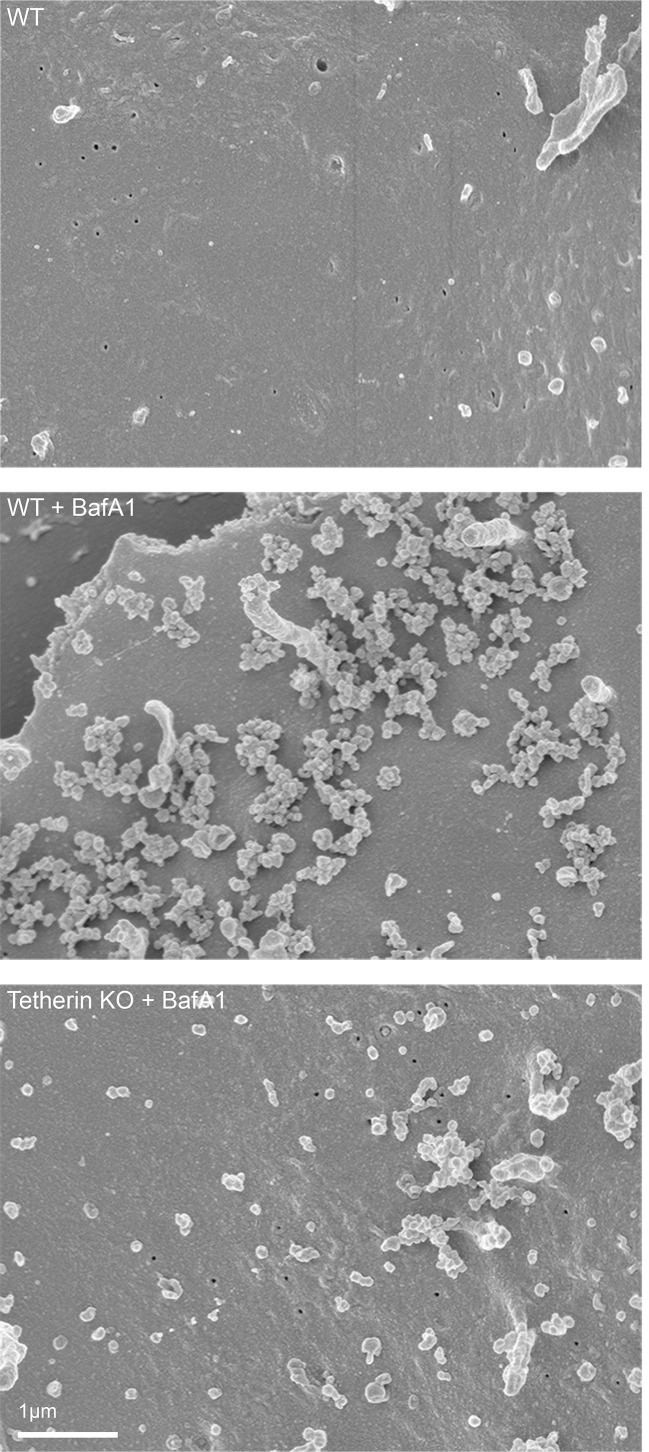
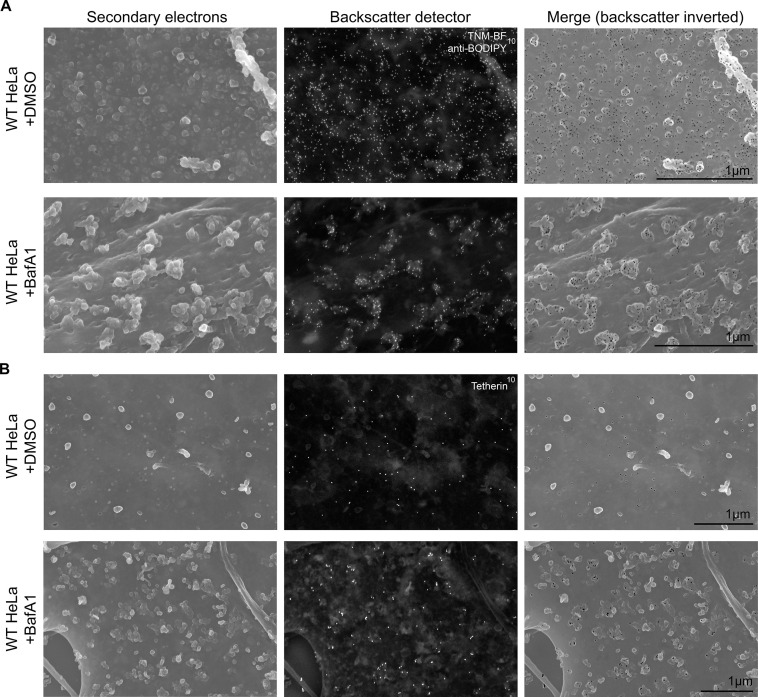
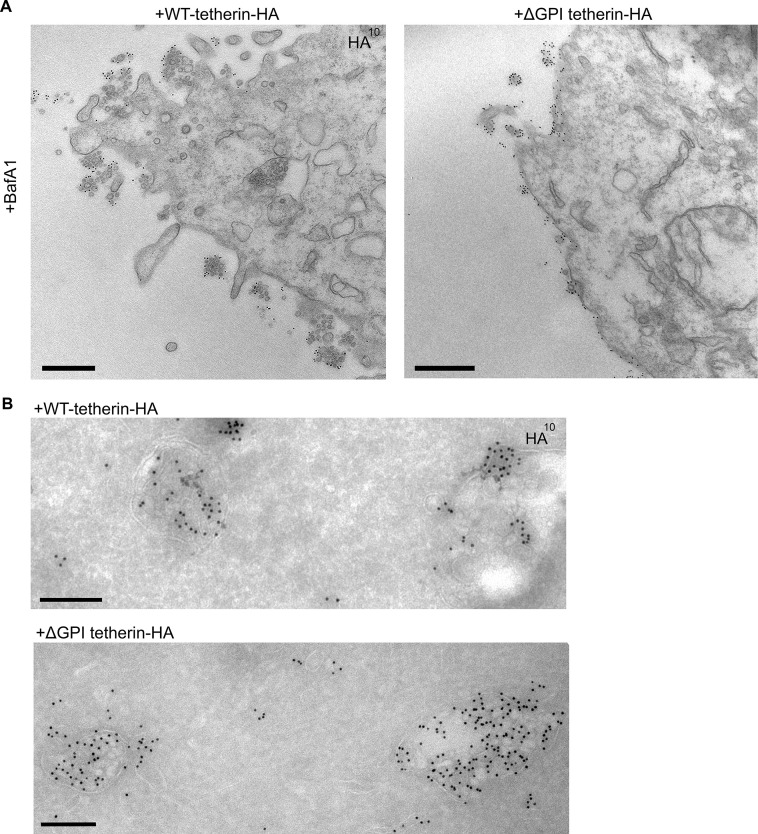
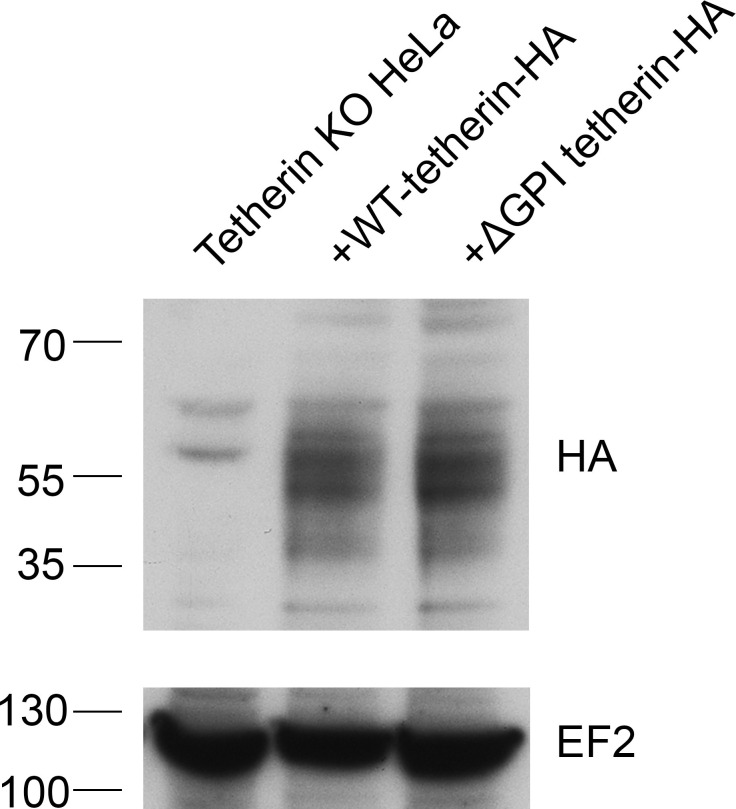
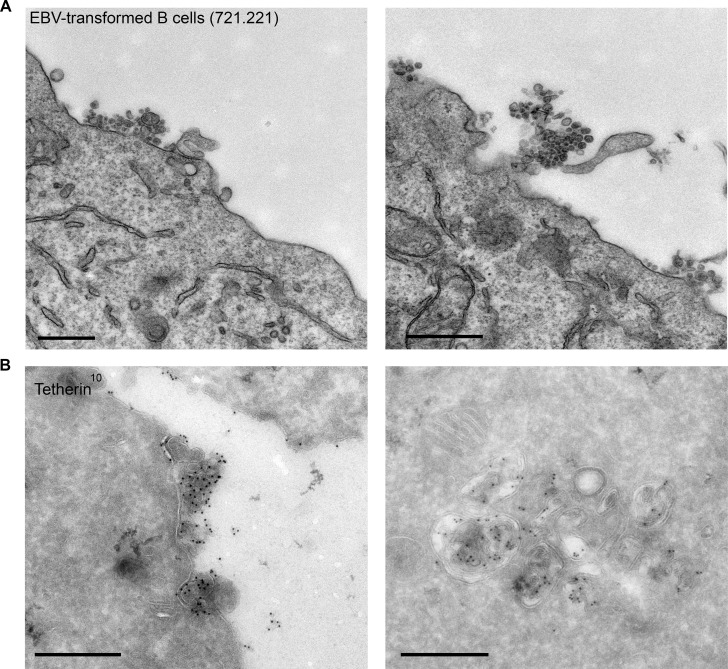
Exosomes are extracellular vesicles that are released when endosomes fuse with the plasma membrane. They have been implicated in various functions in both health and disease, including intercellular communication, antigen presentation, prion transmission, and tumour cell metastasis. Here we show that inactivating the vacuolar ATPase in HeLa cells causes a dramatic increase in the production of exosomes, which display endocytosed tracers, cholesterol, and CD63. The exosomes remain clustered on the cell surface, similar to retroviruses, which are attached to the plasma membrane by tetherin. To determine whether tetherin also attaches exosomes, we knocked it out and found a 4-fold reduction in plasma membrane-associated exosomes, with a concomitant increase in exosomes discharged into the medium. This phenotype could be rescued by wild-type tetherin but not tetherin lacking its GPI anchor. We propose that tetherin may play a key role in exosome fate, determining whether they participate in long-range or short-range interactions.
Overview
The claims and statistics of this paper haven’t been checked yet.
Run the check — free, no account needed. It reads the open-access text and checks the sources it cites.
Integrity signals
Registry
Cites
Statistics
Figures
Verification
Claims the paper makes
The claims and statistics of this paper haven’t been checked yet.
Run the check — free, no account needed. It reads the open-access text and checks the sources it cites.
Claims other papers make about this one
Each is checked against this paper’s own text: does it say what the citing paper says it does?
The cited source says what the claim attributes to it.
In the citing paper
“Indeed, exosome clustering can be induced when the endolysosomal V-ATPase is inhibited”
From GAPDH controls extracellular vesicle biogenesis and enhances the therapeutic potential of EV mediated siRNA delivery to the brain (2021) · cites this paper as [65]
Self-check
Percentages, sums and reported differences re-computed from the paper’s own numbers.
The self-check needs the paper’s full text.
Citations
Cites
Extracellular vesicles: Exosomes, microvesicles, and friends
Raposo, G., & Stoorvogel, W. (2013) · Journal of Cell Biology · doi:10.1083/jcb.201211138 · Cited by 8,099
Isolation and Characterization of Exosomes from Cell Culture Supernatants and Biological Fluids
Théry, C., Amigorena, S., Raposo, G., & Clayton, A. (2006) · Current Protocols in Cell Biology · doi:10.1002/0471143030.cb0322s30 · Cited by 5,766
B lymphocytes secrete antigen-presenting vesicles.
Raposo, G., Nijman, H. W., Stoorvogel, W., Liejendekker, R., Harding, C. V., Melief, C. J., & Geuze, H. J. (1996) · The Journal of experimental medicine · doi:10.1084/jem.183.3.1161 · Cited by 3,546
Exosomes – vesicular carriers for intercellular communication
Simons, M., & Raposo, G. (2009) · Current Opinion in Cell Biology · doi:10.1016/j.ceb.2009.03.007 · Cited by 2,410
Tetherin inhibits retrovirus release and is antagonized by HIV-1 Vpu
Neil, S. J. D., Zang, T. M., & Bieniasz, P. D. (2008) · Nature · doi:10.1038/nature06553 · Cited by 1,886
Cancer Exosomes Perform Cell-Independent MicroRNA Biogenesis and Promote Tumorigenesis
Melo, S. A., Sugimoto, H., O’Connell, J. T., Kato, N., Villanueva, A., Vidal, A., Qiu, L., Vitkin, E. I., Perelman, L. T., Melo, C. A., et al. (2014) · Cancer Cell · doi:10.1016/j.ccell.2014.09.005 · Cited by 1,566
A new method of preparing gold probes for multiple-labeling cytochemistry.
Slot, J. W., & Geuze, H. J. (1985) · PubMed · Cited by 1,403
Alzheimer’s disease β-amyloid peptides are released in association with exosomes
Rajendran, L., Honsho, M., Zahn, T. R., Keller, P., Geiger, K. D., Verkade, P., & Simons, K. (2006) · Proceedings of the National Academy of Sciences · doi:10.1073/pnas.0603838103 · Cited by 1,343
Rodal, S. K., Skretting, G., Garred, Ø., Vilhardt, F., van Deurs, B., & Sandvig, K. (1999) · Molecular Biology of the Cell · doi:10.1091/mbc.10.4.961 · Cited by 1,009
Cells release prions in association with exosomes
Février, B., Vilette, D., Archer, F., Loew, D., Faigle, W., Vidal, M., Laude, H., & Raposo, G. (2004) · Proceedings of the National Academy of Sciences · doi:10.1073/pnas.0308413101 · Cited by 998
Tumor microenvironment derived exosomes pleiotropically modulate cancer cell metabolism
Zhao, H., Yang, L., Baddour, J., Achreja, A., Bernard, V., Moss, T., Marini, J. C., Tudawe, T., Seviour, E. G., San Lucas, F. A., et al. (2016) · eLife · doi:10.7554/elife.10250 · Cited by 927
Exosomal cell-to-cell transmission of alpha synuclein oligomers
Danzer, K. M., Kranich, L. R., Ruf, W. P., Cagsal‐Getkin, O., Winslow, A. R., Zhu, L., Vanderburg, C. R., & McLean, P. J. (2012) · Molecular Neurodegeneration · doi:10.1186/1750-1326-7-42 · Cited by 880
Slot, J. W., Geuze, H. J., Gigengack, S., Lienhard, G. E., & James, D. E. (1991) · The Journal of Cell Biology · doi:10.1083/jcb.113.1.123 · Cited by 862
Exosomes in cancer: small particle, big player
Zhang, X., Yuan, X., Shi, H., Wu, L., Qian, H., & Xu, W. (2015) · Journal of Hematology & Oncology · doi:10.1186/s13045-015-0181-x · Cited by 799
Lysosomal dysfunction increases exosome-mediated alpha-synuclein release and transmission
Alvarez‐Erviti, L., Seow, Y., Schapira, A. H. V., Gardiner, C., Sargent, I. L., Wood, M. J. A., & Cooper, J. A. D. (2011) · Neurobiology of Disease · doi:10.1016/j.nbd.2011.01.029 · Cited by 762
Trafficking and function of the tetraspanin CD63
Pols, M. S., & Klumperman, J. (2009) · Experimental Cell Research · doi:10.1016/j.yexcr.2008.09.020 · Cited by 745
Ono, M., Kosaka, N., Tominaga, N., Yoshioka, Y., Takeshita, F., Takahashi, R., Yoshida, M., Tsuda, H., Tamura, K., & Ochiya, T. (2014) · Science Signaling · doi:10.1126/scisignal.2005231 · Cited by 703
Directional cell movement through tissues is controlled by exosome secretion
Sung, B., Ketova, T., Hoshino, D., Zijlstra, A., & Weaver, A. M. (2015) · Nature Communications · doi:10.1038/ncomms8164 · Cited by 563
Möbius, W., van Donselaar, E. G., Ohno‐Iwashita, Y., Shimada, Y., Heijnen, H. F. G., Slot, J. W., & Geuze, H. J. (2003) · Traffic · doi:10.1034/j.1600-0854.2003.00072.x · Cited by 453
Blasius, A. L., Giurisato, E., Cella, M., Schreiber, R. D., Shaw, A. S., & Colonna, M. (2006) · The Journal of Immunology · doi:10.4049/jimmunol.177.5.3260 · Cited by 436
Möbius, W., Ohno‐Iwashita, Y., van Donselaar, E. G., Oorschot, V. M. J., Shimada, Y., Fujimoto, T., Heijnen, H. F. G., Geuze, H. J., & Slot, J. W. (2002) · Journal of Histochemistry & Cytochemistry · doi:10.1177/002215540205000105 · Cited by 302
A novel adaptor-related protein complex.
Simpson, F., Bright, N. A., West, M. A., Newman, L. S., Darnell, R. B., & Robinson, M. S. (1996) · The Journal of Cell Biology · doi:10.1083/jcb.133.4.749 · Cited by 239
Self-citationHrs‐ and CD63 ‐Dependent Competing Mechanisms Make Different Sized Endosomal Intraluminal Vesicles
Edgar, J. R., Eden, E. R., & Futter, C. E. (2013) · Traffic · doi:10.1111/tra.12139 · Cited by 234
Self-citationIshikawa, J., Kaisho, T., Tomizawa, H., Lee, B. O., Kobune, Y., Inazawa, J., Oritani, K., Itoh, M., Ochi, T., Ishihara, K., et al. (1995) · Genomics · doi:10.1016/0888-7543(95)80171-h · Cited by 215
Selective binding of perfringolysin O derivative to cholesterol-rich membrane microdomains (rafts)
Waheed, A. A., Shimada, Y., Heijnen, H. F. G., Nakamura, M., Inomata, M., Hayashi, M., Iwashita, S., Slot, J. W., & Ohno‐Iwashita, Y. (2001) · Proceedings of the National Academy of Sciences · doi:10.1073/pnas.091090798 · Cited by 214
Increased Accumulation of Intraneuronal Amyloid β in HIV-Infected Patients
HNRC, Achim, C. L., Adame, A., Dumaop, W., Everall, I. P., & Masliah, E. (2009) · Journal of Neuroimmune Pharmacology · doi:10.1007/s11481-009-9152-8 · Cited by 205
A novel membrane antigen selectively expressed on terminally differentiated human B cells
Goto, T., Kennel, S., Abe, M., Takishita, M., Kosaka, M., Solomon, A., & Saito, S. (1994) · Blood · doi:10.1182/blood.v84.6.1922.1922 · Cited by 188
Multivariate proteomic profiling identifies novel accessory proteins of coated vesicles
Borner, G. H. H., Antrobus, R., Hirst, J., Bhumbra, G. S., Kozik, P., Jackson, L. P., Sahlender, D. A., & Robinson, M. S. (2012) · The Journal of Cell Biology · doi:10.1083/jcb.201111049 · Cited by 169
Self-citationMarine antifungal theonellamides target 3β-hydroxysterol to activate Rho1 signaling
Nishimura, S., Arita, Y., Honda, M., Iwamoto, K., Matsuyama, A., Shirai, A., Kawasaki, H., Kakeya, H., Kobayashi, T., Matsunaga, S., et al. (2010) · Nature Chemical Biology · doi:10.1038/nchembio.387 · Cited by 125
Self-citationA niche role for cancer exosomes in metastasis
Zhang, Y., & Wang, X.-F. (2015) · Nature Cell Biology · doi:10.1038/ncb3181 · Cited by 118
Mechanism of HIV-1 Virion Entrapment by Tetherin
Venkatesh, S., & Bieniasz, P. D. (2013) · PLoS Pathogens · doi:10.1371/journal.ppat.1003483 · Cited by 116
Kozik, P., Hodson, N. A., Sahlender, D. A., Simecek, N., Soromani, C., Wu, J., Collinson, L., & Robinson, M. S. (2012) · Nature Cell Biology · doi:10.1038/ncb2652 · Cited by 116
Self-citationHabermann, A., Krijnse‐Locker, J., Oberwinkler, H., Eckhardt, M., Homann, S., Andrew, A. J., Strebel, K., & Kräusslich, H. (2010) · Journal of Virology · doi:10.1128/jvi.02421-09 · Cited by 99
Increased frequency of α-synuclein in the substantia nigra in human immunodeficiency virus infection
Khanlou, N., Khanlou, N., Moore, D. J., Khanlou, N., Moore, D. J., Chana, G., Cherner, M., Lazzaretto, D., Dawes, S. E., Grant, I., et al. (2009) · Journal of NeuroVirology · doi:10.1080/13550280802578075 · Cited by 87
Anastasiadou, E., & Slack, F. J. (2014) · Science · doi:10.1126/science.aaa4024 · Cited by 72
Giese, S., & Marsh, M. (2014) · PLoS Pathogens · doi:10.1371/journal.ppat.1004189 · Cited by 63
CD317/Tetherin is an organiser of membrane microdomains
Billcliff, P. G., Rollason, R., Prior, I. A., Owen, D. M., Gaus, K., & Banting, G. S. (2013) · Journal of Cell Science · doi:10.1242/jcs.112953 · Cited by 56
Self-citationKwiatkowska, K., Marszałek–Sadowska, E., Traczyk, G., Koprowski, P., Musielak, M., Ługowska, A., Kulma, M., Grzelczyk, A., & Sobota, A. (2014) · Orphanet Journal of Rare Diseases · doi:10.1186/1750-1172-9-64 · Cited by 39
Tetherin/BST-2 promotes dendritic cell activation and function during acute retrovirus infection
Li, S. X., Barrett, B. S., Guo, K., Kassiotis, G., Hasenkrug, K. J., Dittmer, U., Sutter, K., & Santiago, M. L. (2016) · Scientific Reports · doi:10.1038/srep20425 · Cited by 30
Visualization of Sterol-Rich Membrane Domains with Fluorescently-Labeled Theonellamides
Nishimura, S., Ishii, K., Iwamoto, K., Arita, Y., Matsunaga, S., Ohno‐Iwashita, Y., Sato, S. B., Kakeya, H., Kobayashi, T., & Yoshida, M. (2013) · PLoS ONE · doi:10.1371/journal.pone.0083716 · Cited by 28
Self-citation
Cited by
Sorted by citations
Théry, C., Witwer, K. W., Aikawa, E., Alcaraz, M. J., Anderson, J. D., Andriantsitohaina, R., Antoniou, A., Arab, T., Archer, F., Atkin‐Smith, G. K., et al. (2018) · Journal of Extracellular Vesicles · doi:10.1080/20013078.2018.1535750 · Cited by 11,099
Shedding light on the cell biology of extracellular vesicles
van Niel, G., D'Angelo, G., & Raposo, G. (2018) · Nature Reviews Molecular Cell Biology · doi:10.1038/nrm.2017.125 · Cited by 8,369
Mathieu, M., Jaular, L. M., Lavieu, G., & Théry, C. (2018) · Nature Cell Biology · doi:10.1038/s41556-018-0250-9 · Cited by 3,863
Pegtel, D. M., & Gould, S. J. (2019) · Annual Review of Biochemistry · doi:10.1146/annurev-biochem-013118-111902 · Cited by 2,682
Current knowledge on exosome biogenesis and release
Hessvik, N. P., & Llorente, A. (2018) · Cellular and Molecular Life Sciences · doi:10.1007/s00018-017-2595-9 · Cited by 2,362
Metadata
- Authors
- Edgar, J. R., Manna, P. T., Nishimura, S., Banting, G., & Robinson, M. S.
- Affiliations
- University of Cambridge (GB)
- Kyoto University (JP)
- University of Bristol (GB)
- Corresponding author
- Edgar, James R
- Robinson, Margaret S
- ORCID
- Edgar, James R
- Venue
- eLife
- Publisher
- eLife Sciences Publications, Ltd
- Published
- 2016-09-22
- Volume
- 5
- ISSN
- 2050-084X (ISSN-L)
- PMC
- PMC5033606
- OpenAlex
- W2521188441
- Cited by
- 161
- References
- 40
- Citations by year
- 2026: 6 · 2025: 16 · 2024: 29 · 2023: 12 · 2022: 13 · 2021: 20 · 2020: 25 · 2019: 11 · 2018: 24 · 2017: 5
- FWCI
- 7.11
- Type
- journal article
- Language
- en
- Open access
- gold
- doi.org
- Licence
- Locations
- eLife (publishedVersion, cc-by)
- PubMed Central (publishedVersion, cc-by)
- PubMed (publishedVersion)
- Explore Bristol Research (publishedVersion, cc-by)
- Institutional Repositories DataBase (IRDB) (submittedVersion)
- DOAJ (DOAJ: Directory of Open Access Journals) (submittedVersion, cc-by-sa)
- Kyoto University Research Information Repository (Kyoto University) (submittedVersion, cc-by)
- Bristol Research (University of Bristol) (submittedVersion, cc-by)
- Funders
- Wellcome Trust (086598, 100140, 093026)
- Topics
- Life Sciences › Biochemistry, Genetics and Molecular Biology › Molecular Biology › Extracellular vesicles in disease
- Life Sciences › Biochemistry, Genetics and Molecular Biology › Cell Biology › Cellular transport and secretion
- Physical Sciences › Materials Science › Biomaterials › Nanoparticle-Based Drug Delivery
- Keywords
- tetherin, exosomes, extracellular vesicles, vacuolar ATPase, glycosylphosphatidylinositol anchor, CD63, cholesterol, intercellular communication
About these checks
Registry, retraction, Cites and statistics results are computed, not judged, with one exception: a printed reference that no index lists is read once by a model before it counts as a citation error. Claims are extracted by a model and kept only when their quote appears verbatim in the text; each cited source is then checked, with a model’s help, for whether it says what the claim relies on. Those verdicts can be wrong — read the claim’s quote and the cited source before relying on one.
Statistics and arithmetic are recomputed, not judged.
Confidence bands are shown only for fields calibrated on our annotated test set. None is calibrated yet, so no band is shown.
What counts as a claim ›How we measure confidence ›How we check this ›
Are you an author, or do you see a problem with this page? Request a review
