

The DOI matches its Crossref record; 88 of the 88 references it cites were found in a registry or an index.
Global reorganisation of cis-regulatory units upon lineage commitment of human embryonic stem cells
Open accessAbstract
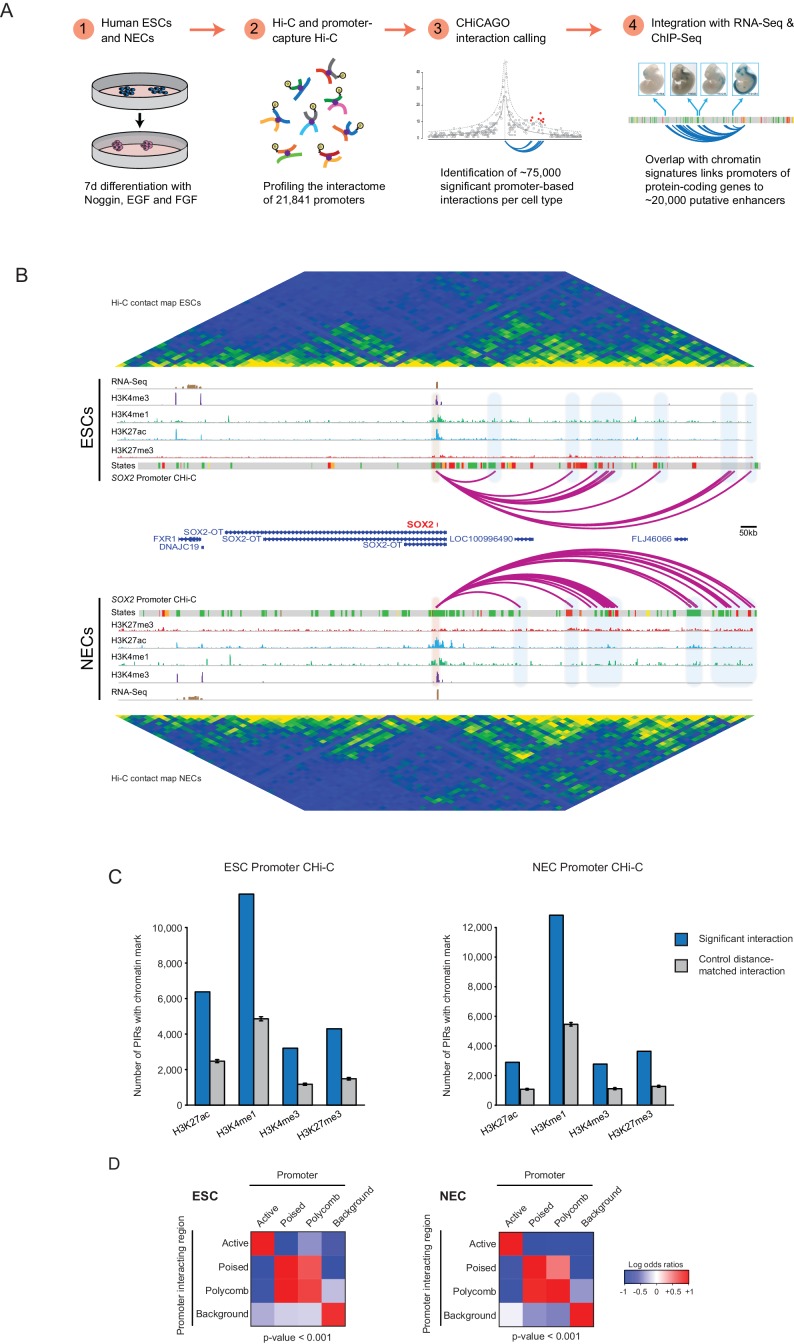
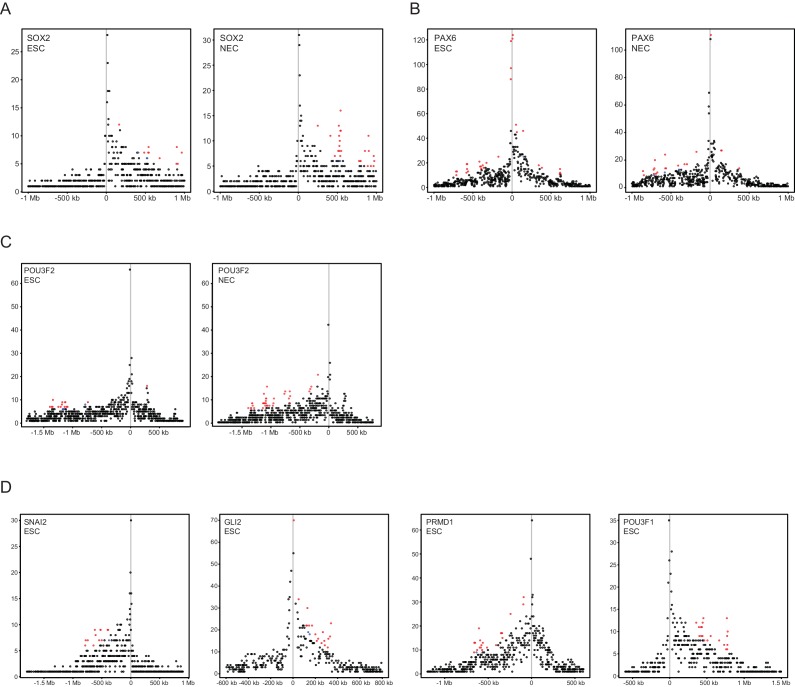
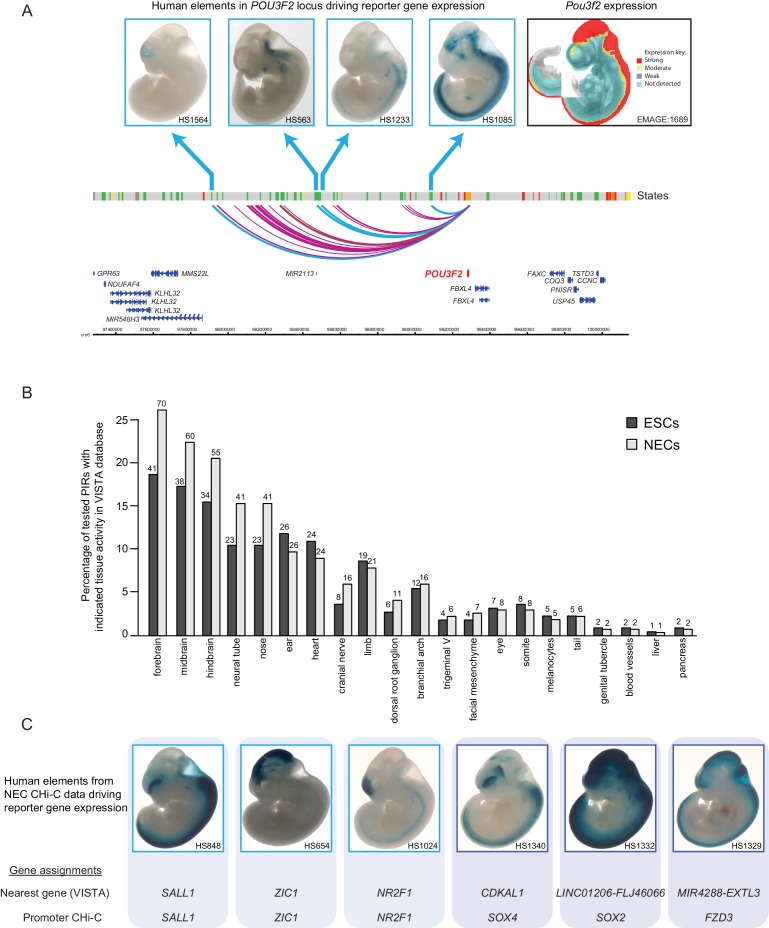
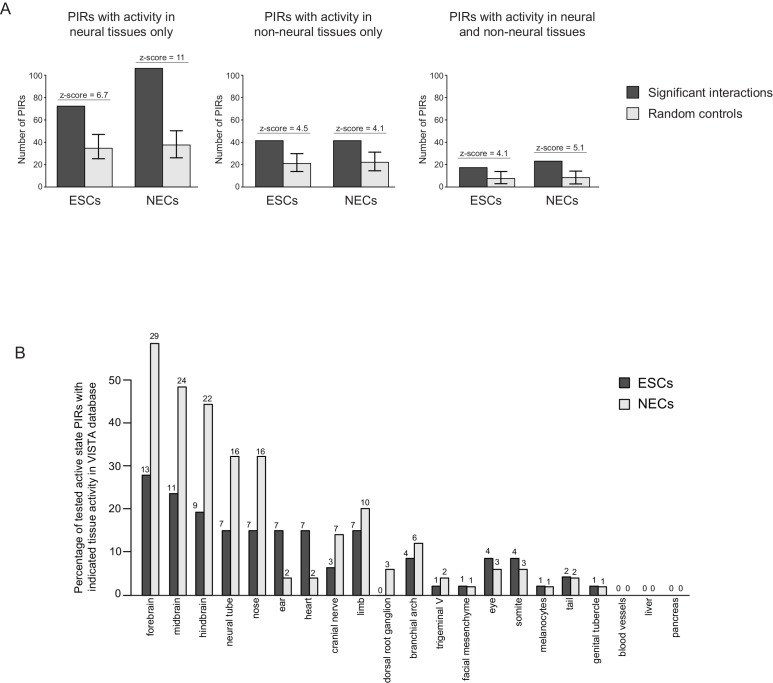
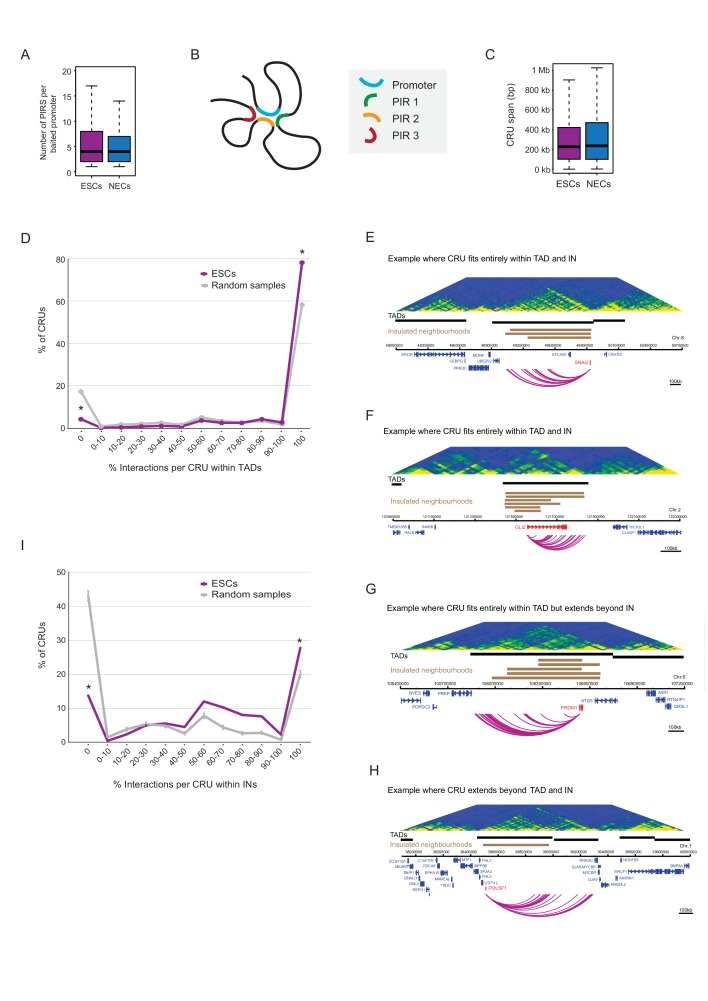
Long-range cis-regulatory elements such as enhancers coordinate cell-specific transcriptional programmes by engaging in DNA looping interactions with target promoters. Deciphering the interplay between the promoter connectivity and activity of cis-regulatory elements during lineage commitment is crucial for understanding developmental transcriptional control. Here, we use Promoter Capture Hi-C to generate a high-resolution atlas of chromosomal interactions involving ~22,000 gene promoters in human pluripotent and lineage-committed cells, identifying putative target genes for known and predicted enhancer elements. We reveal extensive dynamics of cis-regulatory contacts upon lineage commitment, including the acquisition and loss of promoter interactions. This spatial rewiring occurs preferentially with predicted changes in the activity of cis-regulatory elements and is associated with changes in target gene expression. Our results provide a global and integrated view of promoter interactome dynamics during lineage commitment of human pluripotent cells.
Overview
The claims and statistics of this paper haven’t been checked yet.
Run the check — free, no account needed. It reads the open-access text and checks the sources it cites.
Integrity signals
Registry
Cites
Statistics
Figures
Verification
Claims the paper makes
The claims and statistics of this paper haven’t been checked yet.
Run the check — free, no account needed. It reads the open-access text and checks the sources it cites.
Claims other papers make about this one
Each is checked against this paper’s own text: does it say what the citing paper says it does?
The source backs part of the claim, not all of it — or backs it for a different population, condition or comparison.
In the citing paper
“Notably, some contacts between PcG-associated regions, including poised promoters and enhancers in ESCs, are retained after these regions are activated during cell differentiation [141, 143].”
From Transcriptional enhancers and their communication with gene promoters (2021) · cites this paper as [141]
Experimental — accuracy not yet measuredThe source backs part of the claim, not all of it — or backs it for a different population, condition or comparison.
In the citing paper
“the chromatin state of the promoter at dual-state CRUs typically corresponded to the majority state of its enhancers, consistent with a competition of opposing regulatory effects at the promoters.”
From Transcriptional enhancers and their communication with gene promoters (2021) · cites this paper as [141]
Experimental — accuracy not yet measuredThe source backs part of the claim, not all of it — or backs it for a different population, condition or comparison.
In the citing paper
“Upon early neural differentiation, about a third of single-state CRUs in human ESCs became dual-state, while around half of all dual-state CRUs became single-state [141].”
From Transcriptional enhancers and their communication with gene promoters (2021) · cites this paper as [141]
Experimental — accuracy not yet measuredThe cited source says what the claim attributes to it.
In the citing paper
“Finally, some enhancers are marked with H3K27me3 alone and are considered to be “Polycomb-repressed” [139–141].”
From Transcriptional enhancers and their communication with gene promoters (2021) · cites this paper as [141]
The cited source says what the claim attributes to it.
In the citing paper
“In mammals, PcG-associated promoters and enhancers also engage in multitudes of looping contacts, particularly in early development [139, 141, 276, 357].”
From Transcriptional enhancers and their communication with gene promoters (2021) · cites this paper as [141]
The cited source says what the claim attributes to it.
In the citing paper
“In mammalian differentiation models, in contrast, extensive remodelling of enhancer–promoter contacts is typically observed consistently with enhancer activation [141, 394–397].”
From Transcriptional enhancers and their communication with gene promoters (2021) · cites this paper as [141]
The cited source says what the claim attributes to it.
In the citing paper
“Nonetheless, a significant minority of enhancers in human ESCs also show pre-existing “permissive” promoter contacts prior to activation [141, 394].”
From Transcriptional enhancers and their communication with gene promoters (2021) · cites this paper as [141]
The cited source says what the claim attributes to it.
In the citing paper
“Capture Hi-C analyses in multiple cell types consistently detect enhancer–promoter contacts that cross TAD boundaries [141, 243].”
From Transcriptional enhancers and their communication with gene promoters (2021) · cites this paper as [141]
The cited source says what the claim attributes to it.
In the citing paper
“with 20% of CRUs detected in these cells being “dual-state”, i.e. containing a mixture of active and poised or Polycomb-repressed enhancers [141].”
From Transcriptional enhancers and their communication with gene promoters (2021) · cites this paper as [141]
The cited source says what the claim attributes to it.
In the citing paper
“Changes in CRU state were predominantly driven by coordinated alterations in the chromatin state of enhancers and their promoter contacts, and were associated with significant changes in gene expression [141].”
From Transcriptional enhancers and their communication with gene promoters (2021) · cites this paper as [141]
The cited source says what the claim attributes to it.
In the citing paper
“Enhancers vastly outnumber promoters in human and mouse genomes [131], and consistently promoters often contact more than one enhancer in the same cell type [141, 243, 278, 279].”
From Transcriptional enhancers and their communication with gene promoters (2021) · cites this paper as [141]
The cited source says what the claim attributes to it.
In the citing paper
“Analyses in human ESCs and early ES-derived neural progenitors found that, as expected, enhancers within a CRU tended to have the same activity state in a given cell type [141].”
From Transcriptional enhancers and their communication with gene promoters (2021) · cites this paper as [141]
Self-check
Percentages, sums and reported differences re-computed from the paper’s own numbers.
The self-check needs the paper’s full text.
Citations
Cites
Moderated estimation of fold change and dispersion for RNA-seq data with DESeq2
Love, M. I., Huber, W., & Anders, S. (2014) · Genome Biology · doi:10.1186/s13059-014-0550-8 · Cited by 95,106 · cited 4×
“Genes differentially expressed between ESCs and NECs were identified using DESeq2 (FDR < 0.05 and a log2 fold change of >1.5).”
InfluentialAn integrated encyclopedia of DNA elements in the human genome
The ENCODE Project Consortium (2012) · Nature · doi:10.1038/nature11247 · Cited by 18,072
Heinz, S., Benner, C., Spann, N., Bertolino, E., Lin, Y. C., Laslo, P., Cheng, J. X., Murre, C., Singh, H., & Glass, C. K. (2010) · Molecular Cell · doi:10.1016/j.molcel.2010.05.004 · Cited by 13,382 · cited 1×
“7 (http://homer.salk.edu/homer/) (Heinz et al., 2010).”
TopHat: discovering splice junctions with RNA-Seq
Trapnell, C., Pachter, L. S., & Salzberg, S. L. (2009) · Bioinformatics · doi:10.1093/bioinformatics/btp120 · Cited by 11,682
The Human Genome Browser at UCSC
Kent, W. J., Sugnet, C. W., Furey, T. S., Roskin, K. M., Pringle, T. H., Zahler, A. M., & Haussler, A. D. (2002) · Genome Research · doi:10.1101/gr.229102 · Cited by 10,400 · cited 1×
“Data were converted to GRCh37 using liftOver (Kent et al., 2002).”
MethodComprehensive Mapping of Long-Range Interactions Reveals Folding Principles of the Human Genome
Lieberman-Aiden, E., van Berkum, N. L., Williams, L., Imakaev, M., Ragoczy, T., Telling, A., Amit, I., Lajoie, B. R., Sabo, P. J., Dorschner, M. O., et al. (2009) · Science · doi:10.1126/science.1181369 · Cited by 8,898 · cited 1×
“A/B compartments were called by computing the principal components of the distance- and coverage-corrected interaction profile correlation matrix at 250 kb resolution (Lieberman-Aiden et al., 2009).”
MethodTopological domains in mammalian genomes identified by analysis of chromatin interactions
Dixon, J. R., Selvaraj, S., Yue, F., Kim, A., Li, Y., Shen, Y., Hu, M., Liu, J. S., & Ren, B. (2012) · Nature · doi:10.1038/nature11082 · Cited by 6,829 · cited 2×
“TADs were identified based on directionality indices (Dixon et al., 2012) of Hi-C interactions 1 Mb upstream and downstream from a 25 kb sliding window every 5 kb steps, which were then smoothed using a running average over a ± 25 kb window.”
MethodIntegrative analysis of 111 reference human epigenomes
Roadmap Epigenomics Consortium, Kundaje, A., Meuleman, W., Ernst, J., Bilenky, M., Yen, A., Heravi-Moussavi, A., Kheradpour, P., Zhang, Z., Wang, J., et al. (2015) · Nature · doi:10.1038/nature14248 · Cited by 6,368 · cited 1×
“The definition of chromatin signatures has enabled the genome-wide identification of enhancer elements across multiple human cell types (ENCODE Project Consortium, 2012; Heintzman et al., 2007, 2009; Pennacchio et al., 2006; Rada-Iglesias et al., 2011; Kundaje et al., 2015).”
BackgroundHistone H3K27ac separates active from poised enhancers and predicts developmental state
Creyghton, M. P., Cheng, A. W., Welstead, G. G., Kooistra, T., Carey, B. W., Steine, E. J., Hanna, J., Lodato, M. A., Frampton, G. M., Sharp, P. A., et al. (2010) · Proceedings of the National Academy of Sciences · doi:10.1073/pnas.1016071107 · Cited by 4,302 · cited 1×
“…activity associated with poised and active enhancers and have been used to show that widespread changes in enhancer position and activity occur upon cell fate decisions such as the lineage commitment of pluripotent cells (Creyghton et al., 2010; Rada-Iglesias et al., 2011; Zentner et al., 2011).”
BackgroundHeintzman, N. D., Stuart, R. K., Hon, G., Fu, Y., Ching, C. W., Hawkins, R. D., Barrera, L. O., Van Calcar, S., Qu, C., Ching, K. A., et al. (2007) · Nature Genetics · doi:10.1038/ng1966 · Cited by 3,398 · cited 1×
“The definition of chromatin signatures has enabled the genome-wide identification of enhancer elements across multiple human cell types (ENCODE Project Consortium, 2012; Heintzman et al., 2007, 2009; Pennacchio et al., 2006; Rada-Iglesias et al., 2011; Kundaje et al., 2015).”
Background
Cited by
Sorted by citations
Long-range enhancer–promoter contacts in gene expression control
Schoenfelder, S., & Fraser, P. (2019) · Nature Reviews Genetics · doi:10.1038/s41576-019-0128-0 · Cited by 1,102
Self-citationThe role of 3D genome organization in development and cell differentiation
Zheng, H., & Xie, W. (2019) · Nature Reviews Molecular Cell Biology · doi:10.1038/s41580-019-0132-4 · Cited by 742
A compendium of promoter-centered long-range chromatin interactions in the human genome
Jung, I., Schmitt, A., Diao, Y., Lee, A. J., Liu, T., Yang, D., Tan, C., Eom, J., Chan, M., Chee, S., et al. (2019) · Nature Genetics · doi:10.1038/s41588-019-0494-8 · Cited by 362
The relationship between genome structure and function
Oudelaar, A. M., & Higgs, D. R. (2021) · Nature Reviews Genetics · doi:10.1038/s41576-020-00303-x · Cited by 304
Rubin, A. J., Barajas, B. C., Furlan-Magaril, M., Lopez-Pajares, V., Mumbach, M. R., Howard, I., Kim, D. S., Boxer, L. D., Cairns, J., Spivakov, M., et al. (2017) · Nature Genetics · doi:10.1038/ng.3935 · Cited by 293
Self-citation
Metadata
- Authors
- Freire-Pritchett, P., Schoenfelder, S., Várnai, C., Wingett, S. W., Cairns, J., Collier, A. J., García-Vílchez, R., Furlan-Magaril, M., Osborne, C. S., Fraser, P., Rugg-Gunn, P. J., & Spivakov, M.
- Affiliations
- Babraham Institute (GB)
- King's College London (GB)
- Epigenetics Programme, Babraham Institute, Cambridge, United Kingdom
- Corresponding author
- Spivakov, Mikhail
- ORCID
- Venue
- eLife
- Publisher
- eLife Sciences Publications, Ltd
- Published
- 2017-03-23
- Volume
- 6
- ISSN
- 2050-084X (ISSN-L)
- PMC
- PMC5407860
- OpenAlex
- W2602710346
- Cited by
- 161
- References
- 88
- Citations by year
- 2026: 9 · 2025: 12 · 2024: 13 · 2023: 16 · 2022: 20 · 2021: 25 · 2020: 17 · 2019: 19 · 2018: 24 · 2017: 6
- FWCI
- 7.37
- Type
- journal article
- Language
- en
- Open access
- gold
- doi.org
- Licence
- Locations
- eLife (publishedVersion, cc-by)
- Europe PMC (PubMed Central) (publishedVersion, cc-by)
- PubMed Central (publishedVersion, cc-by)
- PubMed (publishedVersion)
- Research Portal (King's College London) (submittedVersion, cc-by)
- DOAJ (DOAJ: Directory of Open Access Journals) (submittedVersion, cc-by-sa)
- UCL Discovery (University College London) (submittedVersion)
- University of Birmingham Research Portal (University of Birmingham) (submittedVersion, cc-by)
- Funders
- Wellcome (WT093736)
- Biotechnology and Biological Sciences Research Council (BB/J004480/1)
- Medical Research Council (MR/J003808/1)
- Topics
- Life Sciences › Biochemistry, Genetics and Molecular Biology › Molecular Biology › Genomics and Chromatin Dynamics
- Life Sciences › Biochemistry, Genetics and Molecular Biology › Molecular Biology › Pluripotent Stem Cells Research
- Life Sciences › Biochemistry, Genetics and Molecular Biology › Molecular Biology › Epigenetics and DNA Methylation
- Keywords
- cis-regulatory elements, enhancers, lineage commitment, human embryonic stem cells, chromatin interactions, promoter capture Hi-C, enhancer target genes, pluripotency
- MeSH terms
- Human Embryonic Stem Cells, Cell Differentiation, Gene Expression Regulation, Humans, Promoter Regions, Genetic, Transcription, Genetic, Regulatory Elements, Transcriptional
About these checks
Registry, retraction, Cites and statistics results are computed, not judged, with one exception: a printed reference that no index lists is read once by a model before it counts as a citation error. Claims are extracted by a model and kept only when their quote appears verbatim in the text; each cited source is then checked, with a model’s help, for whether it says what the claim relies on. Those verdicts can be wrong — read the claim’s quote and the cited source before relying on one.
Statistics and arithmetic are recomputed, not judged.
Confidence bands are shown only for fields calibrated on our annotated test set. None is calibrated yet, so no band is shown.
What counts as a claim ›How we measure confidence ›How we check this ›
Are you an author, or do you see a problem with this page? Request a review
