

The DOI matches its Crossref record; 90 of the 90 references it cites were found in a registry or an index.
Social interaction-induced activation of RNA splicing in the amygdala of microbiome-deficient mice
Open accessAbstract
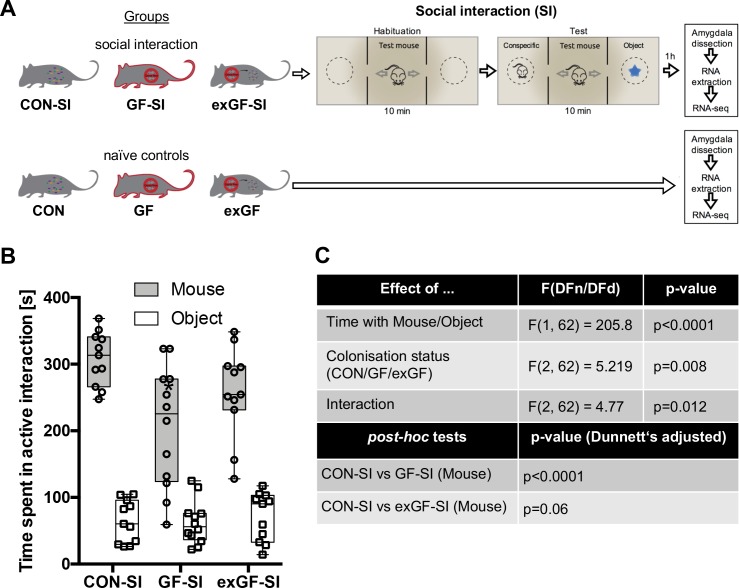
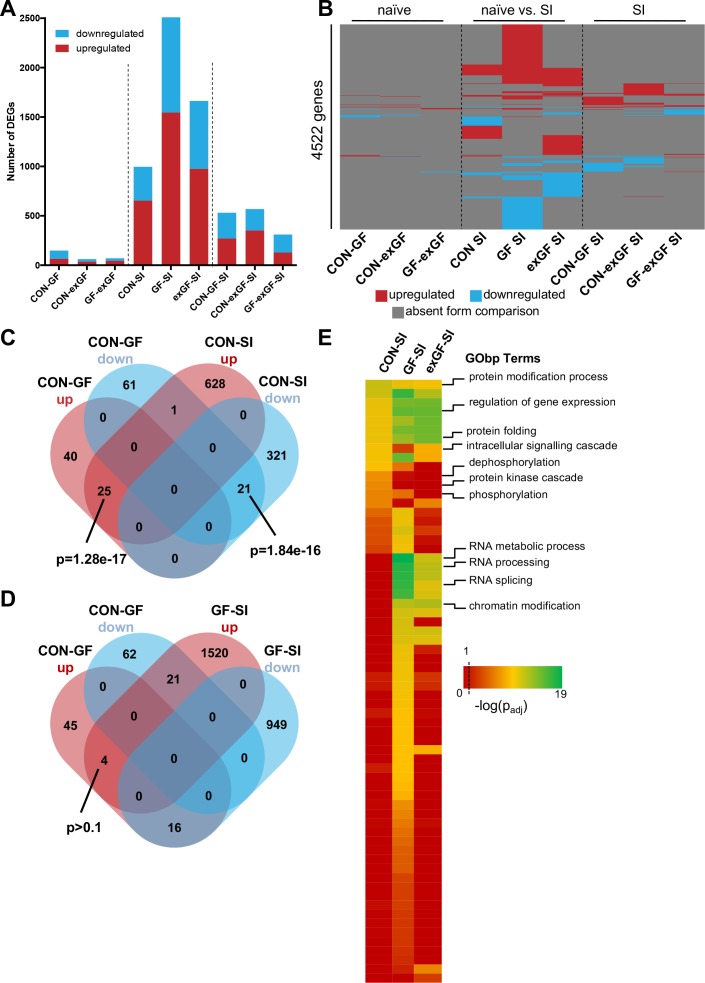
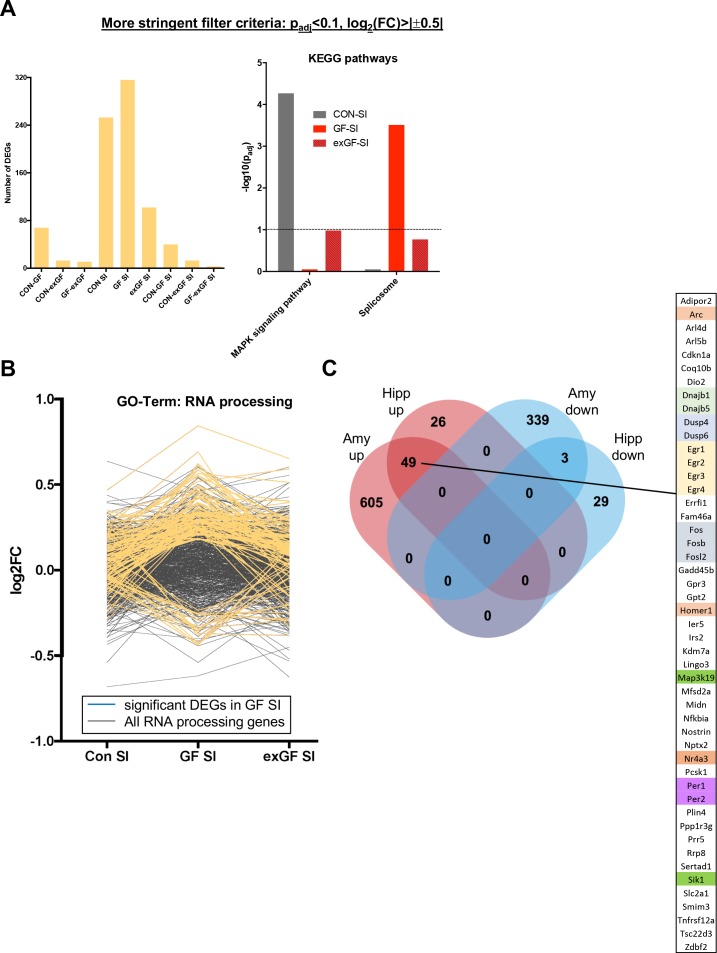
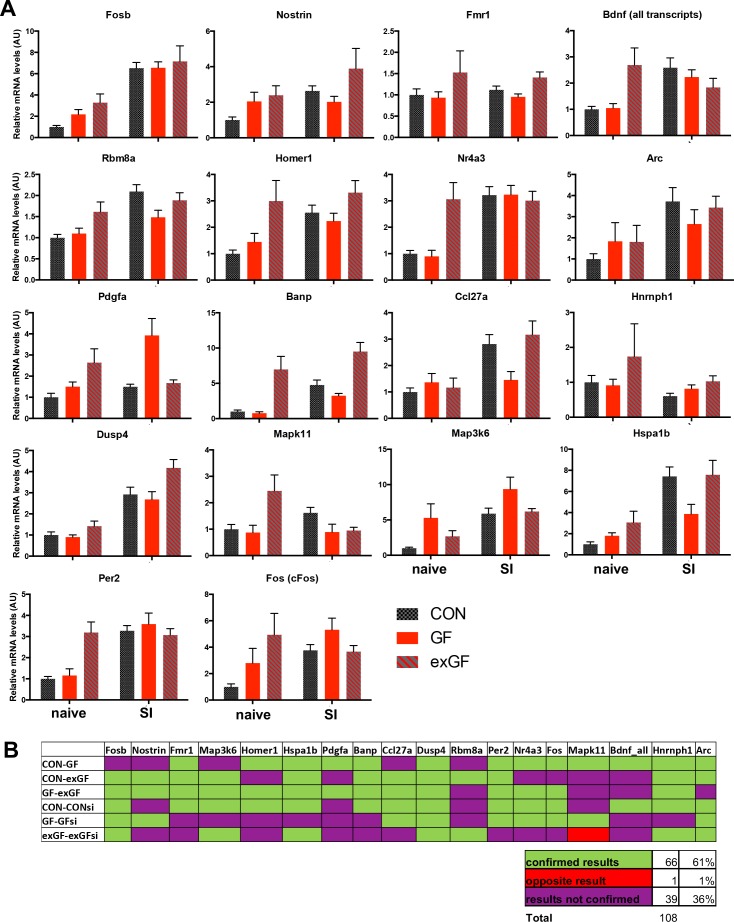
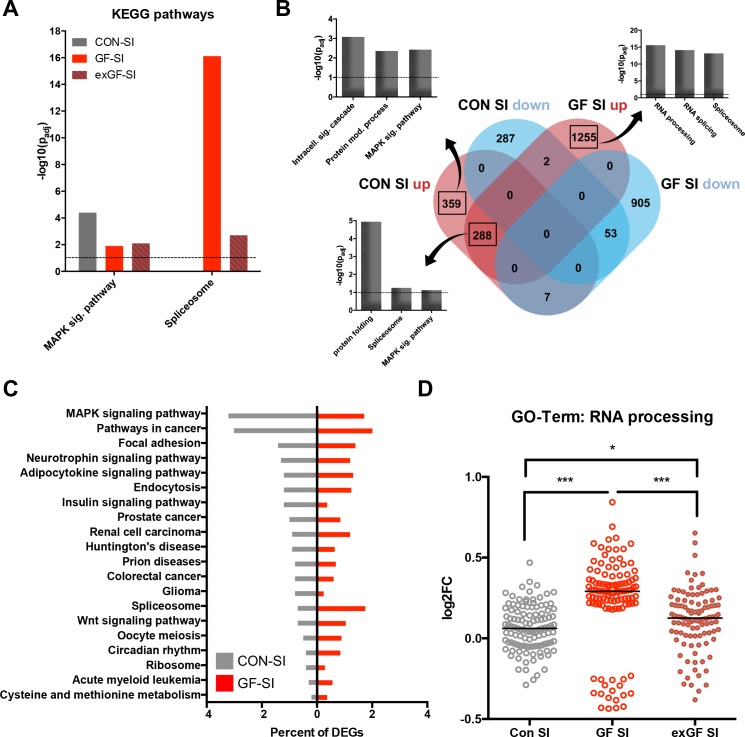
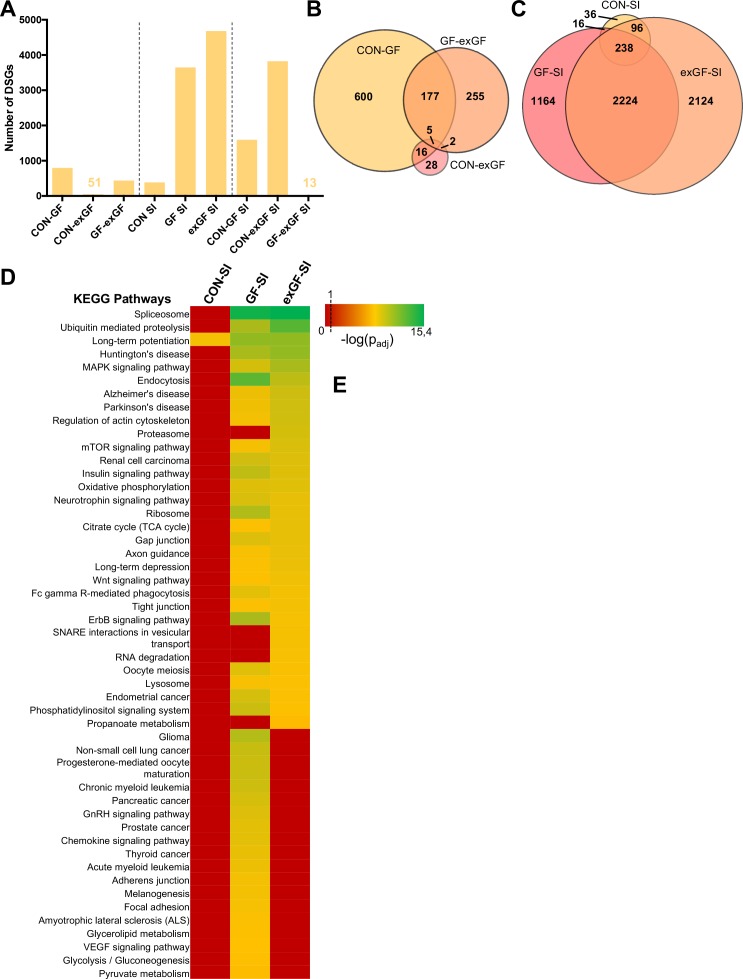
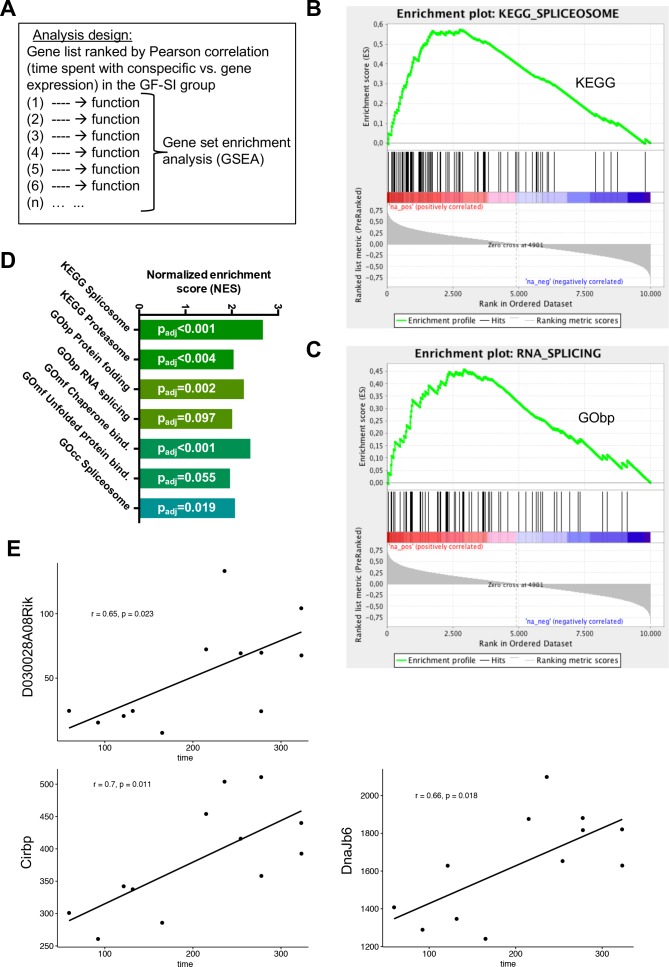
Social behaviour is regulated by activity of host-associated microbiota across multiple species. However, the molecular mechanisms mediating this relationship remain elusive. We therefore determined the dynamic, stimulus-dependent transcriptional regulation of germ-free (GF) and GF mice colonised post weaning (exGF) in the amygdala, a brain region critically involved in regulating social interaction. In GF mice the dynamic response seen in controls was attenuated and replaced by a marked increase in expression of splicing factors and alternative exon usage in GF mice upon stimulation, which was even more pronounced in exGF mice. In conclusion, we demonstrate a molecular basis for how the host microbiome is crucial for a normal behavioural response during social interaction. Our data further suggest that social behaviour is correlated with the gene-expression response in the amygdala, established during neurodevelopment as a result of host-microbe interactions. Our findings may help toward understanding neurodevelopmental events leading to social behaviour dysregulation, such as those found in autism spectrum disorders (ASDs).
Overview
The claims and statistics of this paper haven’t been checked yet.
Run the check — free, no account needed. It reads the open-access text and checks the sources it cites.
Integrity signals
Registry
Cites
Statistics
Figures
Verification
Claims the paper makes
The claims and statistics of this paper haven’t been checked yet.
Run the check — free, no account needed. It reads the open-access text and checks the sources it cites.
Claims other papers make about this one
Each is checked against this paper’s own text: does it say what the citing paper says it does?
The source backs part of the claim, not all of it — or backs it for a different population, condition or comparison.
In the citing paper
“In response to social interaction, there are profound alterations in the transcriptome and spliceosome in the amygdala of GF mice, which may contribute to the social deficits observed (Stilling et al., 2018).”
From The Microbiota-Gut-Brain Axis (2019) · cites this paper as Stilling et al., 2018
Experimental — accuracy not yet measuredThe cited source says what the claim attributes to it.
In the citing paper
“as well as enhanced expression of gene splicing factors and alternative exon usage (Stilling et al., 2018).”
From The Microbiota-Gut-Brain Axis (2019) · cites this paper as Stilling et al., 2018
The check wasn’t confident either way, so it gives no verdict — never disputed.
In the citing paper
“Moreover, while a conventionally colonized mouse will prefer to spend more time interacting with a novel conspecific over a familiar one, GF mice are unable to distinguish between either animal, which represents a cognitive deficit in the identification of social novelty (Desbonnet et al., 2014;Stilling et al., 2018).”
From The Microbiota-Gut-Brain Axis (2019) · cites this paper as Stilling et al., 2018
Experimental — accuracy not yet measured
Self-check
Percentages, sums and reported differences re-computed from the paper’s own numbers.
The self-check needs the paper’s full text.
Citations
Cites
Moderated estimation of fold change and dispersion for RNA-seq data with DESeq2
Love, M. I., Huber, W., & Anders, S. (2014) · Genome Biology · doi:10.1186/s13059-014-0550-8 · Cited by 95,106
Trimmomatic: a flexible trimmer for Illumina sequence data
Bolger, A. M., Lohse, M., & Usadel, B. (2014) · Bioinformatics · doi:10.1093/bioinformatics/btu170 · Cited by 65,548
Subramanian, A., Tamayo, P., Mootha, V. K., Mukherjee, S., Ebert, B. L., Gillette, M. A., Paulovich, A., Pomeroy, S. L., Golub, T. R., Lander, E. S., et al. (2005) · Proceedings of the National Academy of Sciences · doi:10.1073/pnas.0506580102 · Cited by 53,625
STAR: ultrafast universal RNA-seq aligner
Dobin, A., Davis, C. A., Schlesinger, F., Drenkow, J., Zaleski, C., Jha, S., Batut, P., Chaisson, M., & Gingeras, T. R. (2013) · Bioinformatics · doi:10.1093/bioinformatics/bts635 · Cited by 51,709
Systematic and integrative analysis of large gene lists using DAVID bioinformatics resources
Huang, D. W., Sherman, B. T., & Lempicki, R. A. (2009) · Nature Protocols · doi:10.1038/nprot.2008.211 · Cited by 35,890
HTSeq—a Python framework to work with high-throughput sequencing data
Anders, S., Pyl, P. T., & Huber, W. (2015) · Bioinformatics · doi:10.1093/bioinformatics/btu638 · Cited by 21,464
Differential expression analysis for sequence count data
Anders, S., & Huber, W. (2010) · Genome Biology · doi:10.1186/gb-2010-11-10-r106 · Cited by 15,581
Huang, D. W., Sherman, B. T., & Lempicki, R. A. (2009) · Nucleic Acids Research · doi:10.1093/nar/gkn923 · Cited by 14,108
Gene Expression Omnibus: NCBI gene expression and hybridization array data repository
Edgar, R. (2002) · Nucleic Acids Research · doi:10.1093/nar/30.1.207 · Cited by 13,288
Mind-altering microorganisms: the impact of the gut microbiota on brain and behaviour
Cryan, J. F., & Dinan, T. G. (2012) · Nature Reviews Neuroscience · doi:10.1038/nrn3346 · Cited by 4,572
Self-citation
Cited by
Sorted by citations
Cryan, J. F., O'Riordan, K. J., Cowan, C. S. M., Sandhu, K. V., Bastiaanssen, T. F. S., Boehme, M., Codagnone, M. G., Cussotto, S., Fulling, C., Golubeva, A. V., et al. (2019) · Physiological Reviews · doi:10.1152/physrev.00018.2018 · Cited by 5,286
Self-citationThe gut microbiome in neurological disorders
Cryan, J. F., O'Riordan, K. J., Sandhu, K., Peterson, V., & Dinan, T. G. (2020) · The Lancet Neurology · doi:10.1016/s1474-4422(19)30356-4 · Cited by 1,336
Self-citationHuman Gut Microbiota from Autism Spectrum Disorder Promote Behavioral Symptoms in Mice
Sharon, G., Cruz, N. J., Kang, D.-W., Gandal, M. J., Wang, B., Kim, Y.-M., Zink, E. M., Casey, C. P., Taylor, B. C., Lane, C. J., et al. (2019) · Cell · doi:10.1016/j.cell.2019.05.004 · Cited by 1,182
Cowan, C. S. M., Dinan, T. G., & Cryan, J. F. (2020) · Journal of Child Psychology and Psychiatry · doi:10.1111/jcpp.13156 · Cited by 176
Self-citationGutted! Unraveling the Role of the Microbiome in Major Depressive Disorder
Bastiaanssen, T. F. S., Cussotto, S., Claesson, M. J., Clarke, G., Dinan, T. G., & Cryan, J. F. (2020) · Harvard Review of Psychiatry · doi:10.1097/hrp.0000000000000243 · Cited by 159
Self-citation
Metadata
- Authors
- Stilling, R. M., Moloney, G. M., Ryan, F. J., Hoban, A. E., Bastiaanssen, T. F., Shanahan, F., Clarke, G., Claesson, M. J., Dinan, T. G., & Cryan, J. F.
- Affiliations
- University College Cork (IE)
- Corresponding author
- Stilling, Roman M
- Cryan, John F
- ORCID
- Venue
- eLife
- Publisher
- eLife Sciences Publications, Ltd
- Published
- 2018-05-29
- Volume
- 7
- ISSN
- 2050-084X (ISSN-L)
- PMC
- PMC5995540
- OpenAlex
- W2805802451
- Cited by
- 106
- References
- 90
- Citations by year
- 2026: 3 · 2025: 5 · 2024: 8 · 2023: 10 · 2022: 13 · 2021: 21 · 2020: 26 · 2019: 15 · 2018: 3
- FWCI
- 5.78
- Type
- journal article
- Language
- en
- Open access
- gold
- doi.org
- Licence
- Locations
- eLife (publishedVersion, cc-by)
- Europe PMC (PubMed Central) (publishedVersion, cc-by)
- PubMed Central (publishedVersion, cc-by)
- PubMed (publishedVersion)
- Arrow@dit (Dublin Institute of Technology) (acceptedVersion)
- Cork Open Research Archive (University College Cork, Ireland) (submittedVersion, cc-by)
- DOAJ (DOAJ: Directory of Open Access Journals) (submittedVersion)
- GoeScholar The Publication Server of the Georg-August-Universität Göttingen (Georg-August-Universität Göttingen) (submittedVersion, cc-by)
- Funders
- Science Foundation Ireland (12/RC/2273)
- Irish Research Council (GOIPD/2014/355)
- Irish Health Board
- National Alliance for Research on Schizophrenia and Depression (20771)
- Topics
- Life Sciences › Biochemistry, Genetics and Molecular Biology › Molecular Biology › Gut microbiota and health
- Life Sciences › Biochemistry, Genetics and Molecular Biology › Genetics › Genetics and Neurodevelopmental Disorders
- Life Sciences › Biochemistry, Genetics and Molecular Biology › Molecular Biology › RNA Research and Splicing
- Keywords
- host microbiome, germ-free mice, amygdala, RNA splicing, social interaction, social behavior, splicing factors, alternative exon usage, host-microbe interactions, brain development, autism spectrum disorder, gene expression regulation
- MeSH terms
- Autism Spectrum Disorder, Gastrointestinal Microbiome, RNA Splicing Factors, Amygdala, Animals, Animal Communication, Disease Models, Animal, Germ-Free Life, Male, Nerve Tissue Proteins, RNA Splicing, Weaning, Mice, Neurogenesis
About these checks
Registry, retraction, Cites and statistics results are computed, not judged, with one exception: a printed reference that no index lists is read once by a model before it counts as a citation error. Claims are extracted by a model and kept only when their quote appears verbatim in the text; each cited source is then checked, with a model’s help, for whether it says what the claim relies on. Those verdicts can be wrong — read the claim’s quote and the cited source before relying on one.
Statistics and arithmetic are recomputed, not judged.
Confidence bands are shown only for fields calibrated on our annotated test set. None is calibrated yet, so no band is shown.
What counts as a claim ›How we measure confidence ›How we check this ›
Are you an author, or do you see a problem with this page? Request a review
