Cited by 107Neural and Behavioral Psychology StudiesVisual perception and processing mechanismsNeural dynamics and brain function

The DOI matches its Crossref record; 100 of the 101 references it cites were found in a registry or an index, and 1 are not checked yet.

Human VMPFC encodes early signatures of confidence in perceptual decisions

Open access

Published version of a preprint

Abstract

Choice confidence, an individual’s internal estimate of judgment accuracy, plays a critical role in adaptive behaviour, yet its neural representations during decision formation remain underexplored. Here, we recorded simultaneous EEG-fMRI while participants performed a direction discrimination task and rated their confidence on each trial. Using multivariate single-trial discriminant analysis of the EEG, we identified a stimulus-independent component encoding confidence, which appeared prior to subjects’ explicit choice and confidence report, and was consistent with a confidence measure predicted by an accumulation-to-bound model of decision-making. Importantly, trial-to-trial variability in this electrophysiologically-derived confidence signal was uniquely associated with fMRI responses in the ventromedial prefrontal cortex (VMPFC), a region not typically associated with confidence for perceptual decisions. Furthermore, activity in the VMPFC was functionally coupled with regions of the frontal cortex linked to perceptual decision-making and metacognition. Our results suggest that the VMPFC holds an early confidence representation arising from decision dynamics, preceding and potentially informing metacognitive evaluation.

Overview

The claims and statistics of this paper haven’t been checked yet.

Run the check — free, no account needed. It reads the open-access text and checks the sources it cites.

A few free checks a day · papers already verified open instantly · results are public

Integrity signals

Registry

Crossref · 10.7554/elife.38293

Cites

100 of 101 references verified0 citation errors · 0 not checkable

Statistics

Figures

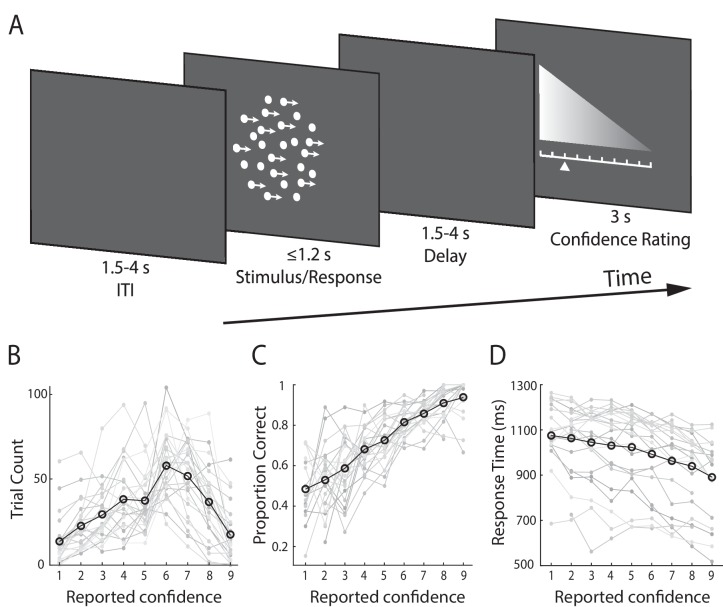
Figure 1. Experimental design and behavioural performance. (A) Schematic representation of the behavioural paradigm. Subjects made speeded left vs. right motion discriminations of random dot kinematograms calibrated to each individual’s perceptual threshold. Stimulus difficulty (i.e., motion coherence) and was held constant across trials. Stimuli were presented for up to 1.2 s, or until a behavioural response was made. After each direction decision, subjects rated their confidence on a 9-point scale (3 s). The response mapping for high vs. low confidence ratings alternated randomly across trials to control for motor preparation effects, and was indicated by the horizontal position of the scale, with the tall end representing high confidence. All behavioural responses were made on a button box, using the right hand. (B) Mean confidence rating behaviour, showing the frequency with which subjects selected each point on the confidence scale. (C) Mean proportion of correct direction choices as a function of reported confidence. (D) Mean response time as a function of reported confidence. Faint grey lines in (B), (C), and (D) indicate individual subject data. For (C) and (D) we excluded any trial averages based on fewer than five trials.
Figure 1. Experimental design and behavioural performance. (A) Schematic representation of the behavioural paradigm. Subjects made speeded left vs. right motion discriminations of random dot kinematograms calibrated to each individual’s perceptual threshold. Stimulus difficulty (i.e., motion coherence) and was held constant across trials. Stimuli were presented for up to 1.2 s, or until a behavioural response was made. After each direction decision, subjects rated their confidence on a 9-point scale (3 s). The response mapping for high vs. low confidence ratings alternated randomly across trials to control for motor preparation effects, and was indicated by the horizontal position of the scale, with the tall end representing high confidence. All behavioural responses were made on a button box, using the right hand. (B) Mean confidence rating behaviour, showing the frequency with which subjects selected each point on the confidence scale. (C) Mean proportion of correct direction choices as a function of reported confidence. (D) Mean response time as a function of reported confidence. Faint grey lines in (B), (C), and (D) indicate individual subject data. For (C) and (D) we excluded any trial averages based on fewer than five trials.CC BY · PubMed Central
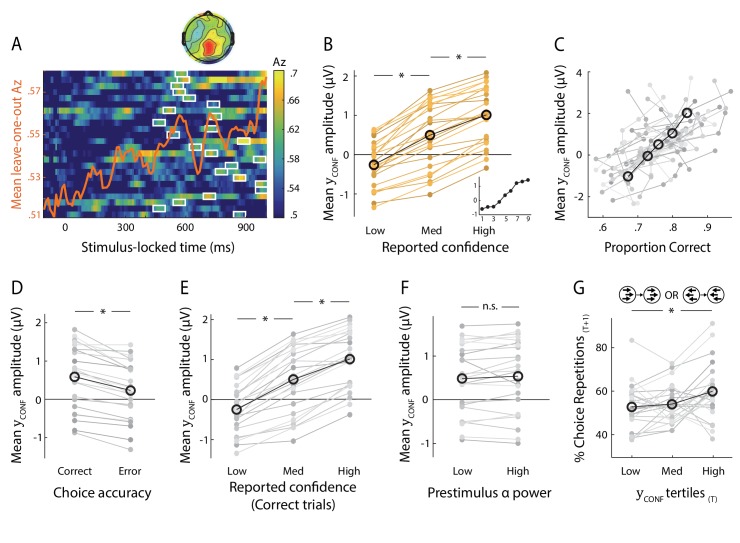
Figure 2. Neural representation of confidence in the EEG. (A) Classifier performance (Az) during High- vs. Low-confidence discrimination for stimulus-locked data. Each row represents the Az as a function of time, for a single subject (warm colours indicate higher values). The overlapping line (orange) shows the mean classifier performance across subjects. Outlined in white are the pre-response time windows of peak confidence discrimination used subsequently to extract single-trial measures of confidence (i.e., discriminant component amplitudes). In selecting these, we considered only the discrimination period ending, on average, at least 100 ms (across-subject mean 271 ± 162 ms) prior to subjects’ mean response times, to minimise potential confounds with activity related to motor execution, due to a sudden increase in corticospinal excitability in this period (Chen et al., 1998). Inset shows average (normalised) topography associated with the discriminating component at subject-specific times of peak confidence discrimination. (B) Mean amplitude of the confidence discriminant component as a function of reported confidence, showing a parametric effect across the Low, Medium, and High bins. The mean component amplitudes for individual confidence ratings (weighted by each subjects’ trial count per rating) are also shown (inset). (C) Trial-by-trial confidence discriminant component amplitudes were positively correlated with accuracy. To visualise this relationship, single-trial component amplitudes were grouped into five bins. (D) Mean amplitude of the confidence discriminant component for correct vs. error responses, showing a significant effect of choice accuracy.(E) Mean amplitude of the confidence discriminant component as a function of reported confidence, for correct trials only (in order to control for accuracy). The same pattern as in (B) is observed. (F) Mean amplitudes of the confidence discriminant component did not differ significantly between trials associated with High vs. Low prestimulus oscillatory power in the alpha band (which we used as a proxy for subjects’ prestimulus attentional state). (G) Relationship between the strength of electrophysiological confidence signals on the current trial (i.e., confidence-discriminating component amplitudes) and the tendency to repeat a choice on the immediately subsequent trial, for trial pairs showing stimulus motion in the same direction (i.e., nominally identical stimuli). Faint orange (in B) and grey lines (in C–G) represent individual subject data.
Figure 2. Neural representation of confidence in the EEG. (A) Classifier performance (Az) during High- vs. Low-confidence discrimination for stimulus-locked data. Each row represents the Az as a function of time, for a single subject (warm colours indicate higher values). The overlapping line (orange) shows the mean classifier performance across subjects. Outlined in white are the pre-response time windows of peak confidence discrimination used subsequently to extract single-trial measures of confidence (i.e., discriminant component amplitudes). In selecting these, we considered only the discrimination period ending, on average, at least 100 ms (across-subject mean 271 ± 162 ms) prior to subjects’ mean response times, to minimise potential confounds with activity related to motor execution, due to a sudden increase in corticospinal excitability in this period (Chen et al., 1998). Inset shows average (normalised) topography associated with the discriminating component at subject-specific times of peak confidence discrimination. (B) Mean amplitude of the confidence discriminant component as a function of reported confidence, showing a parametric effect across the Low, Medium, and High bins. The mean component amplitudes for individual confidence ratings (weighted by each subjects’ trial count per rating) are also shown (inset). (C) Trial-by-trial confidence discriminant component amplitudes were positively correlated with accuracy. To visualise this relationship, single-trial component amplitudes were grouped into five bins. (D) Mean amplitude of the confidence discriminant component for correct vs. error responses, showing a significant effect of choice accuracy.(E) Mean amplitude of the confidence discriminant component as a function of reported confidence, for correct trials only (in order to control for accuracy). The same pattern as in (B) is observed. (F) Mean amplitudes of the confidence discriminant component did not differ significantly between trials associated with High vs. Low prestimulus oscillatory power in the alpha band (which we used as a proxy for subjects’ prestimulus attentional state). (G) Relationship between the strength of electrophysiological confidence signals on the current trial (i.e., confidence-discriminating component amplitudes) and the tendency to repeat a choice on the immediately subsequent trial, for trial pairs showing stimulus motion in the same direction (i.e., nominally identical stimuli). Faint orange (in B) and grey lines (in C–G) represent individual subject data.CC BY · PubMed Central
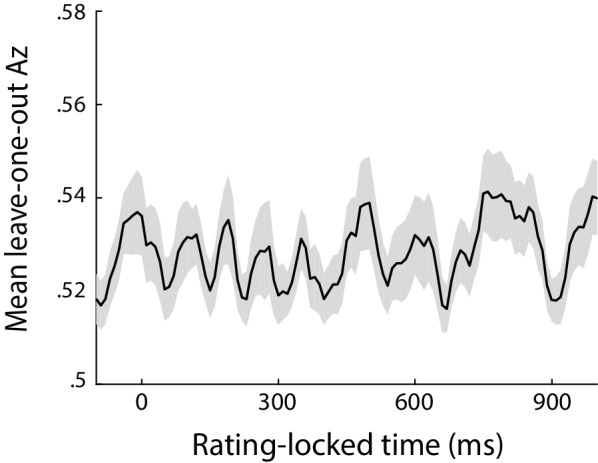
Figure 2—figure supplement 1. Classifier performance (Az) during High- vs Low-confidence discrimination, for data locked to the rating phase of the trial (defined as the onset of the rating prompt). EEG signals during this time window are likely to be heavily contaminated by rating-related motor responses (due to field spread), thus precluding reliable characterisation of confidence representations. Accordingly, poor confidence discrimination can be observed during this stage of the trial.
Figure 2—figure supplement 1. Classifier performance (Az) during High- vs Low-confidence discrimination, for data locked to the rating phase of the trial (defined as the onset of the rating prompt). EEG signals during this time window are likely to be heavily contaminated by rating-related motor responses (due to field spread), thus precluding reliable characterisation of confidence representations. Accordingly, poor confidence discrimination can be observed during this stage of the trial.CC BY · PubMed Central
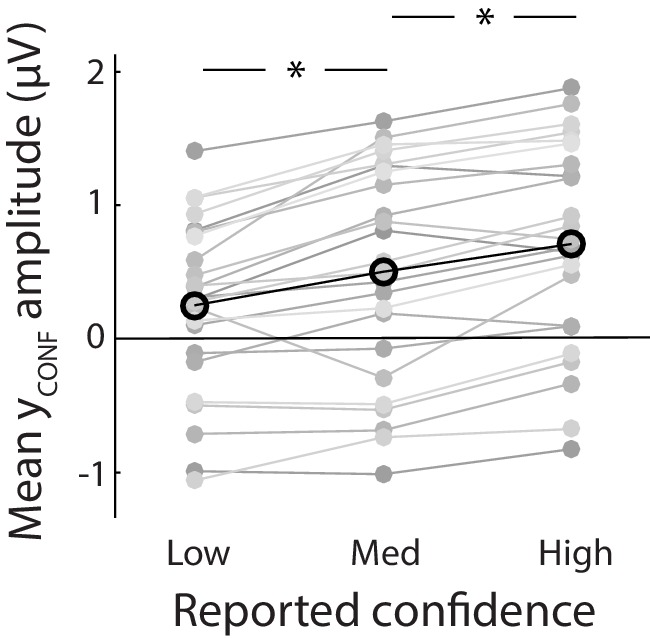
Figure 2—figure supplement 2. Mean amplitude of the confidence discriminant component showing parametric modulation by reported confidence. Importantly, component estimates illustrated here were obtained fully out of sample from a leave-one-out cross-validation procedure.
Figure 2—figure supplement 2. Mean amplitude of the confidence discriminant component showing parametric modulation by reported confidence. Importantly, component estimates illustrated here were obtained fully out of sample from a leave-one-out cross-validation procedure.CC BY · PubMed Central
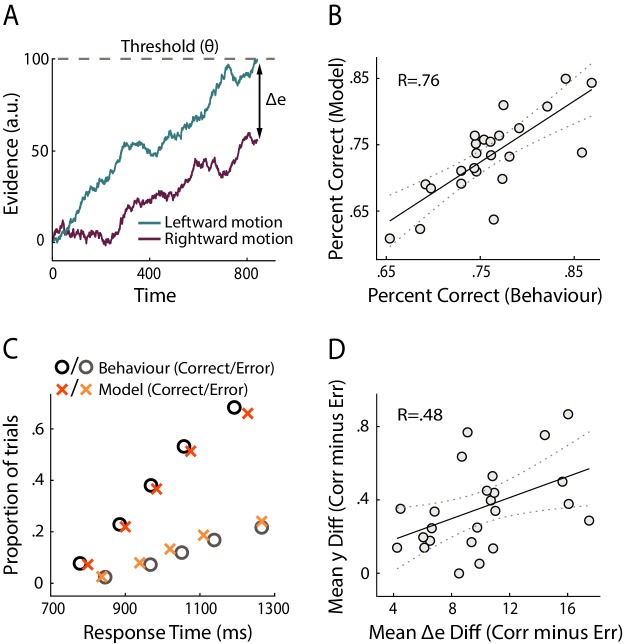
Figure 3. Modelling results. (A) Schematic representation of the decision model for one trial. Evidence in favour of the two choice alternatives (here, leftward and rightward motion) accumulates gradually over time. A decision is made when one of the accumulators reaches a decision threshold (θ). The model quantifies confidence as the absolute difference in the accumulated evidence for the two options, at the time of decision (Δe). (B) Correlation between behavioural vs. model-predicted choice accuracy. Each point represents trial-averaged data for one subject. (C) Behavioural (circles) and model-predicted (crosses) response time distribution. On the x axis from left to right, data points represent the RT below which 10%, 30%, 50%, 70% and 90% of the data, respectively, are situated. The y axis shows the associated proportion of data for correct (upper symbols) and incorrect (bottom symbols) responses. (D) Across-subject correlation between the model-predicted and neurally observed relationship of confidence with choice accuracy (quantified as the difference in confidence estimates between correct and error trials). Each dot represents data for one subject.
Figure 3. Modelling results. (A) Schematic representation of the decision model for one trial. Evidence in favour of the two choice alternatives (here, leftward and rightward motion) accumulates gradually over time. A decision is made when one of the accumulators reaches a decision threshold (θ). The model quantifies confidence as the absolute difference in the accumulated evidence for the two options, at the time of decision (Δe). (B) Correlation between behavioural vs. model-predicted choice accuracy. Each point represents trial-averaged data for one subject. (C) Behavioural (circles) and model-predicted (crosses) response time distribution. On the x axis from left to right, data points represent the RT below which 10%, 30%, 50%, 70% and 90% of the data, respectively, are situated. The y axis shows the associated proportion of data for correct (upper symbols) and incorrect (bottom symbols) responses. (D) Across-subject correlation between the model-predicted and neurally observed relationship of confidence with choice accuracy (quantified as the difference in confidence estimates between correct and error trials). Each dot represents data for one subject.CC BY · PubMed Central
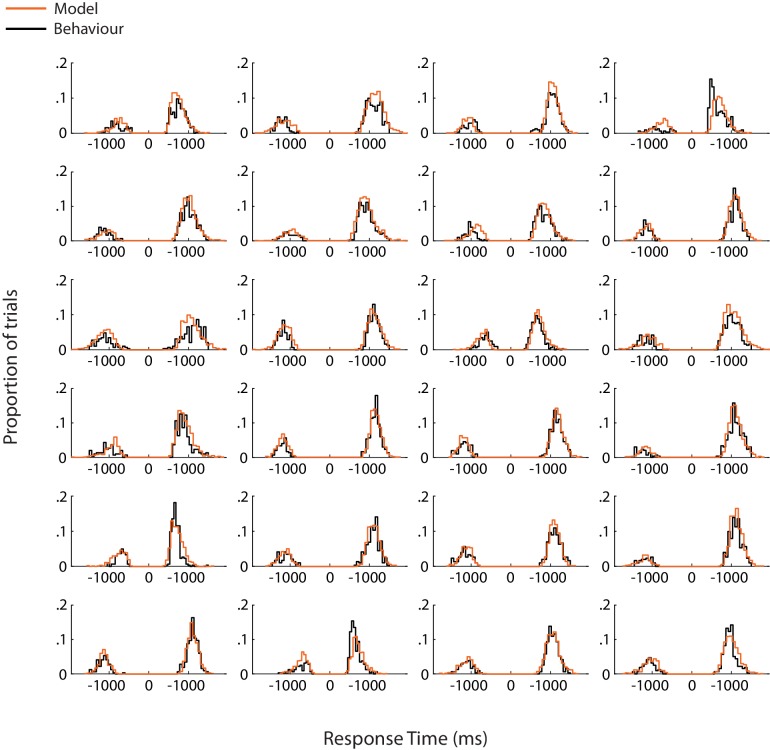
Figure 3—figure supplement 1. Model fits for individual subjects. Each panel shows response time distributions of model-predicted (orange) and actual (black) data, for correct and error responses. Response times for error trials have been mirrored onto the negative axis in order to combine them with those for correct trials in a single distribution.
Figure 3—figure supplement 1. Model fits for individual subjects. Each panel shows response time distributions of model-predicted (orange) and actual (black) data, for correct and error responses. Response times for error trials have been mirrored onto the negative axis in order to combine them with those for correct trials in a single distribution.CC BY · PubMed Central
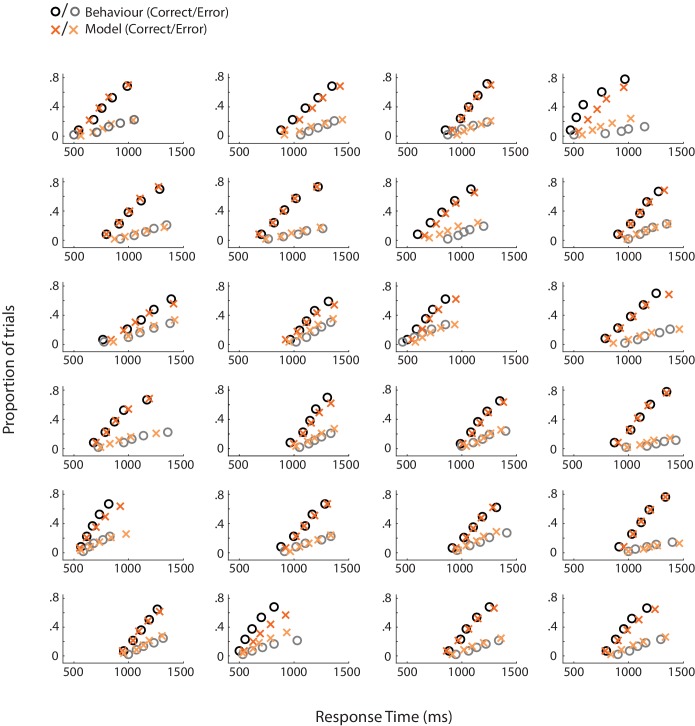
Figure 3—figure supplement 2. Behavioural (circles) and model-predicted (crosses) response time distribution for individual subjects. On the x axis from left to right, data points represent the RT below which 10%, 30%, 50%, 70% and 90% of the data, respectively, are situated. The y axis shows the associated proportion of data for correct (upper symbols) and incorrect (bottom symbols) responses.
Figure 3—figure supplement 2. Behavioural (circles) and model-predicted (crosses) response time distribution for individual subjects. On the x axis from left to right, data points represent the RT below which 10%, 30%, 50%, 70% and 90% of the data, respectively, are situated. The y axis shows the associated proportion of data for correct (upper symbols) and incorrect (bottom symbols) responses.CC BY · PubMed Central
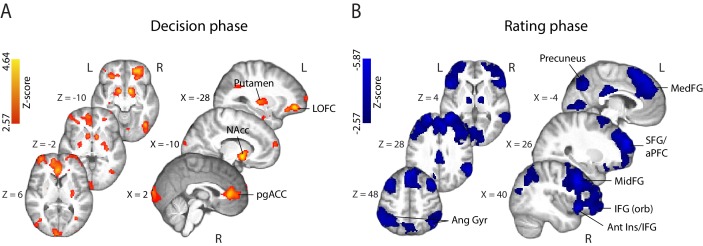
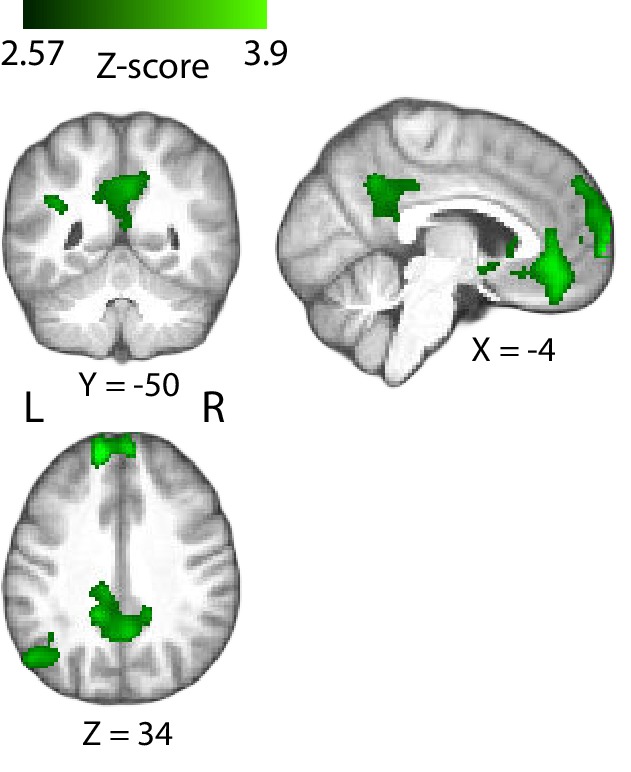
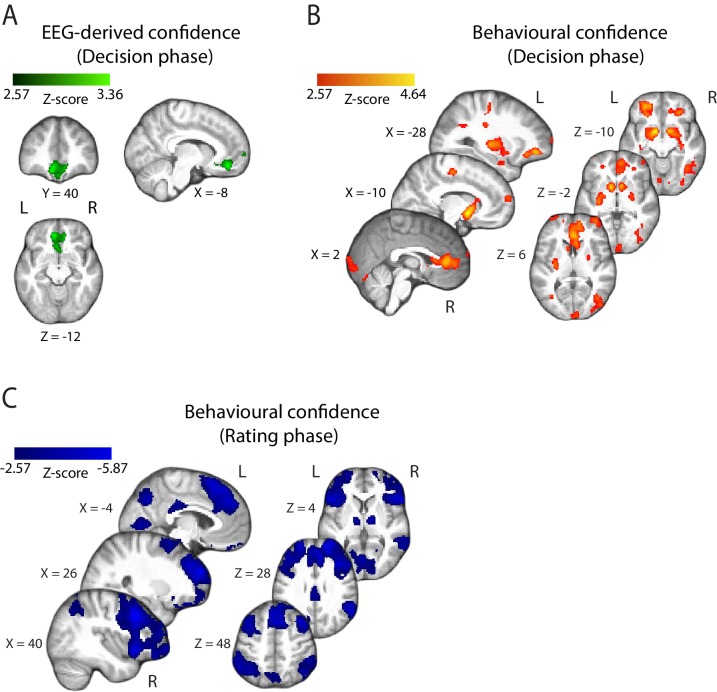
Figure 4. Parametric modulation of the BOLD signal by reported confidence. (A) Clusters showing positive correlation with confidence during the decision phase of the trial. (B) Clusters showing negative correlation with confidence at the onset of the rating cue (i.e., rating phase). All results are reported at |Z| ≥ 2.57, and cluster-corrected using a resampling procedure (minimum cluster size 162 voxels; see Materials and methods). Ang Gyr, angular gyrus; Ant Ins, anterior insula; IFG (orb), inferior frontal gyrus (orbital region); LOFC, lateral orbitofrontal cortex; MedFG, medial frontal gyrus; MidFG, middle frontal gyrus; NAcc, nucleus accumbens; pgACC, pregenual anterior cingulate cortex; RLPFC, rostrolateral prefrontal cortex; SFG, superior frontal gyrus. The complete lists of activations are shown in Supplementary Tables 1 and 2 (Supplementary file 1).
Figure 4. Parametric modulation of the BOLD signal by reported confidence. (A) Clusters showing positive correlation with confidence during the decision phase of the trial. (B) Clusters showing negative correlation with confidence at the onset of the rating cue (i.e., rating phase). All results are reported at |Z| ≥ 2.57, and cluster-corrected using a resampling procedure (minimum cluster size 162 voxels; see Materials and methods). Ang Gyr, angular gyrus; Ant Ins, anterior insula; IFG (orb), inferior frontal gyrus (orbital region); LOFC, lateral orbitofrontal cortex; MedFG, medial frontal gyrus; MidFG, middle frontal gyrus; NAcc, nucleus accumbens; pgACC, pregenual anterior cingulate cortex; RLPFC, rostrolateral prefrontal cortex; SFG, superior frontal gyrus. The complete lists of activations are shown in Supplementary Tables 1 and 2 (Supplementary file 1).CC BY · PubMed Central
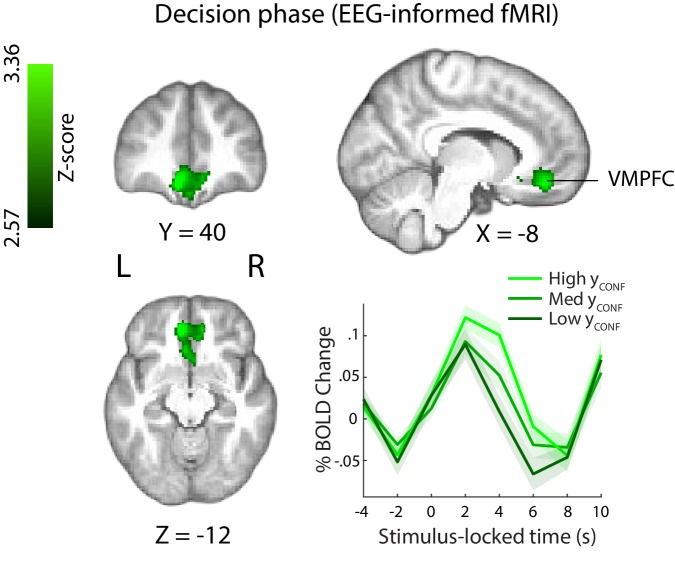
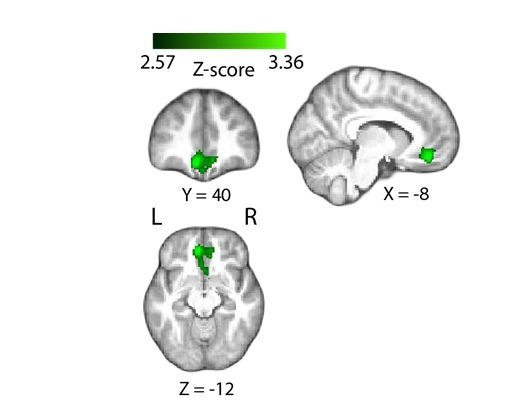
Figure 5. Positive parametric modulation of the BOLD signal by an EEG-derived single-trial confidence measure (see Materials and methods), during the decision phase of the trial. Results are reported at |Z|≥2.57, and cluster-corrected using a resampling procedure (minimum cluster size 162 voxels). Bottom right: Time course of VMPFC BOLD response, showing parametric modulation by neural confidence (presented for illustration purposes only). Trials are separated by the strength of confidence-discriminating component amplitudes (yCONF). VMPFC, ventromedial prefrontal cortex.
Figure 5. Positive parametric modulation of the BOLD signal by an EEG-derived single-trial confidence measure (see Materials and methods), during the decision phase of the trial. Results are reported at |Z|≥2.57, and cluster-corrected using a resampling procedure (minimum cluster size 162 voxels). Bottom right: Time course of VMPFC BOLD response, showing parametric modulation by neural confidence (presented for illustration purposes only). Trials are separated by the strength of confidence-discriminating component amplitudes (yCONF). VMPFC, ventromedial prefrontal cortex.CC BY · PubMed Central
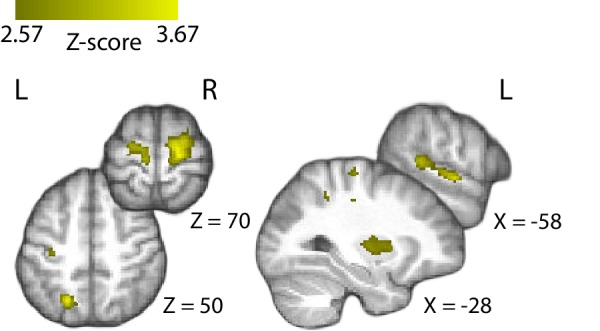
Figure 5—figure supplement 1. Positive correlation of the BOLD signal with the EEG-derived confidence measures in the posterior cingulate cortex (PCC), during the decision phase of the trial. Note that for this GLM model, we excluded the regressor parametrically modulated by behavioural confidence at the time of decision (‘RatingsDEC’, see Materials and methods). Accordingly, the PCC clusters observed here (which did not show significant correlation with the EEG-derived measures of confidence in the original GLM analysis) likely reflect variability common to the behavioural and EEG-derived measures of confidence. Results are reported at |Z| ≥ 2.57, and cluster-corrected using a resampling procedure (minimum cluster size 162 voxels).
Figure 5—figure supplement 1. Positive correlation of the BOLD signal with the EEG-derived confidence measures in the posterior cingulate cortex (PCC), during the decision phase of the trial. Note that for this GLM model, we excluded the regressor parametrically modulated by behavioural confidence at the time of decision (‘RatingsDEC’, see Materials and methods). Accordingly, the PCC clusters observed here (which did not show significant correlation with the EEG-derived measures of confidence in the original GLM analysis) likely reflect variability common to the behavioural and EEG-derived measures of confidence. Results are reported at |Z| ≥ 2.57, and cluster-corrected using a resampling procedure (minimum cluster size 162 voxels).CC BY · PubMed Central
Figure 5—figure supplement 2. Positive parametric modulation of the BOLD signal by EEG-derived confidence at the confidence rating stage. Results are reported at |Z| ≥ 2.57, and cluster-corrected using a resampling procedure (minimum cluster size 162 voxels).
Figure 5—figure supplement 2. Positive parametric modulation of the BOLD signal by EEG-derived confidence at the confidence rating stage. Results are reported at |Z| ≥ 2.57, and cluster-corrected using a resampling procedure (minimum cluster size 162 voxels).CC BY · PubMed Central
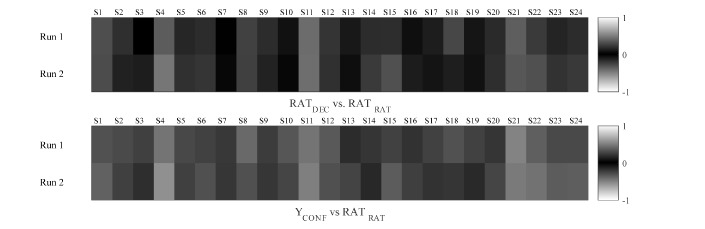
Figure 5—figure supplement 3. Correlations between HRF-convolved regressors locked to stimulus (i.e., decision phase) and confidence rating prompt (i.e., rating phase). Colour scheme represents correlation coefficients in the same convention as in the FSL covariance matrices, ranging from 0 (shown in black) to 1/–1 (shown in white).
Figure 5—figure supplement 3. Correlations between HRF-convolved regressors locked to stimulus (i.e., decision phase) and confidence rating prompt (i.e., rating phase). Colour scheme represents correlation coefficients in the same convention as in the FSL covariance matrices, ranging from 0 (shown in black) to 1/–1 (shown in white).CC BY · PubMed Central
Figure 5—figure supplement 4. Parametric modulation of the BOLD signal by confidence, resulting from two GLM analyses whereby events pertaining to the decision and rating phases of the trial, respectively, were modelled separately. Importantly, correlations with EEG-derived measures of confidence (A) and behavioural confidence reports (B and C) remained largely identical to those observed with our original GLM model which included predictors for both stages of the trial (see Figure 4 and Figure 5 for comparison). Results are reported at |Z| ≥ 2.57, and cluster-corrected using a resampling procedure (minimum cluster size 162 voxels).
Figure 5—figure supplement 4. Parametric modulation of the BOLD signal by confidence, resulting from two GLM analyses whereby events pertaining to the decision and rating phases of the trial, respectively, were modelled separately. Importantly, correlations with EEG-derived measures of confidence (A) and behavioural confidence reports (B and C) remained largely identical to those observed with our original GLM model which included predictors for both stages of the trial (see Figure 4 and Figure 5 for comparison). Results are reported at |Z| ≥ 2.57, and cluster-corrected using a resampling procedure (minimum cluster size 162 voxels).CC BY · PubMed Central
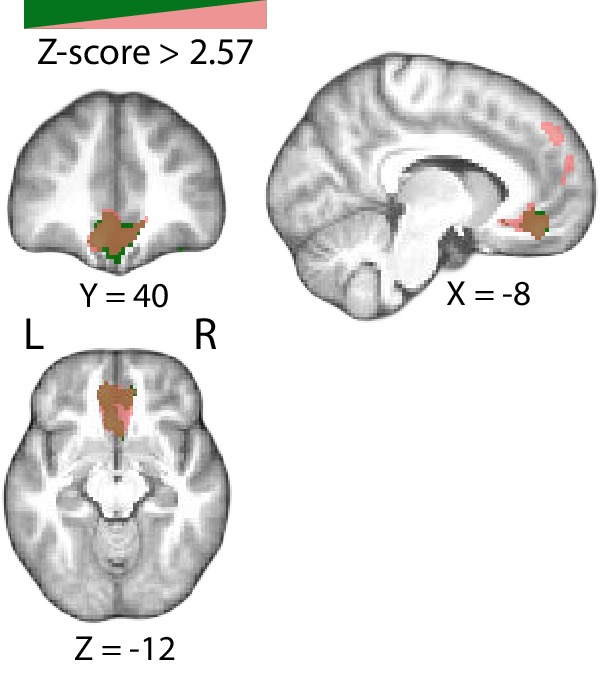
Figure 5—figure supplement 5. Positive parametric modulation of the BOLD signal by EEG-derived measures of confidence resulting from a leave-one-trial-out cross validation procedure (shown in pink). Our results remain unchanged relative to those observed with the original GLM analysis (shown in green). Results are reported at |Z| ≥ 2.57, and cluster-corrected using a resampling procedure (minimum cluster size 162 voxels).
Figure 5—figure supplement 5. Positive parametric modulation of the BOLD signal by EEG-derived measures of confidence resulting from a leave-one-trial-out cross validation procedure (shown in pink). Our results remain unchanged relative to those observed with the original GLM analysis (shown in green). Results are reported at |Z| ≥ 2.57, and cluster-corrected using a resampling procedure (minimum cluster size 162 voxels).CC BY · PubMed Central
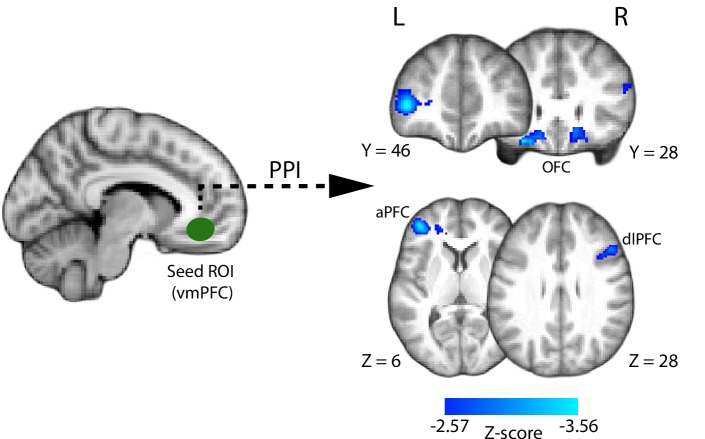
Figure 6. Psychophysiological interaction (PPI) analysis showing functional connectivity with the ventromedial prefrontal cortex (i.e., the seed region of interest; approximate location shown in green) during the perceptual decision phase of the trial. Clusters in the anterior and dorsolateral prefrontal cortices, as well as the orbitofrontal cortex (shown in blue), show increased negative correlation with the VMPFC during the perceptual decision. All results are reported at |Z| ≥ 2.57, and cluster-corrected using a resampling procedure (minimum cluster size 162 voxels).
Figure 6. Psychophysiological interaction (PPI) analysis showing functional connectivity with the ventromedial prefrontal cortex (i.e., the seed region of interest; approximate location shown in green) during the perceptual decision phase of the trial. Clusters in the anterior and dorsolateral prefrontal cortices, as well as the orbitofrontal cortex (shown in blue), show increased negative correlation with the VMPFC during the perceptual decision. All results are reported at |Z| ≥ 2.57, and cluster-corrected using a resampling procedure (minimum cluster size 162 voxels).CC BY · PubMed Central
Author response image 1.
Author response image 1. CC BY · PubMed Central

Verification

Claims the paper makes

The claims and statistics of this paper haven’t been checked yet.

Run the check — free, no account needed. It reads the open-access text and checks the sources it cites.

A few free checks a day · papers already verified open instantly · results are public

Claims other papers make about this one

Each is checked against this paper’s own text: does it say what the citing paper says it does?

Self-check

Percentages, sums and reported differences re-computed from the paper’s own numbers.

The self-check needs the paper’s full text.

Citations

Cites

Show all 100 references

Research works printed but not linked: 1

  1. Duda, 2001, Pattern Classification

Cited by

Sorted by citations

See all 107

Metadata

Authors
Gherman, S., & Philiastides, M. G.
Affiliations
University of Glasgow (GB)
Corresponding author
Philiastides, Marios G.
Venue
eLife
Published
2018-09-24
Volume
7
ISSN
2050-084X (ISSN-L)
OpenAlex
W2952945985
Cited by
107
References
100
Citations by year
2026: 10 · 2025: 12 · 2024: 15 · 2023: 12 · 2022: 19 · 2021: 15 · 2020: 14 · 2019: 5 · 2018: 5
FWCI
5.81
Type
journal article
Language
en
Open access
Locations
  • eLife (publishedVersion, cc-by)
  • Europe PMC (PubMed Central) (publishedVersion, cc-by)
  • PubMed Central (publishedVersion, cc-by)
  • PubMed (publishedVersion)
  • DOAJ (DOAJ: Directory of Open Access Journals) (submittedVersion, cc-by-sa)
Funders
  • Economic and Social Research Council (ES/L012995/1)
  • British Academy (SG121587)
Topics
  • Life Sciences › Neuroscience › Cognitive Neuroscience › Neural and Behavioral Psychology Studies
  • Life Sciences › Neuroscience › Cognitive Neuroscience › Visual perception and processing mechanisms
  • Life Sciences › Neuroscience › Cognitive Neuroscience › Neural dynamics and brain function
Keywords
decision confidence, perceptual decision making, ventromedial prefrontal cortex, metacognition, EEG-fMRI, direction discrimination, trial-to-trial variability, frontal cortex
MeSH terms
Metacognition, Adult, Decision Making, Electroencephalography, Humans, Magnetic Resonance Imaging, Self Concept, Prefrontal Cortex, Young Adult

About these checks

Registry, retraction, Cites and statistics results are computed, not judged, with one exception: a printed reference that no index lists is read once by a model before it counts as a citation error. Claims are extracted by a model and kept only when their quote appears verbatim in the text; each cited source is then checked, with a model’s help, for whether it says what the claim relies on. Those verdicts can be wrong — read the claim’s quote and the cited source before relying on one.

Statistics and arithmetic are recomputed, not judged.

Confidence bands are shown only for fields calibrated on our annotated test set. None is calibrated yet, so no band is shown.

What counts as a claim ›How we measure confidence ›How we check this ›

Are you an author, or do you see a problem with this page? Request a review