Cited by 49

The DOI matches its Crossref record.

A CLC-ec1 mutant reveals global conformational change and suggests a unifying mechanism for the CLC Cl–/H+ transport cycle

Chavan, Tanmay S, Cheng, Ricky C, Jiang, Tao, Mathews, Irimpan I, Stein, Richard A, Koehl, Antoine, Mchaourab, Hassane S, Tajkhorshid, Emad, Maduke, Merritt·2020·eLife

Published version of a preprint

Abstract

Among coupled exchangers, CLCs uniquely catalyze the exchange of oppositely charged ions (Cl– for H+). Transport-cycle models to describe and explain this unusual mechanism have been proposed based on known CLC structures. While the proposed models harmonize with many experimental findings, gaps and inconsistencies in our understanding have remained. One limitation has been that global conformational change – which occurs in all conventional transporter mechanisms – has not been observed in any high-resolution structure. Here, we describe the 2.6 Å structure of a CLC mutant designed to mimic the fully H+-loaded transporter. This structure reveals a global conformational change to improve accessibility for the Cl– substrate from the extracellular side and new conformations for two key glutamate residues. Together with DEER measurements, MD simulations, and functional studies, this new structure provides evidence for a unified model of H+/Cl– transport that reconciles existing data on all CLC-type proteins.

Overview

The claims and statistics of this paper haven’t been checked yet.

Run the check — free, no account needed. It reads the open-access text and checks the sources it cites.

A few free checks a day · papers already verified open instantly · results are public

Integrity signals

Registry

Crossref · 10.7554/elife.53479

Cites

Statistics

Figures
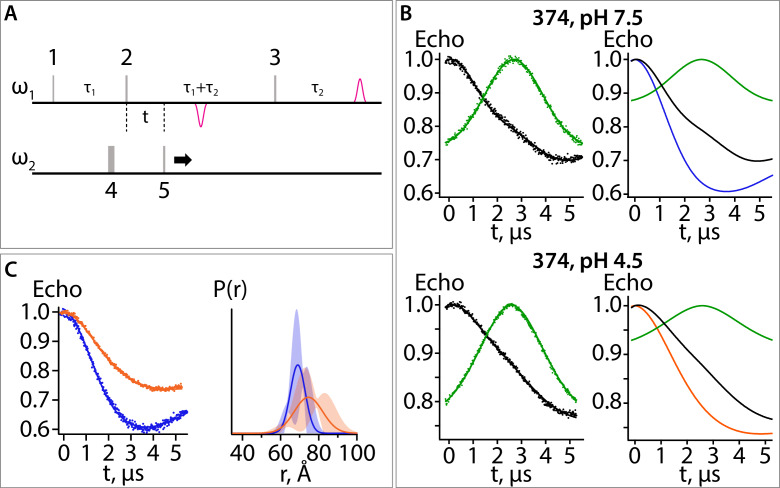
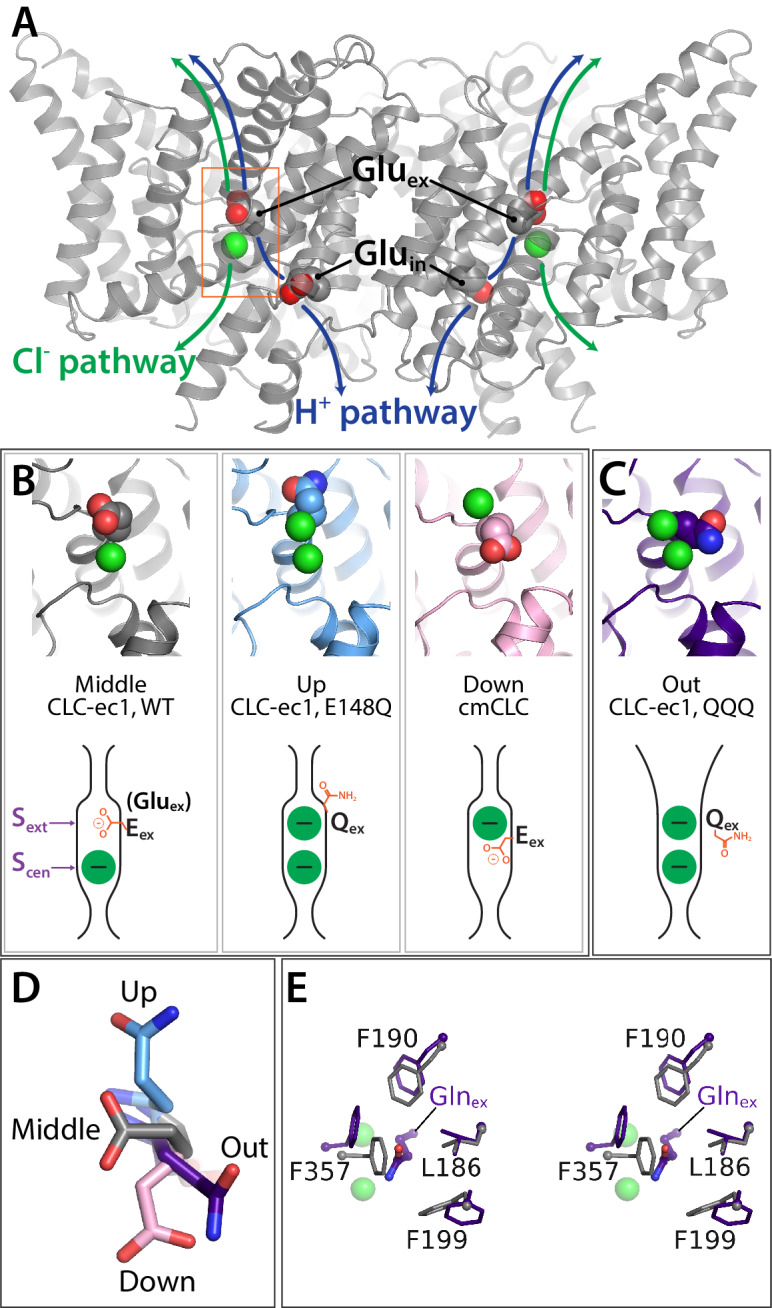
Figure 1. Key glutamate residues in CLC transporters. (A) CLC-ec1 wild-type structure (PDB 1ots) showing the external and internal glutamate residues (Gluex and Gluin) in the two subunits of the homodimer. Chloride ions are shown as green spheres. Each subunit independently catalyzes Cl–/H+ exchange. The approximate transport pathways for these ions are indicated with green and blue arrows. The orange box frames the close-up view (shown in panel B) of the Cl–-binding sites along with Gluex. (B) Gluex conformations observed in CLC transporters. Three panels showing structures (top panels) and cartoon representations (bottom panels) depicting the three conformations (‘middle’, ‘up’, and ‘down’) adopted by Gluex in various CLC structures, WT (1ots), E148Q (1otu), and cmCLC (3org). The Sext and Scen anion-binding sites are labeled in the WT cartoon at left. (C) QQQ structure reveals a new conformation for Gluex. Structure and cartoon representations as in panel B. (D) Overlay of Gluex/Glnex conformations seen in QQQ (purple), E148Q (blue), WT (grey) and cmCLC (pink). (E) Overlays (stereoview) of WT (grey) and QQQ (purple) illustrate changes in positioning of conserved residues near Gluex.
Figure 1. Key glutamate residues in CLC transporters. (A) CLC-ec1 wild-type structure (PDB 1ots) showing the external and internal glutamate residues (Gluex and Gluin) in the two subunits of the homodimer. Chloride ions are shown as green spheres. Each subunit independently catalyzes Cl–/H+ exchange. The approximate transport pathways for these ions are indicated with green and blue arrows. The orange box frames the close-up view (shown in panel B) of the Cl–-binding sites along with Gluex. (B) Gluex conformations observed in CLC transporters. Three panels showing structures (top panels) and cartoon representations (bottom panels) depicting the three conformations (‘middle’, ‘up’, and ‘down’) adopted by Gluex in various CLC structures, WT (1ots), E148Q (1otu), and cmCLC (3org). The Sext and Scen anion-binding sites are labeled in the WT cartoon at left. (C) QQQ structure reveals a new conformation for Gluex. Structure and cartoon representations as in panel B. (D) Overlay of Gluex/Glnex conformations seen in QQQ (purple), E148Q (blue), WT (grey) and cmCLC (pink). (E) Overlays (stereoview) of WT (grey) and QQQ (purple) illustrate changes in positioning of conserved residues near Gluex.CC BY · PubMed Central
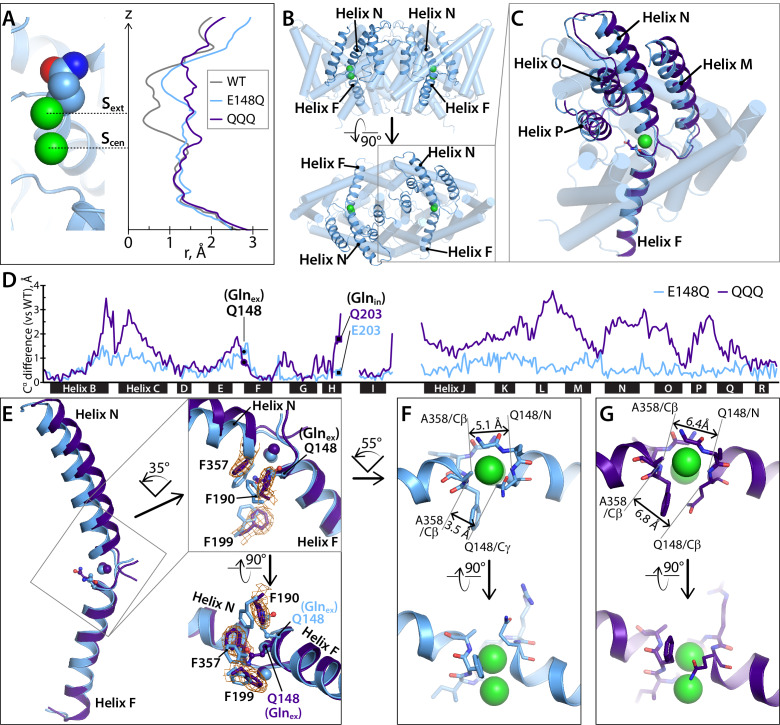
Figure 2. Helices M-N-O-P move to widen the extracellular vestibule. (A) Comparison of pore radius profiles of CLC-ec1 with Gluex in the ‘middle’ (WT), ‘up’ (E148Q), and ‘out’ (QQQ) positions. The pore-radius profile, calculated using HOLE, is aligned with the structure at left (E148Q) to indicate the position of the Sext and Scen anion-binding sites. (B) Two views of the CLC-ec1 E148Q structure, with ribbons highlighting helices M-N-O-P (helices located in the extracellular half of the protein) and F (located in the intracellular half). (C) Overlay of the CLC-ec1 QQQ structure (purple) with E148Q (blue) following structural alignment using segments of helices B, F, G, and I (residues 35–47, 153–164, 174–190, and 215–223). (D) Plot of the differences in Cα positions between WT CLC-ec1 and QQQ (purple) or between WT and E148Q (blue), based on the B-F-G-I structural alignment. The black bars indicate 17 of the 18 alpha helices. (Density for Helix A is absent in QQQ.) The locations of Glnex and Glnin are marked as solid-black circles and squares, respectively. The differences in the H-I and I-J linkers are not shown here but are discussed below and in Figure 5—figure supplement 2. (E) Zoomed-in view of the structural overlay between CLC-ec1 QQQ and E148Q, showing changes in the positions of conserved residues F190, F199, and F357 and the corresponding electron density from the QQQ structure determination. Additional views are shown in Figure 2—figure supplement 1. (F, G) Illustration of interatom distances at the extracellular bottleneck that are increased in QQQ (G) compared to E148Q (F). Comparisons of Cl– coordination distances are shown in Figure 2—figure supplement 2.
Figure 2. Helices M-N-O-P move to widen the extracellular vestibule. (A) Comparison of pore radius profiles of CLC-ec1 with Gluex in the ‘middle’ (WT), ‘up’ (E148Q), and ‘out’ (QQQ) positions. The pore-radius profile, calculated using HOLE, is aligned with the structure at left (E148Q) to indicate the position of the Sext and Scen anion-binding sites. (B) Two views of the CLC-ec1 E148Q structure, with ribbons highlighting helices M-N-O-P (helices located in the extracellular half of the protein) and F (located in the intracellular half). (C) Overlay of the CLC-ec1 QQQ structure (purple) with E148Q (blue) following structural alignment using segments of helices B, F, G, and I (residues 35–47, 153–164, 174–190, and 215–223). (D) Plot of the differences in Cα positions between WT CLC-ec1 and QQQ (purple) or between WT and E148Q (blue), based on the B-F-G-I structural alignment. The black bars indicate 17 of the 18 alpha helices. (Density for Helix A is absent in QQQ.) The locations of Glnex and Glnin are marked as solid-black circles and squares, respectively. The differences in the H-I and I-J linkers are not shown here but are discussed below and in Figure 5—figure supplement 2. (E) Zoomed-in view of the structural overlay between CLC-ec1 QQQ and E148Q, showing changes in the positions of conserved residues F190, F199, and F357 and the corresponding electron density from the QQQ structure determination. Additional views are shown in Figure 2—figure supplement 1. (F, G) Illustration of interatom distances at the extracellular bottleneck that are increased in QQQ (G) compared to E148Q (F). Comparisons of Cl– coordination distances are shown in Figure 2—figure supplement 2.CC BY · PubMed Central
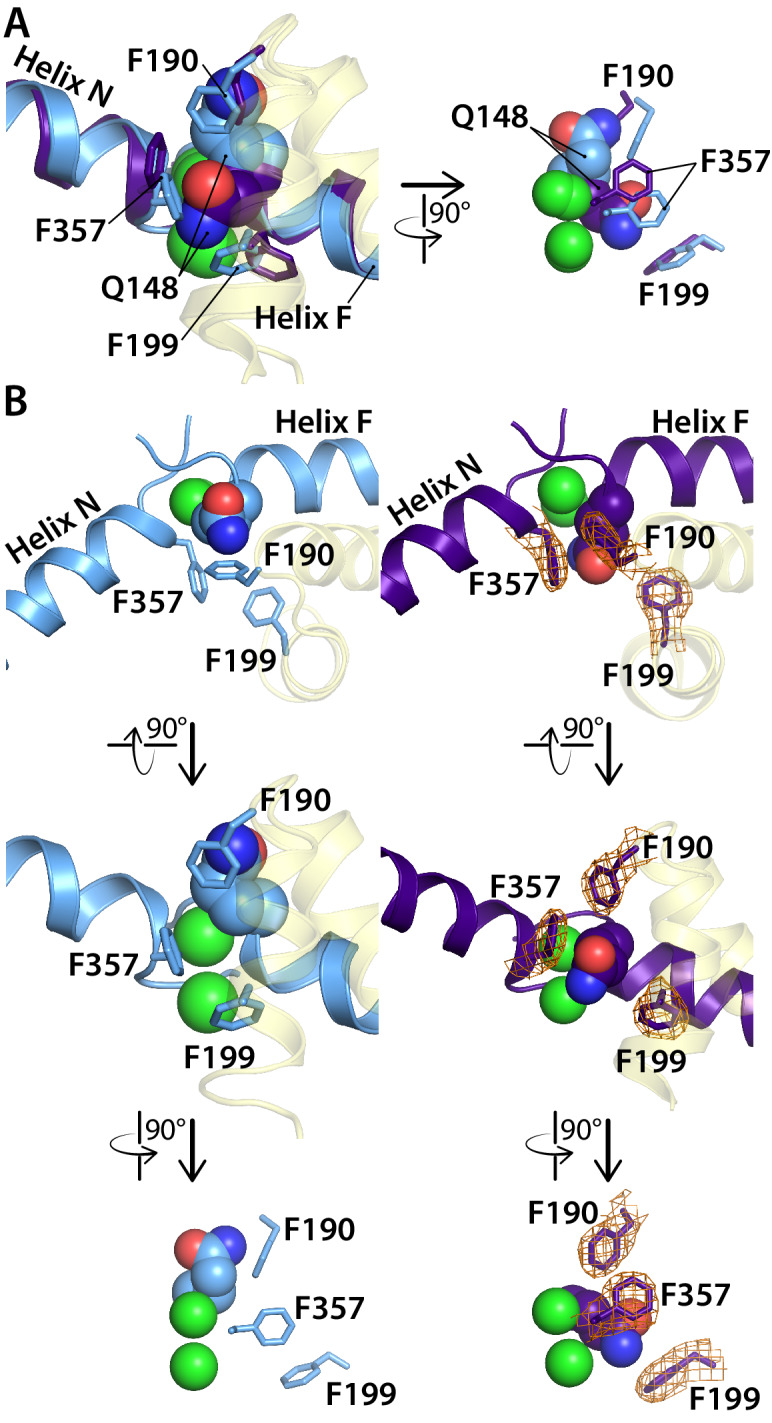
Figure 2—figure supplement 1. Comparison of the CLC-ec1 QQQ structure to the E148Q (Gluex to Gln) structure in the vicinity of the Sext binding site. (A) Overlay of E148Q (blue) and QQQ (purple). Conserved residues F190, F199, and F357 are shown as sticks. (B) Side-by-side comparison of E148Q (left) and QQQ (right), with electron density shown (2Fo-Fc map at 1σ contour level) in QQQ for the repositioned residues F190, F199, and F357.
Figure 2—figure supplement 1. Comparison of the CLC-ec1 QQQ structure to the E148Q (Gluex to Gln) structure in the vicinity of the Sext binding site. (A) Overlay of E148Q (blue) and QQQ (purple). Conserved residues F190, F199, and F357 are shown as sticks. (B) Side-by-side comparison of E148Q (left) and QQQ (right), with electron density shown (2Fo-Fc map at 1σ contour level) in QQQ for the repositioned residues F190, F199, and F357.CC BY · PubMed Central
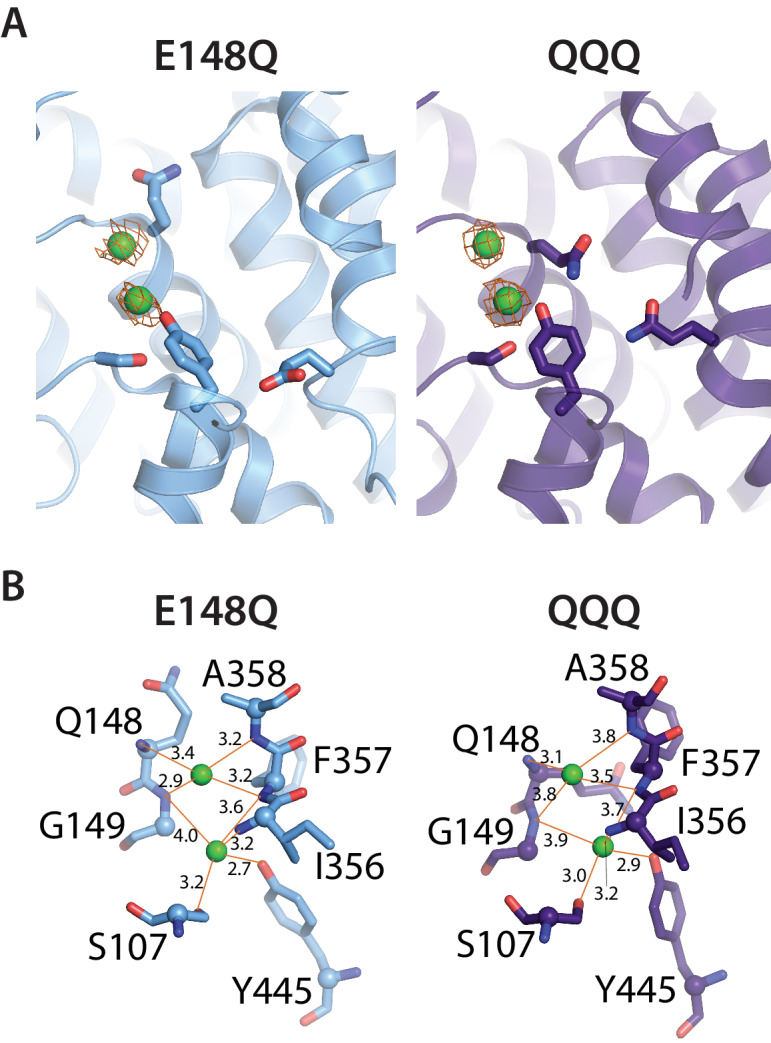
Figure 2—figure supplement 2. Cl– binding sites in QQQ CLC-ec1. (A) 2Fo-Fc maps (1σ contour level) for QQQ and E148Q show electron density consistent with Cl– binding to both the Scen and Sext sites. (B) Close-up views of the Sext site in E148Q and QQQ, illustrating the increased protein/Cl–coordination distances in the QQQ mutant. The coordination distances at the Scen site are identical between E148Q and QQQ.
Figure 2—figure supplement 2. Cl– binding sites in QQQ CLC-ec1. (A) 2Fo-Fc maps (1σ contour level) for QQQ and E148Q show electron density consistent with Cl– binding to both the Scen and Sext sites. (B) Close-up views of the Sext site in E148Q and QQQ, illustrating the increased protein/Cl–coordination distances in the QQQ mutant. The coordination distances at the Scen site are identical between E148Q and QQQ.CC BY · PubMed Central
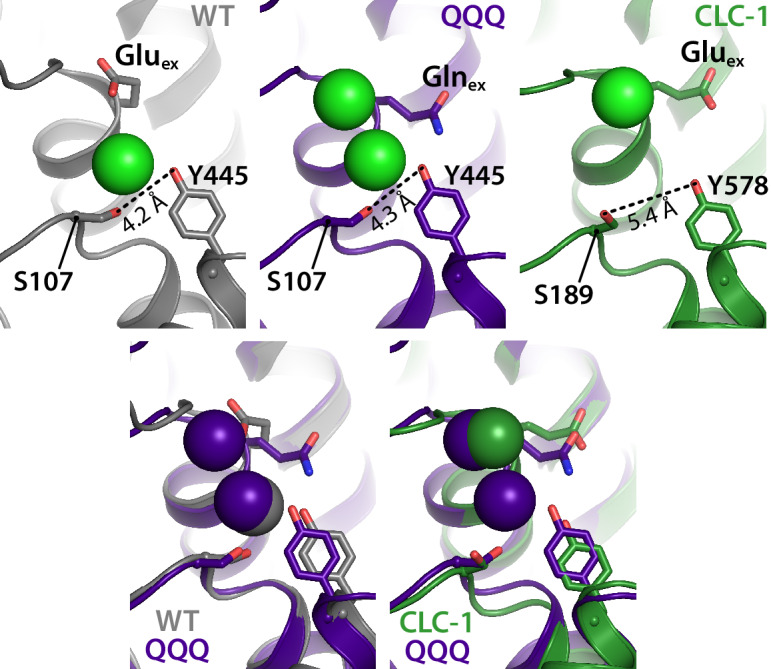
Figure 3. The intracellular constriction remains narrow in QQQ. The inter-residue distance between S107 and Y445, conserved residues forming the intracellular constriction, is similar in WT and QQQ (grey and purple in top left panels and overlay below). The equivalent positions in the CLC-1 channel (green, top right panel) are separated by a greater distance, despite the similarity in Gluex conformation between CLC-1 and QQQ (overlay in bottom right panel).
Figure 3. The intracellular constriction remains narrow in QQQ. The inter-residue distance between S107 and Y445, conserved residues forming the intracellular constriction, is similar in WT and QQQ (grey and purple in top left panels and overlay below). The equivalent positions in the CLC-1 channel (green, top right panel) are separated by a greater distance, despite the similarity in Gluex conformation between CLC-1 and QQQ (overlay in bottom right panel).CC BY · PubMed Central
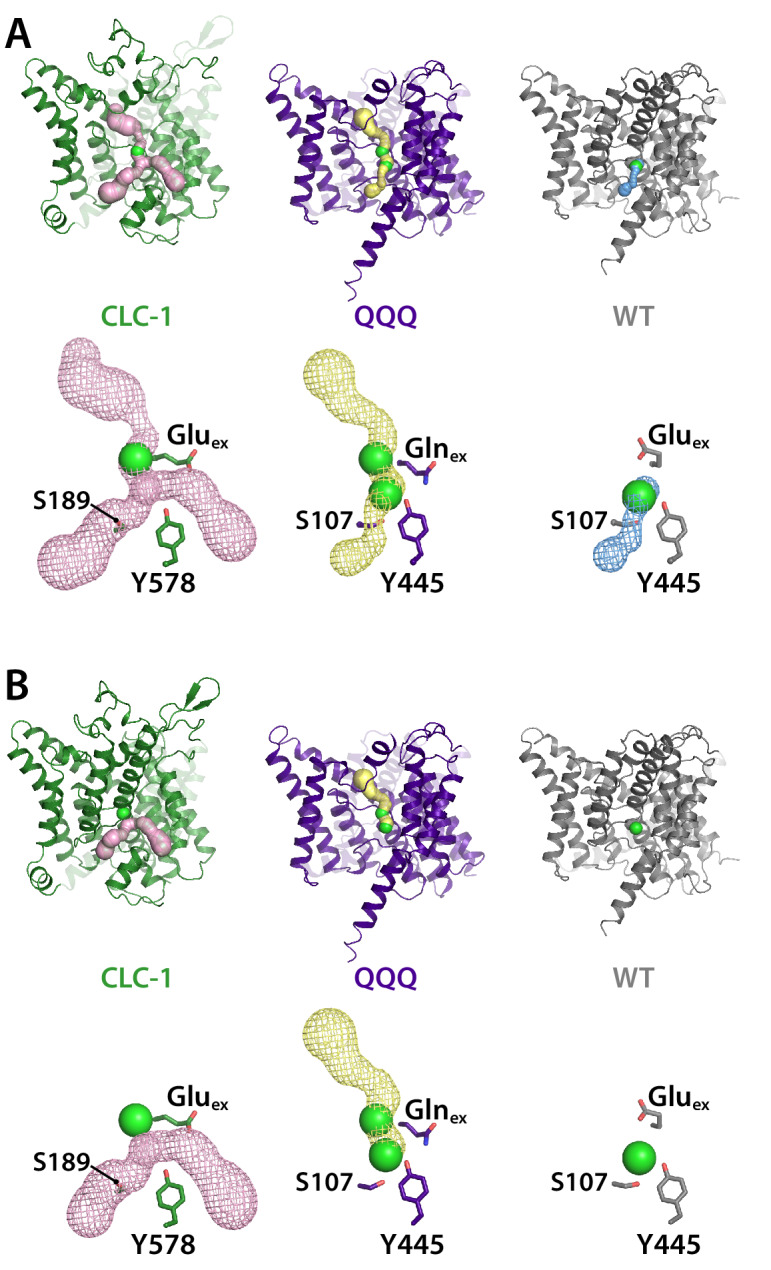
Figure 3—figure supplement 1. Pore profiles for CLC-1, QQQ, and WT CLC-ec1. Pores were detected using Caver (Chovancova et al., 2012) with probe radius 0.9 Å (A) or 1.2 Å (B), starting from Scen (defined by the Cl– ion in 1ots). The bottom panels in each section show mesh representations of the pores, with Gluex/Glnex and the intracellular Ser and Tyr residues shown in stick representation. Cl– ions at Sext (CLC-1 and QQQ) and Scen (QQQ and WT CLC-ec1) are shown space-filled.
Figure 3—figure supplement 1. Pore profiles for CLC-1, QQQ, and WT CLC-ec1. Pores were detected using Caver (Chovancova et al., 2012) with probe radius 0.9 Å (A) or 1.2 Å (B), starting from Scen (defined by the Cl– ion in 1ots). The bottom panels in each section show mesh representations of the pores, with Gluex/Glnex and the intracellular Ser and Tyr residues shown in stick representation. Cl– ions at Sext (CLC-1 and QQQ) and Scen (QQQ and WT CLC-ec1) are shown space-filled.CC BY · PubMed Central
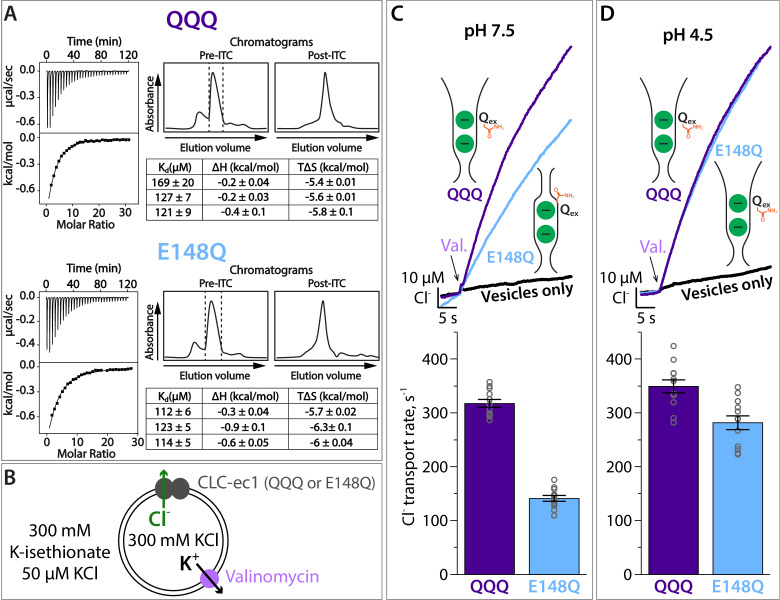
Figure 4. Cl– binding and transport by QQQ and E148Q CLC-ec1. (A) Cl– binding measured by ITC for QQQ (top panels) and E148Q (bottom panels), at pH 7.5. At left are shown representative data from ITC experiments. At right are shown representative size-exclusion chromatograms of samples before and after the ITC experiment (pre- and post-ITC chromatograms). The dotted line in the pre-ITC chromatogram represents the fraction that was collected for use in the ITC experiment. The sample was run again following the ITC experiment to confirm the sample was stable throughout the experiment. The summary tables show results for 3 experiments performed on 3 separate protein preparations. Averages (± SEM) for E148Q (Kd = 116 ± 6 µM) and QQQ (Kd, = 138 ± 26 µM) are not statistically different (p = 0.19). (B) Cartoon depiction of the Cl– flux assay. The Gluex mutants E148Q and QQQ catalyze downhill transport of Cl–. Bulk movement of Cl– is initiated by the addition of valinomycin, and extravesicular Cl– is quantified using a Ag·AgCl electrode. (C) At pH 7.5, Cl– transport through the CLC-ec1 QQQ mutant is ~2 fold faster compared to E148Q. The top panel shows representative primary data from the flux assay. The bar graph shows summary data, ± SEM, with n = 12 for each mutant (open circles, samples from 3 independent protein preparations). (D) At pH 4.5, favoring protonation of glutamate residues, Cl– transport through E148Q increases by 2-fold, to within 20% the Cl–-transport rates by QQQ. The bar graph shows summary data, ± SEM, with n = 12 for each mutant (open circles, samples from 3 independent preparations).
Figure 4. Cl– binding and transport by QQQ and E148Q CLC-ec1. (A) Cl– binding measured by ITC for QQQ (top panels) and E148Q (bottom panels), at pH 7.5. At left are shown representative data from ITC experiments. At right are shown representative size-exclusion chromatograms of samples before and after the ITC experiment (pre- and post-ITC chromatograms). The dotted line in the pre-ITC chromatogram represents the fraction that was collected for use in the ITC experiment. The sample was run again following the ITC experiment to confirm the sample was stable throughout the experiment. The summary tables show results for 3 experiments performed on 3 separate protein preparations. Averages (± SEM) for E148Q (Kd = 116 ± 6 µM) and QQQ (Kd, = 138 ± 26 µM) are not statistically different (p = 0.19). (B) Cartoon depiction of the Cl– flux assay. The Gluex mutants E148Q and QQQ catalyze downhill transport of Cl–. Bulk movement of Cl– is initiated by the addition of valinomycin, and extravesicular Cl– is quantified using a Ag·AgCl electrode. (C) At pH 7.5, Cl– transport through the CLC-ec1 QQQ mutant is ~2 fold faster compared to E148Q. The top panel shows representative primary data from the flux assay. The bar graph shows summary data, ± SEM, with n = 12 for each mutant (open circles, samples from 3 independent protein preparations). (D) At pH 4.5, favoring protonation of glutamate residues, Cl– transport through E148Q increases by 2-fold, to within 20% the Cl–-transport rates by QQQ. The bar graph shows summary data, ± SEM, with n = 12 for each mutant (open circles, samples from 3 independent preparations).CC BY · PubMed Central
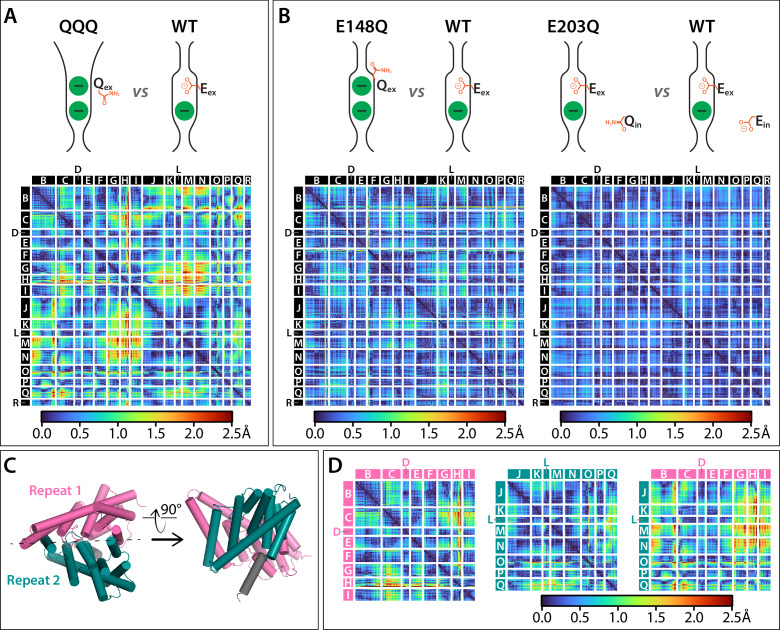
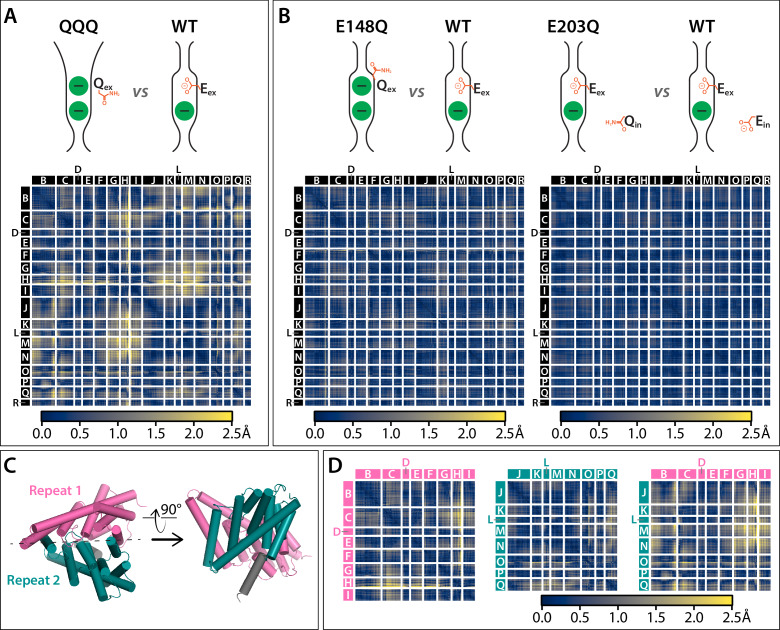
Figure 5. Cα difference distances matrices. Color-blind friendly versions of these plots are shown in Figure 5—figure supplement 1. Difference distance matrix comparing WT CLC-ec1 (1ots) to QQQ reveals intramolecular rearrangements throughout the protein. Differences are between Cα residues on helices; differences in linker regions are discussed in Figure 5—figure supplement 2. (B) Comparison of WT to E148Q (1otu) or E203Q (2fec) reveals only minor (≤0.8 Å) changes. (C) Illustration of inverted topology repeat domains in CLC-ec1. Repeat 1 (Helices B-I, pink) is arranged pseudosymmetrically with Repeat 2 (teal). Helix R (grey) is not part of the repeat domains. Helix A, the N-terminal cytoplasmic helix, is also not part of the repeats; it is not resolved in the QQQ structure and not shown here. (D) Changes occur both within and between the inverted topology repeat domains. Matrices are the same as in panel A, laid out to focus on comparing changes within each Repeat domain (left and middle panels) or between the Repeat domains (right panel). Helices G-I (Repeat 1) and J-N (Repeat 2) move substantially relative to one another, while the equivalent sets (O-Q in repeat 2 and B-F in repeat 1) undergo more modest relative changes.
Figure 5. Cα difference distances matrices. Color-blind friendly versions of these plots are shown in Figure 5—figure supplement 1. Difference distance matrix comparing WT CLC-ec1 (1ots) to QQQ reveals intramolecular rearrangements throughout the protein. Differences are between Cα residues on helices; differences in linker regions are discussed in Figure 5—figure supplement 2. (B) Comparison of WT to E148Q (1otu) or E203Q (2fec) reveals only minor (≤0.8 Å) changes. (C) Illustration of inverted topology repeat domains in CLC-ec1. Repeat 1 (Helices B-I, pink) is arranged pseudosymmetrically with Repeat 2 (teal). Helix R (grey) is not part of the repeat domains. Helix A, the N-terminal cytoplasmic helix, is also not part of the repeats; it is not resolved in the QQQ structure and not shown here. (D) Changes occur both within and between the inverted topology repeat domains. Matrices are the same as in panel A, laid out to focus on comparing changes within each Repeat domain (left and middle panels) or between the Repeat domains (right panel). Helices G-I (Repeat 1) and J-N (Repeat 2) move substantially relative to one another, while the equivalent sets (O-Q in repeat 2 and B-F in repeat 1) undergo more modest relative changes.CC BY · PubMed Central
Figure 5—figure supplement 1. Cα difference distances matrices with color-blind friendly color palette. (A) Difference distance matrix comparing WT CLC-ec1 (1ots) to QQQ reveals intramolecular rearrangements throughout the protein. (B) Comparison of WT to E148Q (1otu) or E203Q (2fec) reveals only minor (≤0.8 Å) changes. (C) Illustration of inverted topology repeat domains in CLC-ec1. Repeat 1 (Helices B-I, pink) is arranged pseudosymmetrically with repeat 2 (teal). Helix R (grey) is not part of the repeat domains. Helix A, the N-terminal cytoplasmic helix, is not resolved in the QQQ structure and not shown here. (D) Changes occur both within and between the inverted topology repeat domains. Helices G-I (repeat 1) and J-N (repeat 2) move substantially relative to one another, while the equivalent sets (O-Q in repeat 2 and B-F in repeat 1) undergo more modest relative changes.
Figure 5—figure supplement 1. Cα difference distances matrices with color-blind friendly color palette. (A) Difference distance matrix comparing WT CLC-ec1 (1ots) to QQQ reveals intramolecular rearrangements throughout the protein. (B) Comparison of WT to E148Q (1otu) or E203Q (2fec) reveals only minor (≤0.8 Å) changes. (C) Illustration of inverted topology repeat domains in CLC-ec1. Repeat 1 (Helices B-I, pink) is arranged pseudosymmetrically with repeat 2 (teal). Helix R (grey) is not part of the repeat domains. Helix A, the N-terminal cytoplasmic helix, is not resolved in the QQQ structure and not shown here. (D) Changes occur both within and between the inverted topology repeat domains. Helices G-I (repeat 1) and J-N (repeat 2) move substantially relative to one another, while the equivalent sets (O-Q in repeat 2 and B-F in repeat 1) undergo more modest relative changes.CC BY · PubMed Central
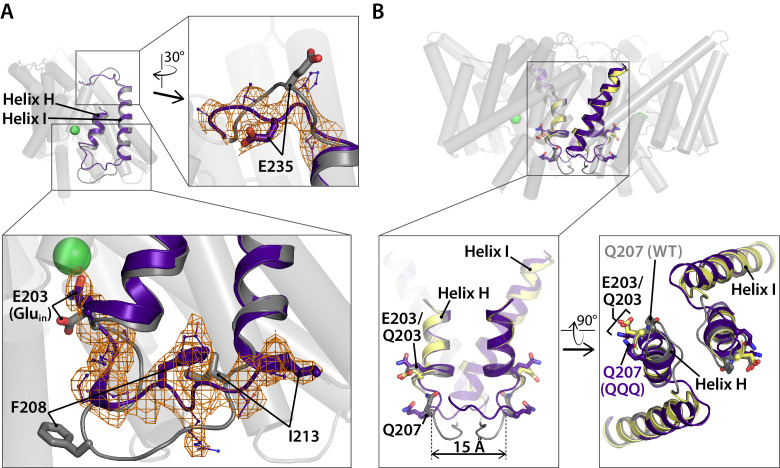
Figure 5—figure supplement 2. Linker rearrangements in the QQQ structure are observed at the extracellular I-J linker and the intracellular H-I linker. (A) Structural overlay of WT CLC-ec1 (1ots) and QQQ. The WT structure (one subunit) is shown in grey. Overlaid in purple is the structure of QQQ from residues 203 to 237, encompassing Helices H and I in addition to the H-I and I-J linkers. Expanded views show electron density for the I-J and H-I linkers. The I-J linker interacts with the Fab fragment in other structures, whereas no Fab fragment was used in determination of the QQQ structure. The relatively large movement of the H-I linker (residues 205–213) is consistent with known flexibility of this linker. Previously, it was shown that an inter-subunit cross-link at Q207C forms readily even though the residues are separated by ~15 Å across the dimer interface (Nguitragool and Miller, 2007). Movement of the H-I linker is not of functional significance, as the cross-link has no effect on transport activity (Nguitragool and Miller, 2007). (B) Views of the H-I linker in the context of the previous cross-linking results. In WT (grey) and QQQ (purple), residues Q207 on the two subunits are separated by 15 Å. In the Q207C structure (yellow, PDB 2r9h), in which the Q207C residues are cross-linked, the H-I linker is not visible, and thus the exact positioning of the disulfide bond is uncertain; however, the overall transporter structure (including E203, Gluin) is unaffected by the cross-link (Nguitragool and Miller, 2007).
Figure 5—figure supplement 2. Linker rearrangements in the QQQ structure are observed at the extracellular I-J linker and the intracellular H-I linker. (A) Structural overlay of WT CLC-ec1 (1ots) and QQQ. The WT structure (one subunit) is shown in grey. Overlaid in purple is the structure of QQQ from residues 203 to 237, encompassing Helices H and I in addition to the H-I and I-J linkers. Expanded views show electron density for the I-J and H-I linkers. The I-J linker interacts with the Fab fragment in other structures, whereas no Fab fragment was used in determination of the QQQ structure. The relatively large movement of the H-I linker (residues 205–213) is consistent with known flexibility of this linker. Previously, it was shown that an inter-subunit cross-link at Q207C forms readily even though the residues are separated by ~15 Å across the dimer interface (Nguitragool and Miller, 2007). Movement of the H-I linker is not of functional significance, as the cross-link has no effect on transport activity (Nguitragool and Miller, 2007). (B) Views of the H-I linker in the context of the previous cross-linking results. In WT (grey) and QQQ (purple), residues Q207 on the two subunits are separated by 15 Å. In the Q207C structure (yellow, PDB 2r9h), in which the Q207C residues are cross-linked, the H-I linker is not visible, and thus the exact positioning of the disulfide bond is uncertain; however, the overall transporter structure (including E203, Gluin) is unaffected by the cross-link (Nguitragool and Miller, 2007).CC BY · PubMed Central
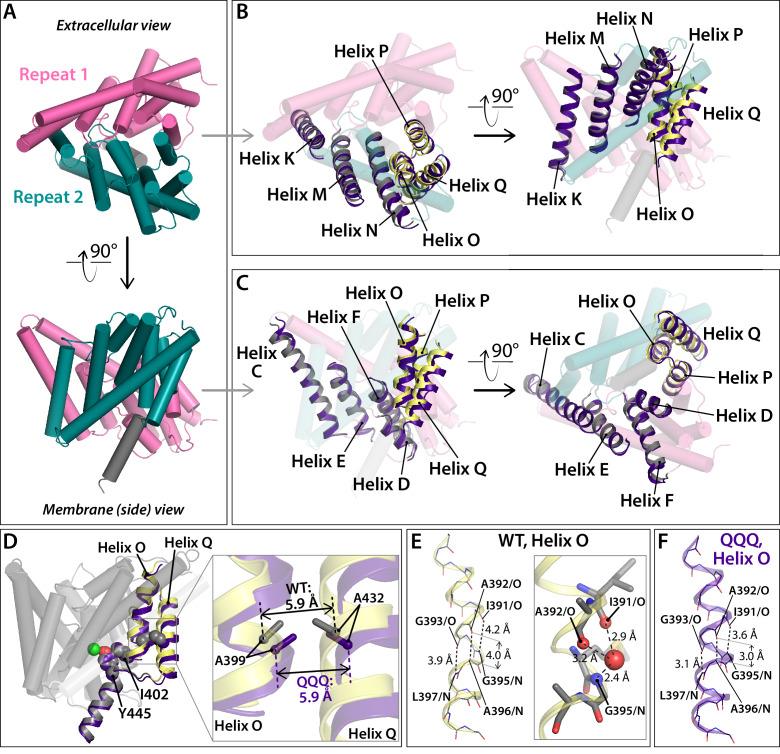
Figure 5—figure supplement 3. Conformational change at Helices O-Q. (A) View of one CLC subunit, highlighting Repeat 1 in pink and Repeat 2 in teal. Helix R (not part of the repeats) is shown in grey. (B, C) Movement of Helices O-Q (part of Repeat 2) relative to Helices K, M, N (Repeat 2). The compared helices are shown in ribbon, with QQQ in purple and WT in gray (Helices K, M, N) or yellow (O–Q). Other helices (WT) are shown as transparent cylinders. (D) View of Helices O and Q indicating the positions of residues A399 (Helix O) and A432 (Helix Q), which when cross-linked cause transport inhibition. At left, the view of one subunit shows residues A399, A432, I402, and Y445 in spacefill. Residue I402 connects Helix O to the inner-gate residue Y445, and mutation of I402 to Ala alleviates inhibition by the 399–432 cross-link (Basilio et al., 2014). At right, the expanded view shows that the relative positioning of residues A399 and A432 is not significantly changed in QQQ compared to WT. (E) In WT CLC-ec1, Helix O kinks at a conserved glycine residue, G393. (F) In QQQ, the Helix straightens, and there is no water molecule observed near the 391–393 positions.
Figure 5—figure supplement 3. Conformational change at Helices O-Q. (A) View of one CLC subunit, highlighting Repeat 1 in pink and Repeat 2 in teal. Helix R (not part of the repeats) is shown in grey. (B, C) Movement of Helices O-Q (part of Repeat 2) relative to Helices K, M, N (Repeat 2). The compared helices are shown in ribbon, with QQQ in purple and WT in gray (Helices K, M, N) or yellow (O–Q). Other helices (WT) are shown as transparent cylinders. (D) View of Helices O and Q indicating the positions of residues A399 (Helix O) and A432 (Helix Q), which when cross-linked cause transport inhibition. At left, the view of one subunit shows residues A399, A432, I402, and Y445 in spacefill. Residue I402 connects Helix O to the inner-gate residue Y445, and mutation of I402 to Ala alleviates inhibition by the 399–432 cross-link (Basilio et al., 2014). At right, the expanded view shows that the relative positioning of residues A399 and A432 is not significantly changed in QQQ compared to WT. (E) In WT CLC-ec1, Helix O kinks at a conserved glycine residue, G393. (F) In QQQ, the Helix straightens, and there is no water molecule observed near the 391–393 positions.CC BY · PubMed Central
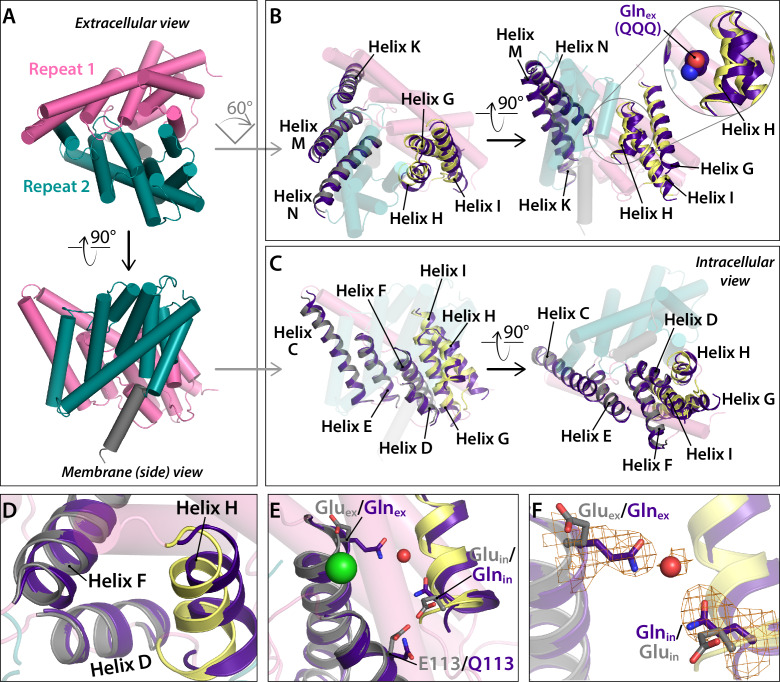
Figure 6. Conformational change at Helices G-I and repositioning of Glnin (Helix H). (A) View of one CLC subunit, highlighting Repeat 1 in pink and Repeat 2 in teal. Helix R (not part of the repeats) is shown in grey. (B) Movement of Helices G-I (part of Repeat 1) relative to Helices K, M, N (Repeat 2). The compared helices are shown in ribbon, with QQQ in purple and WT in gray (Helices K, M, N) or yellow (G–I). Other helices (WT) are shown as transparent cylinders. The inset illustrates how the movement of Helix H away from Helix N creates space to avoid steric conflict with Glnex in the ‘out’ position. (C) Movement of Helices G-I relative to other helices in Repeat 1. The compared helices are shown in ribbon, with QQQ in purple and WT in gray (Helices C-E) or yellow (G–I). Other helices (WT) are shown as transparent cylinders. (D) Close-up view showing movement of Helix H (containing Glnin) away from Helix D. (E) Conformational change at Glnin moves it away from Q113. (F) Movement of Glnin to the hydrophobic core of the protein brings it to within 6 Å of Glnex. Electron density for Glnex, Glnin, and an intervening water molecule is shown in mesh.
Figure 6. Conformational change at Helices G-I and repositioning of Glnin (Helix H). (A) View of one CLC subunit, highlighting Repeat 1 in pink and Repeat 2 in teal. Helix R (not part of the repeats) is shown in grey. (B) Movement of Helices G-I (part of Repeat 1) relative to Helices K, M, N (Repeat 2). The compared helices are shown in ribbon, with QQQ in purple and WT in gray (Helices K, M, N) or yellow (G–I). Other helices (WT) are shown as transparent cylinders. The inset illustrates how the movement of Helix H away from Helix N creates space to avoid steric conflict with Glnex in the ‘out’ position. (C) Movement of Helices G-I relative to other helices in Repeat 1. The compared helices are shown in ribbon, with QQQ in purple and WT in gray (Helices C-E) or yellow (G–I). Other helices (WT) are shown as transparent cylinders. (D) Close-up view showing movement of Helix H (containing Glnin) away from Helix D. (E) Conformational change at Glnin moves it away from Q113. (F) Movement of Glnin to the hydrophobic core of the protein brings it to within 6 Å of Glnex. Electron density for Glnex, Glnin, and an intervening water molecule is shown in mesh.CC BY · PubMed Central
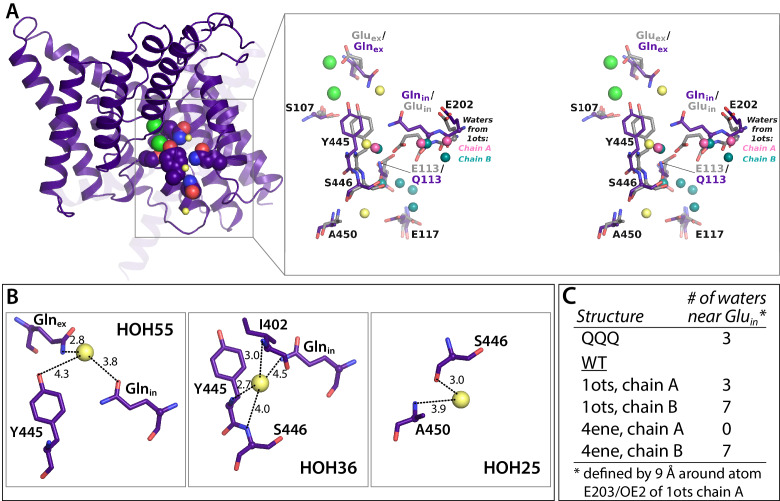
Figure 6—figure supplement 1. Crystallographic water molecules near Glnin. (A) Left: 1 subunit of QQQ CLC-ec1. The three water molecules within 9 Å of Glnin (see panel C) are shown as yellow spheres. Glnex, Glnin, Cl– ions, and inner-gate residues Y445 and S107 are shown in spacefill. Right: zoomed in stereoview of the boxed region, showing QQQ (purple) overlaid with WT (1ots) CLC-ec1 (grey). Water molecules seen in subunits A and B of 1ots are shown in pink (three water molecules) and teal (seven water molecules) respectively. (B) Close-up views of the three crystallographic water molecules near Glnin in QQQ, showing distances of potential coordinating atoms. (C) Comparison of water molecules near Glnin/Gluin in QQQ, 1ots, and 4ene, a CLC-ec1 construct with trimmed N- and C-termini, which behaves functionally like WT (Lim et al., 2012). 1ots and 4ene have the highest resolution among the reported structures with WT sequences. Overall, the total number of modeled waters associated with the protein dimer in each structure is 110 (QQQ), 167 (1ots), and 52 (4ene). The higher number of water molecules in 1ots is due to the modeling of waters with less stringent parameters (more clashes of waters with protein atoms and the modeling of waters farther than 3.5 Å from the protein atoms). 1ots also has high R factors (Rwork = 0.26 and Rfree = 0.30).
Figure 6—figure supplement 1. Crystallographic water molecules near Glnin. (A) Left: 1 subunit of QQQ CLC-ec1. The three water molecules within 9 Å of Glnin (see panel C) are shown as yellow spheres. Glnex, Glnin, Cl– ions, and inner-gate residues Y445 and S107 are shown in spacefill. Right: zoomed in stereoview of the boxed region, showing QQQ (purple) overlaid with WT (1ots) CLC-ec1 (grey). Water molecules seen in subunits A and B of 1ots are shown in pink (three water molecules) and teal (seven water molecules) respectively. (B) Close-up views of the three crystallographic water molecules near Glnin in QQQ, showing distances of potential coordinating atoms. (C) Comparison of water molecules near Glnin/Gluin in QQQ, 1ots, and 4ene, a CLC-ec1 construct with trimmed N- and C-termini, which behaves functionally like WT (Lim et al., 2012). 1ots and 4ene have the highest resolution among the reported structures with WT sequences. Overall, the total number of modeled waters associated with the protein dimer in each structure is 110 (QQQ), 167 (1ots), and 52 (4ene). The higher number of water molecules in 1ots is due to the modeling of waters with less stringent parameters (more clashes of waters with protein atoms and the modeling of waters farther than 3.5 Å from the protein atoms). 1ots also has high R factors (Rwork = 0.26 and Rfree = 0.30).CC BY · PubMed Central
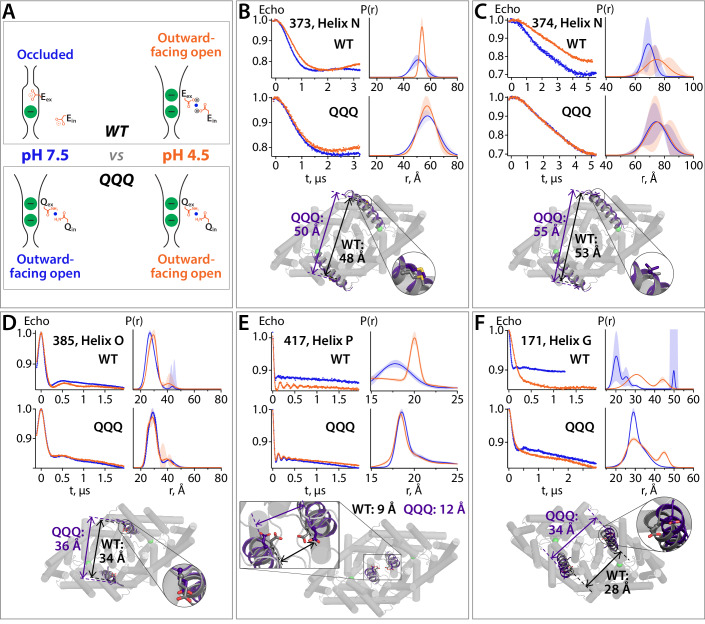
Figure 7. DEER spectroscopy reveals that the QQQ conformation is similar to WT CLC-ec1 at low pH. (A) Cartoon depiction of the hypothesis. At pH 7.5, the deprotonated Gluex and Gluin residues will adopt conformations observed in the WT CLC-ec1 crystal structure, while at pH 4.5 they will adopt conformations observed in the QQQ structure, promoting an overall conformational change that leads to widening of the extracellular vestibule. (B) – (F) DEER measurements on spin-labeled WT and QQQ CLC-ec1 (both in a cysteine-less background). WT CLC-ec1 exhibits pH-dependent changes in inter-subunit distance distributions for spin labels positioned on Helix N, O, P, or G. QQQ CLC-ec1 DEER measurements show little to no pH dependence and have distance distributions similar to those observed with WT at low pH. The lower panels illustrate the position of each labeled residue on the protein and the Cα inter-subunit distances observed in WT versus QQQ. pH-dependent changes at D417C were shown previously for WT (Khantwal et al., 2016). Data for samples with spin labels at residue 373, 385, 417, or 171 were acquired using the standard four-pulse protocol; data for the sample labeled at residue 374 were acquired using the five-pulse protocol (Figure 7—figure supplement 1).
Figure 7. DEER spectroscopy reveals that the QQQ conformation is similar to WT CLC-ec1 at low pH. (A) Cartoon depiction of the hypothesis. At pH 7.5, the deprotonated Gluex and Gluin residues will adopt conformations observed in the WT CLC-ec1 crystal structure, while at pH 4.5 they will adopt conformations observed in the QQQ structure, promoting an overall conformational change that leads to widening of the extracellular vestibule. (B) – (F) DEER measurements on spin-labeled WT and QQQ CLC-ec1 (both in a cysteine-less background). WT CLC-ec1 exhibits pH-dependent changes in inter-subunit distance distributions for spin labels positioned on Helix N, O, P, or G. QQQ CLC-ec1 DEER measurements show little to no pH dependence and have distance distributions similar to those observed with WT at low pH. The lower panels illustrate the position of each labeled residue on the protein and the Cα inter-subunit distances observed in WT versus QQQ. pH-dependent changes at D417C were shown previously for WT (Khantwal et al., 2016). Data for samples with spin labels at residue 373, 385, 417, or 171 were acquired using the standard four-pulse protocol; data for the sample labeled at residue 374 were acquired using the five-pulse protocol (Figure 7—figure supplement 1).CC BY · PubMed Central
Figure 7—figure supplement 1. Five-pulse DEER experiment: breakdown of the fitting procedure. (A) Diagram of the 5-pulse DEER experiment. Pulses 1–3 are at frequency 1 (ω1) and pulses 4 and 5 are at frequency 2 (ω2). Pulses 1–3 are square pulses of length 16, 32, and 32 ns, respectively. Pulse 5 is a 200 ns chirp pulse starting at 77 MHz and ending at 47 MHz from frequency 1. Pulse 4 is a 40 ns square pulse positioned 62 MHz from frequency 1. The time intervals, τ1 and τ2, are 2.8 and 2.9 μs, respectively. (B) Data for sample with spin label at position 374 at pH 7.5 (upper panels) and 4.5 (lower panels). The data shown in the left panels were collected with all five pulses (black) or with the amplitude of pulse five set to zero (green). The former experiment provides a combination of a pure five-pulse decay and a four-pulse artefact; the latter provides a measure of the four-pulse artefact. These data were analyzed to obtain the pure 5-pulse traces, shown as the blue and orange traces in the right panels. The 5-pulse experimental results (black) are a scaled sum of the pure 5-pulse traces (blue for pH 7.5; orange for pH 4.5) and the scaled 4-pulse artefact (green). The scaling factors are obtained as variables in the fitting routine. (C) On the left are the pure five-pulse data obtained from removing the four-pulse artefact, as described in (B). On the right are the single Gaussian distributions and confidence bands for the two conditions. These data are the same as those shown in Figure 7C.
Figure 7—figure supplement 1. Five-pulse DEER experiment: breakdown of the fitting procedure. (A) Diagram of the 5-pulse DEER experiment. Pulses 1–3 are at frequency 1 (ω1) and pulses 4 and 5 are at frequency 2 (ω2). Pulses 1–3 are square pulses of length 16, 32, and 32 ns, respectively. Pulse 5 is a 200 ns chirp pulse starting at 77 MHz and ending at 47 MHz from frequency 1. Pulse 4 is a 40 ns square pulse positioned 62 MHz from frequency 1. The time intervals, τ1 and τ2, are 2.8 and 2.9 μs, respectively. (B) Data for sample with spin label at position 374 at pH 7.5 (upper panels) and 4.5 (lower panels). The data shown in the left panels were collected with all five pulses (black) or with the amplitude of pulse five set to zero (green). The former experiment provides a combination of a pure five-pulse decay and a four-pulse artefact; the latter provides a measure of the four-pulse artefact. These data were analyzed to obtain the pure 5-pulse traces, shown as the blue and orange traces in the right panels. The 5-pulse experimental results (black) are a scaled sum of the pure 5-pulse traces (blue for pH 7.5; orange for pH 4.5) and the scaled 4-pulse artefact (green). The scaling factors are obtained as variables in the fitting routine. (C) On the left are the pure five-pulse data obtained from removing the four-pulse artefact, as described in (B). On the right are the single Gaussian distributions and confidence bands for the two conditions. These data are the same as those shown in Figure 7C.CC BY · PubMed Central
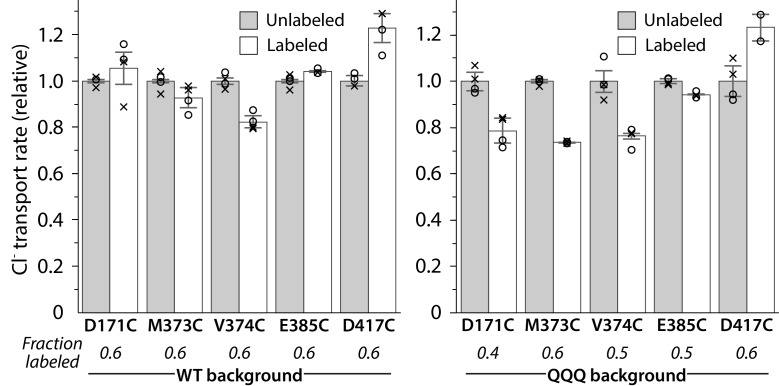
Figure 7—figure supplement 2. Activity of spin-labeled DEER samples. Protein was reconstituted into liposomes before and after spin-labeling at the substituted cysteine residue. Unitary Cl– transport rates are shown for measurements from two reconstitution samples performed on the same protein preparation that was used for DEER measurements. Circles and crosses represent duplicate measurements from the first and second reconstitution sample, respectively. For D417C/QQQ, one sample was lost, so only one set of duplicates is shown. Error bars show either the measurement range (D417C/QQQ) or the range of the duplicate averages (all other samples). Turnover rates of labeled mutants are shown normalized to the turnover rate of the respective unlabeled sample.
Figure 7—figure supplement 2. Activity of spin-labeled DEER samples. Protein was reconstituted into liposomes before and after spin-labeling at the substituted cysteine residue. Unitary Cl– transport rates are shown for measurements from two reconstitution samples performed on the same protein preparation that was used for DEER measurements. Circles and crosses represent duplicate measurements from the first and second reconstitution sample, respectively. For D417C/QQQ, one sample was lost, so only one set of duplicates is shown. Error bars show either the measurement range (D417C/QQQ) or the range of the duplicate averages (all other samples). Turnover rates of labeled mutants are shown normalized to the turnover rate of the respective unlabeled sample.CC BY · PubMed Central
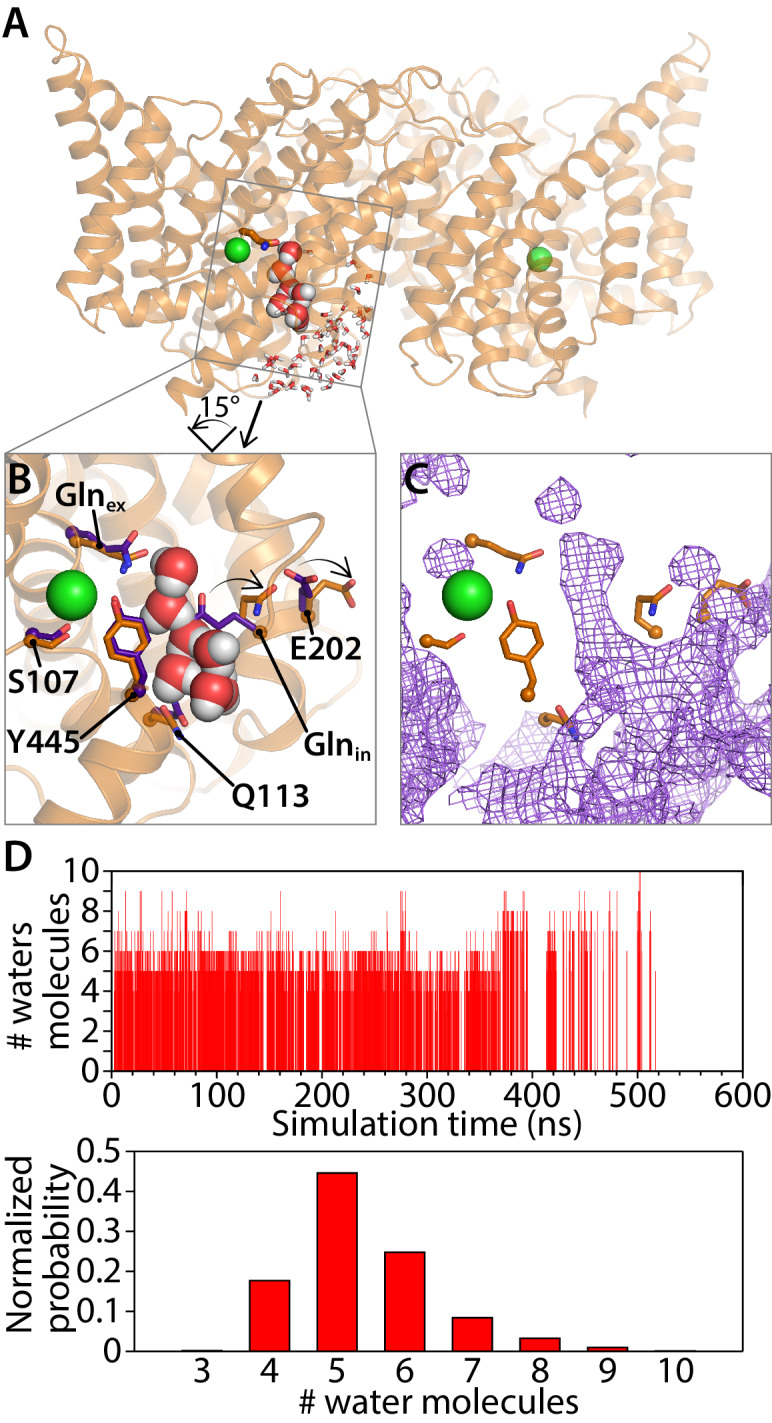
Figure 8. Water pathways between Glnex and intracellular bulk. (A) A simulation snapshot showing a continuous water pathway directly connecting Glnex to the intracellular bulk water in one of the subunits. (B) Zoomed in view of the water pathway. In this example, which represents the most frequently observed water pathway (89% of the water pathways), Glnin has rotated away from the position observed in the QQQ crystal structure to make room for the water pathway. The purple side chains show the residue positions observed in the crystal structure; the orange side chains show the residue positions in a representative simulation snapshot. Conserved residue E202 also rotates from its starting position. (C) Overall water occupancy map (density contoured at isovalue 0.35) for the side-chain configuration shown in panel B. (D) Water pathways between Glnex and the intracellular bulk water arise spontaneously throughout the 600-ns simulation. Each vertical line in the panels shows the occurrence of a Glnex/bulk-connecting water pathway at that time point, with the length of the line representing the number of water molecules in the shortest path. The number of water molecules needed to reach the bulk water follows a normal distribution dominated by 5–6 water molecules.
Figure 8. Water pathways between Glnex and intracellular bulk. (A) A simulation snapshot showing a continuous water pathway directly connecting Glnex to the intracellular bulk water in one of the subunits. (B) Zoomed in view of the water pathway. In this example, which represents the most frequently observed water pathway (89% of the water pathways), Glnin has rotated away from the position observed in the QQQ crystal structure to make room for the water pathway. The purple side chains show the residue positions observed in the crystal structure; the orange side chains show the residue positions in a representative simulation snapshot. Conserved residue E202 also rotates from its starting position. (C) Overall water occupancy map (density contoured at isovalue 0.35) for the side-chain configuration shown in panel B. (D) Water pathways between Glnex and the intracellular bulk water arise spontaneously throughout the 600-ns simulation. Each vertical line in the panels shows the occurrence of a Glnex/bulk-connecting water pathway at that time point, with the length of the line representing the number of water molecules in the shortest path. The number of water molecules needed to reach the bulk water follows a normal distribution dominated by 5–6 water molecules.CC BY · PubMed Central
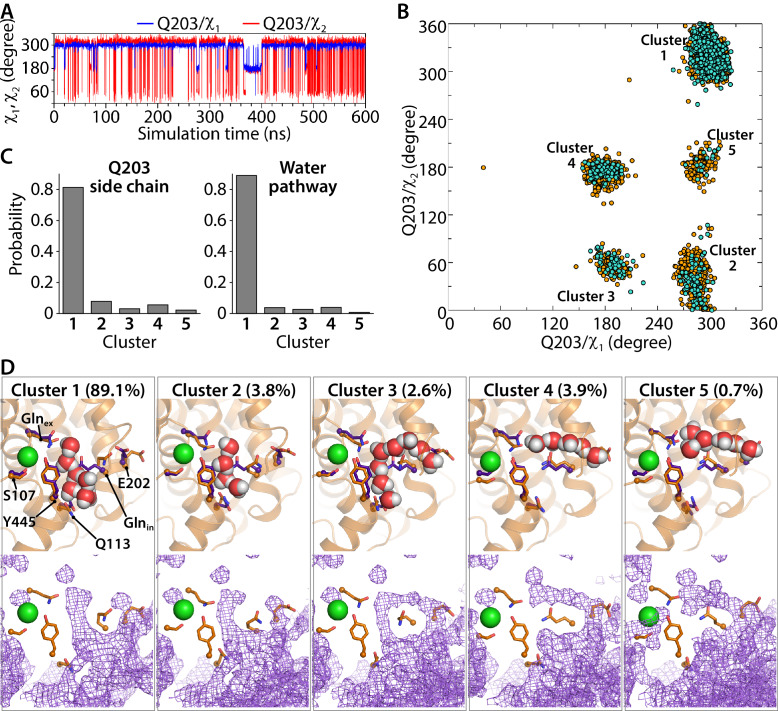
Figure 8—figure supplement 1. Water pathways and conformational dynamics of Glnin (Q203) side chain orientation. (A) Traced dihedral angles of Q203 during the simulation of the CLC-ec1 QQQ mutant show that the Q203 side chain is flexible and undergoes dynamical changes over the course of the simulation. (B) 2D scatter map of Q203 dihedral angles reveals five main clusters of side-chain conformations sampled during the equilibrium simulation. Each dot represents one pair of the dihedral angles of Q203 from snapshots taken at 100-ps intervals in the simulation. The frames with continuous water pathways are shown in cyan. (C) The distribution of the side-chain conformations of Q203 over the trajectory (left panel) shows that Cluster 1 is most populated. This conformation also captures most of the water pathways (right panel) during the simulation. The water-pathway probability is normalized to the total number of water pathways. (D) Representative simulation snapshots with Glnin in different conformations, showing continuous water pathways between Glnex and the intracellular bulk. Clusters 4 and 5, representing less than 5% of the pathways, reach intracellular bulk water via an alternate pathway. Lower panels show the overall water occupancy maps for each cluster in the simulation. Density is contoured at isovalue 0.35.
Figure 8—figure supplement 1. Water pathways and conformational dynamics of Glnin (Q203) side chain orientation. (A) Traced dihedral angles of Q203 during the simulation of the CLC-ec1 QQQ mutant show that the Q203 side chain is flexible and undergoes dynamical changes over the course of the simulation. (B) 2D scatter map of Q203 dihedral angles reveals five main clusters of side-chain conformations sampled during the equilibrium simulation. Each dot represents one pair of the dihedral angles of Q203 from snapshots taken at 100-ps intervals in the simulation. The frames with continuous water pathways are shown in cyan. (C) The distribution of the side-chain conformations of Q203 over the trajectory (left panel) shows that Cluster 1 is most populated. This conformation also captures most of the water pathways (right panel) during the simulation. The water-pathway probability is normalized to the total number of water pathways. (D) Representative simulation snapshots with Glnin in different conformations, showing continuous water pathways between Glnex and the intracellular bulk. Clusters 4 and 5, representing less than 5% of the pathways, reach intracellular bulk water via an alternate pathway. Lower panels show the overall water occupancy maps for each cluster in the simulation. Density is contoured at isovalue 0.35.CC BY · PubMed Central
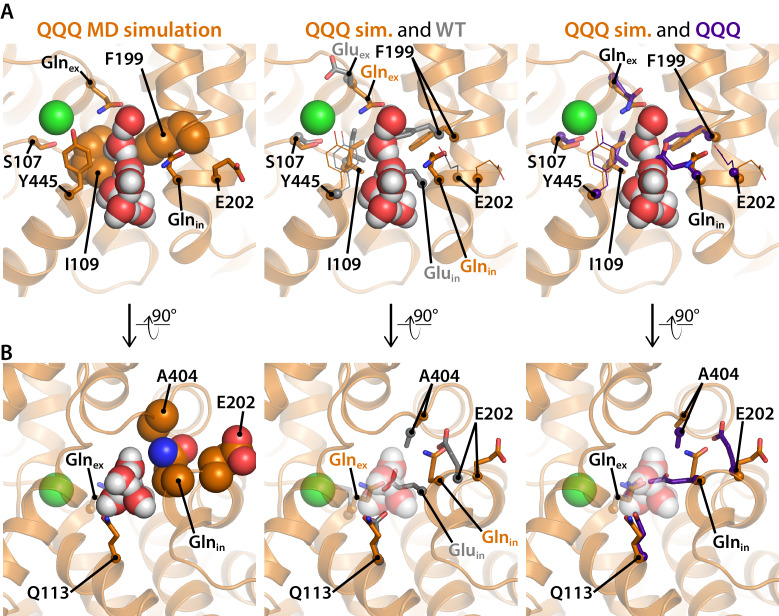
Figure 8—figure supplement 2. Residues of interest near the inner water pathway. (A) The left panel shows that the inner water pathway is lined by F199 and I109; at the latter position, mutations were found to specifically inhibit the H+ branch of the CLC transport cycle (Han et al., 2014). S107 and Y445, located at the inner gate of the Cl–-permeation pathway, are shown for orientation. The middle and right panels show overlays to compare side-chain positioning in the simulation snapshot to side-chain position in the WT and QQQ crystal structures, respectively. Glnin and F199 side chains project into the water pathway and must rearrange to accommodate water entry into the cavity. (B) A rotated view of the inner water pathway shows tight packing of residues around Gluin/Glnin and the ‘interfacial pathway’ residues E202, and A404 (left panel). The same view with overlay of side chains from the WT crystal structure (middle panel) and the QQQ crystal structure (right panel) show that water entry requires rotation of Gluin/Glnin away from crystallographic conformations. The tight packing explains how substitutions of large residues for E202 or A404 (Lim et al., 2012; Han et al., 2014) would obstruct Gluin/Glnin from moving to accommodate the inner water pathway.
Figure 8—figure supplement 2. Residues of interest near the inner water pathway. (A) The left panel shows that the inner water pathway is lined by F199 and I109; at the latter position, mutations were found to specifically inhibit the H+ branch of the CLC transport cycle (Han et al., 2014). S107 and Y445, located at the inner gate of the Cl–-permeation pathway, are shown for orientation. The middle and right panels show overlays to compare side-chain positioning in the simulation snapshot to side-chain position in the WT and QQQ crystal structures, respectively. Glnin and F199 side chains project into the water pathway and must rearrange to accommodate water entry into the cavity. (B) A rotated view of the inner water pathway shows tight packing of residues around Gluin/Glnin and the ‘interfacial pathway’ residues E202, and A404 (left panel). The same view with overlay of side chains from the WT crystal structure (middle panel) and the QQQ crystal structure (right panel) show that water entry requires rotation of Gluin/Glnin away from crystallographic conformations. The tight packing explains how substitutions of large residues for E202 or A404 (Lim et al., 2012; Han et al., 2014) would obstruct Gluin/Glnin from moving to accommodate the inner water pathway.CC BY · PubMed Central
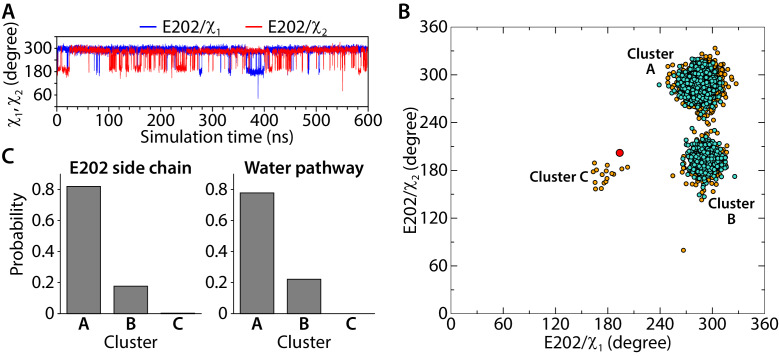
Figure 8—figure supplement 3. Conformational dynamics of the E202 side-chain orientation. (A) Traced dihedral angles of E202 during the simulation of the CLC-ec1 QQQ. (B) 2D scatter map of E202 dihedral angles reveals 3 clusters of side-chain conformations sampled during the equilibrium simulation. Each dot represents one pair of the dihedral angles of E202 from snapshots taken at 100-ps intervals in the simulation. The frames with continuous water pathways are shown in cyan. The large red dot represents the starting position for E202, observed in the QQQ crystal structure. (C) The distribution of the side-chain conformations of E202 over the trajectory (left panel) and water pathways (right panel, normalized to the total number of water pathways). Water pathways are only observed when E202 is in the cluster A or B conformation, rotated away from its starting position.
Figure 8—figure supplement 3. Conformational dynamics of the E202 side-chain orientation. (A) Traced dihedral angles of E202 during the simulation of the CLC-ec1 QQQ. (B) 2D scatter map of E202 dihedral angles reveals 3 clusters of side-chain conformations sampled during the equilibrium simulation. Each dot represents one pair of the dihedral angles of E202 from snapshots taken at 100-ps intervals in the simulation. The frames with continuous water pathways are shown in cyan. The large red dot represents the starting position for E202, observed in the QQQ crystal structure. (C) The distribution of the side-chain conformations of E202 over the trajectory (left panel) and water pathways (right panel, normalized to the total number of water pathways). Water pathways are only observed when E202 is in the cluster A or B conformation, rotated away from its starting position.CC BY · PubMed Central
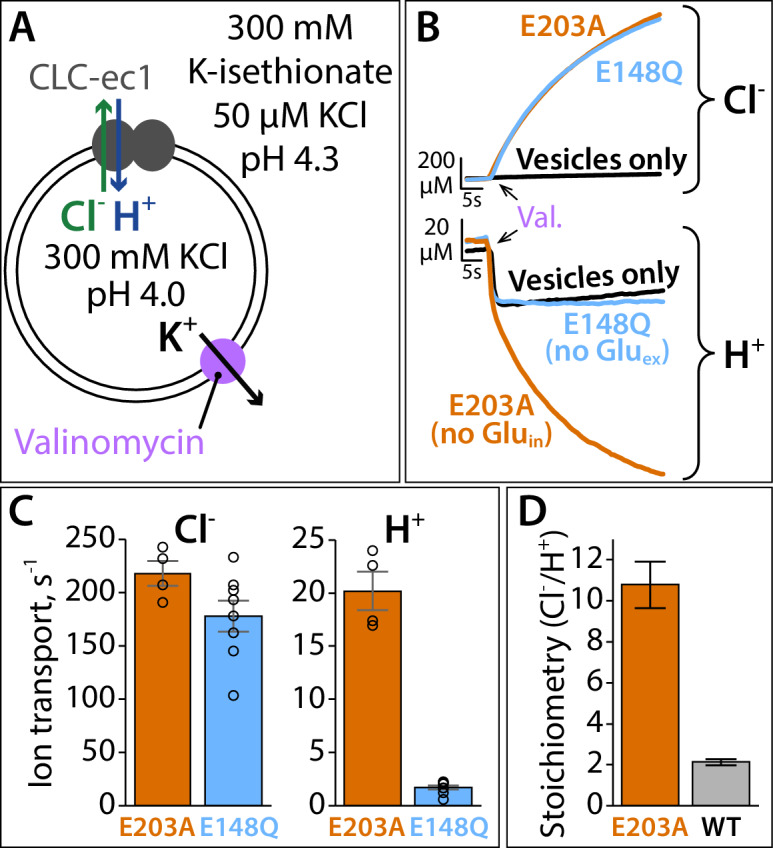
Figure 9. Proton pumping by CLC-ec1 with neutralized Gluin (E203A). (A) Cartoon depiction of the H+/Cl– flux assay. Extravesicular [Cl–] and [H+] are simultaneously measured using Ag·AgCl and pH electrodes, respectively. The experimental setup involves a 2-fold gradient for H+, such that any leak will involve movement of H+ out of the vesicles, and any H+ movement into the liposomes must occur via transport coupled to the Cl– gradient (pumping). (B) Representative Cl– and H+ traces (upper and lower panels, respectively) for CLC-ec1 mutants with a neutral residue at either Gluin (E203A) or Gluex (E148Q). (C) Summary data showing Cl– and H+ transport rates, average ± SEM. For E203A, n = 4 (samples from two independent protein preparations); for E148Q, n = 8 (samples from four reconstitutions done with protein from three preparations). (D) Cl–/H+ stoichiometry for E203A, with WT CLC-ec1 shown for comparison. Stoichiometry is determined from the ratio of the ion transport rates (panel C). WT samples are from experiments done on the same days as the E203A and mutant samples shown in Figure 9—figure supplement 1, with n = 10 (samples from five reconstitutions done with protein from four preparations).
Figure 9. Proton pumping by CLC-ec1 with neutralized Gluin (E203A). (A) Cartoon depiction of the H+/Cl– flux assay. Extravesicular [Cl–] and [H+] are simultaneously measured using Ag·AgCl and pH electrodes, respectively. The experimental setup involves a 2-fold gradient for H+, such that any leak will involve movement of H+ out of the vesicles, and any H+ movement into the liposomes must occur via transport coupled to the Cl– gradient (pumping). (B) Representative Cl– and H+ traces (upper and lower panels, respectively) for CLC-ec1 mutants with a neutral residue at either Gluin (E203A) or Gluex (E148Q). (C) Summary data showing Cl– and H+ transport rates, average ± SEM. For E203A, n = 4 (samples from two independent protein preparations); for E148Q, n = 8 (samples from four reconstitutions done with protein from three preparations). (D) Cl–/H+ stoichiometry for E203A, with WT CLC-ec1 shown for comparison. Stoichiometry is determined from the ratio of the ion transport rates (panel C). WT samples are from experiments done on the same days as the E203A and mutant samples shown in Figure 9—figure supplement 1, with n = 10 (samples from five reconstitutions done with protein from four preparations).CC BY · PubMed Central
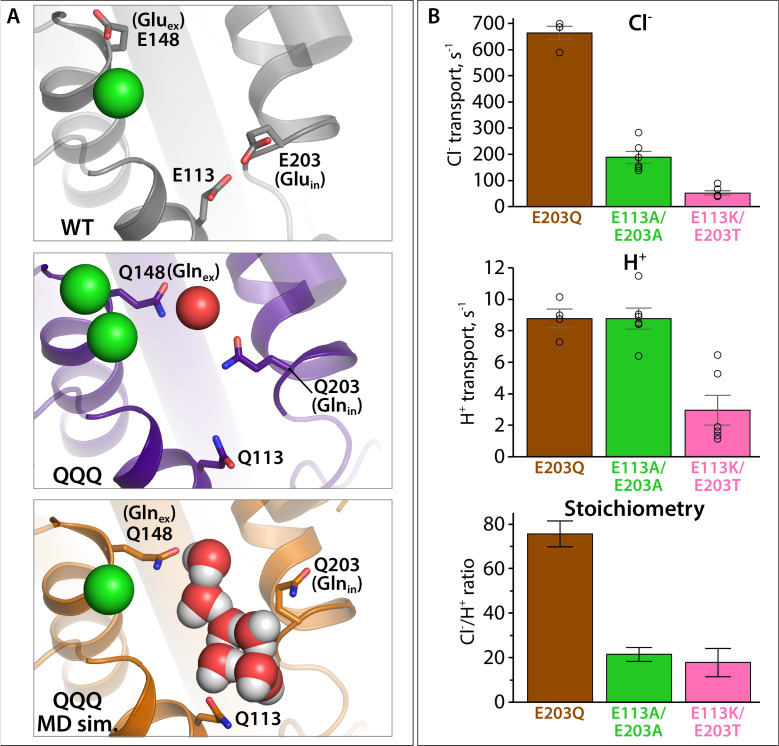
Figure 9—figure supplement 1. Proton pumping by CLC-ec1 variants with substitutions at Gluin and E113. (A) Structural views showing positioning of Gluin/Glnin (E203/Q203) and E113/Q113 in WT CLC-ec1, QQQ, and in a simulation snapshot of QQQ. (B) Summary data showing Cl– and H+ transport rates, and Cl–/H+ coupling stoichiometry, averages ± SEM. For E203Q, n = 4 (samples from two independent protein preparations); for E113A/E203A and E113K/E203T, n = 6, with samples from two independent protein preparations.
Figure 9—figure supplement 1. Proton pumping by CLC-ec1 variants with substitutions at Gluin and E113. (A) Structural views showing positioning of Gluin/Glnin (E203/Q203) and E113/Q113 in WT CLC-ec1, QQQ, and in a simulation snapshot of QQQ. (B) Summary data showing Cl– and H+ transport rates, and Cl–/H+ coupling stoichiometry, averages ± SEM. For E203Q, n = 4 (samples from two independent protein preparations); for E113A/E203A and E113K/E203T, n = 6, with samples from two independent protein preparations.CC BY · PubMed Central
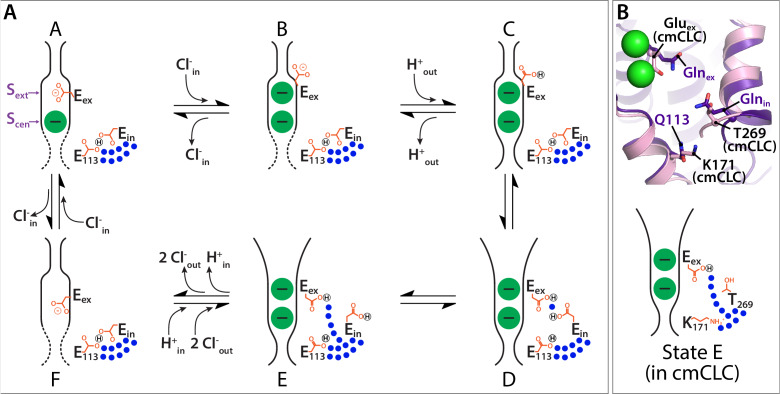
Figure 10. Proposed new framework for the CLC Cl–/H+ transport cycle. (A) Starting from state A, which reflects the structure seen in WT CLC-ec1, a single Cl– is bound, and Gluex is in the ‘middle’ position. Gluin and E113 are in a H-bonded configuration, restricting water access to the center of the protein. Moving clockwise, binding of Cl– from the intracellular side displaces Gluex by a ‘knock-on’ mechanism (Miller and Nguitragool, 2009), making it available for protonation from the extracellular side (State B). This protonation step generates state C, which reflects the structure seen in E148Q CLC-ec1, with Gluex in the ‘up’ conformation. A subsequent H+-induced conformational change generates a state D (captured in the QQQ mutant structure), which has an open extracellular vestibule and new positionings for Gluex and Gluin. Conformational dynamics of Gluin allows water pathways to connect Gluex directly to the intracellular bulk water, as in state E. From State E, deprotonation of Gluex promotes its return to the anion pathway, in competition with Cl– (state F). Binding of Cl– from the intracellular side, coordinated with inner-gate opening (Basilio et al., 2014) (reflected by the dotted lines) generates the original state A. (B) The updated transport model is consistent with Cl–/H+ exchange seen in transporters that do not have a titratable residue at the Gluin position, such as cmCLC. The upper panel shows a structural overlay of QQQ and cmCLC, highlighting the positions of the Thr and Lys residues occurring at the Gluin and E113 positions respectively. The lower panel is a cartoon depiction of the water pathway.
Figure 10. Proposed new framework for the CLC Cl–/H+ transport cycle. (A) Starting from state A, which reflects the structure seen in WT CLC-ec1, a single Cl– is bound, and Gluex is in the ‘middle’ position. Gluin and E113 are in a H-bonded configuration, restricting water access to the center of the protein. Moving clockwise, binding of Cl– from the intracellular side displaces Gluex by a ‘knock-on’ mechanism (Miller and Nguitragool, 2009), making it available for protonation from the extracellular side (State B). This protonation step generates state C, which reflects the structure seen in E148Q CLC-ec1, with Gluex in the ‘up’ conformation. A subsequent H+-induced conformational change generates a state D (captured in the QQQ mutant structure), which has an open extracellular vestibule and new positionings for Gluex and Gluin. Conformational dynamics of Gluin allows water pathways to connect Gluex directly to the intracellular bulk water, as in state E. From State E, deprotonation of Gluex promotes its return to the anion pathway, in competition with Cl– (state F). Binding of Cl– from the intracellular side, coordinated with inner-gate opening (Basilio et al., 2014) (reflected by the dotted lines) generates the original state A. (B) The updated transport model is consistent with Cl–/H+ exchange seen in transporters that do not have a titratable residue at the Gluin position, such as cmCLC. The upper panel shows a structural overlay of QQQ and cmCLC, highlighting the positions of the Thr and Lys residues occurring at the Gluin and E113 positions respectively. The lower panel is a cartoon depiction of the water pathway.CC BY · PubMed Central
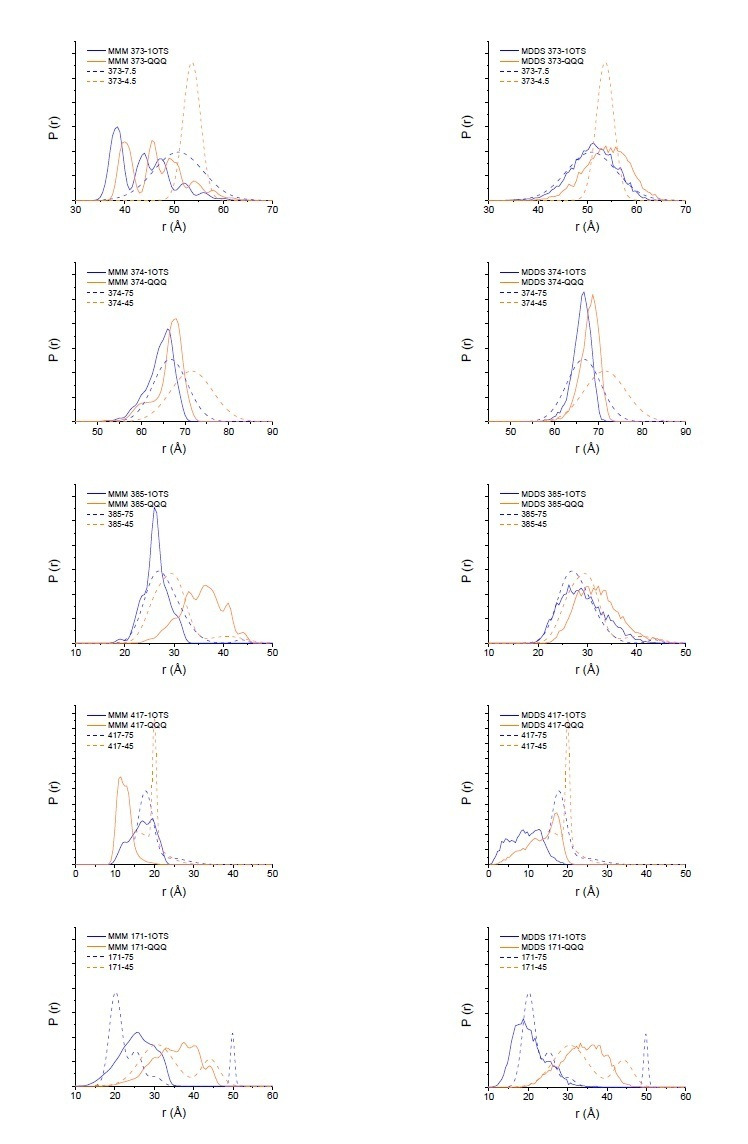
Author response image 1. Modeling results for expected distance distributions using MMM (left panels) or MDDS (right panels). While neither method perfectly matches the width of the distance distribution, as expected (Alexander et al. (2013) PLoS One. 8(9):e72851), they support that the changes seen in the DEER data are reflective of the changes in the crystal structure.
Author response image 1. Modeling results for expected distance distributions using MMM (left panels) or MDDS (right panels). While neither method perfectly matches the width of the distance distribution, as expected (Alexander et al. (2013) PLoS One. 8(9):e72851), they support that the changes seen in the DEER data are reflective of the changes in the crystal structure.CC BY · PubMed Central

Verification

Claims the paper makes

The claims and statistics of this paper haven’t been checked yet.

Run the check — free, no account needed. It reads the open-access text and checks the sources it cites.

A few free checks a day · papers already verified open instantly · results are public

Claims other papers make about this one

Each is checked against this paper’s own text: does it say what the citing paper says it does?

Self-check

Percentages, sums and reported differences re-computed from the paper’s own numbers.

The self-check needs the paper’s full text.

Citations

Cites

No references could be resolved yet.

Research works printed but not linked: 108

  1. Abraham, 2015, 13C NMR detects conformational change in the 100-kD membrane transporter ClC-ec1, Journal of Biomolecular NMR, 61, 209, 10.1007/s10858-015-9898-7 · DOI
  2. Accardi, 2005, Separate ion pathways in a Cl-/H+ exchanger, Journal of General Physiology, 126, 563, 10.1085/jgp.200509417 · DOI
  3. Accardi, 2015, Structure and gating of CLC channels and exchangers, The Journal of Physiology, 593, 4129, 10.1113/JP270575 · DOI · Paper page
  4. Accardi, 2004, Secondary active transport mediated by a prokaryotic homologue of ClC Cl- channels, Nature, 427, 803, 10.1038/nature02314 · DOI
  5. Basilio, 2014, Conformational changes required for H+/Cl- exchange mediated by a CLC transporter, Nature Structural & Molecular Biology, 21, 456, 10.1038/nsmb.2814 · DOI
  6. Basilio, 2015, A Proteoliposome-Based efflux assay to determine Single-molecule properties of Cl- channels and transporters, Journal of Visualized Experiments, 20, 10.3791/52369 · DOI
  7. Bignon, 2020, Analysis of CLCNKB mutations at dimer-interface, calcium-binding site, and pore reveals a variety of functional alterations in ClC-Kb channel leading to bartter syndrome, Human Mutation, 41, 774, 10.1002/humu.23962 · DOI
  8. Borbat, 2013, Improved sensitivity for Long-Distance measurements in biomolecules: five-pulse double Electron–Electron Resonance, The Journal of Physical Chemistry Letters, 4, 170, 10.1021/jz301788n · DOI
  9. Brandon, 2012, The global analysis of DEER data, Journal of Magnetic Resonance, 218, 93, 10.1016/j.jmr.2012.03.006 · DOI
  10. Caffrey, 2009, Crystallizing membrane proteins using lipidic mesophases, Nature Protocols, 4, 706, 10.1038/nprot.2009.31 · DOI
  11. Chovancova, 2012, CAVER 3.0: a tool for the analysis of transport pathways in dynamic protein structures, PLOS Computational Biology, 8, 10.1371/journal.pcbi.1002708 · DOI
  12. Crisman, 2009, Inward-facing conformation of glutamate transporters as revealed by their inverted-topology structural repeats, PNAS, 106, 20752, 10.1073/pnas.0908570106 · DOI
  13. Darden, 1993, Particle mesh Ewald: An N ⋅log( N ) method for Ewald sums in large systems, The Journal of Chemical Physics, 98, 10089, 10.1063/1.464397 · DOI
  14. Duran, 2013, Inverted topologies in membrane proteins: a mini-review, Computational and Structural Biotechnology Journal, 8, 10.5936/csbj.201308004 · DOI
  15. Duster, 2019, Adaptive partitioning QM/MM for molecular dynamics simulations: 6. proton transport through a biological channel, Journal of Chemical Theory and Computation, 15, 892, 10.1021/acs.jctc.8b01128 · DOI
  16. Dutzler, 2002, X-ray structure of a ClC chloride channel at 3.0 A reveals the molecular basis of anion selectivity, Nature, 415, 287, 10.1038/415287a · DOI · Paper page
  17. Dutzler, 2003, Gating the selectivity filter in ClC chloride channels, Science, 300, 108, 10.1126/science.1082708 · DOI · Paper page
  18. Elvington, 2009, Substrate-driven conformational changes in ClC-ec1 observed by fluorine NMR, The EMBO Journal, 28, 3090, 10.1038/emboj.2009.259 · DOI
  19. Emsley, 2004, Coot: model-building tools for molecular graphics, Acta Crystallographica. Section D, Biological Crystallography, 60, 2126, 10.1107/S0907444904019158 · DOI · Paper page
  20. Engh, 2005, Cysteine accessibility in ClC-0 supports conservation of the ClC intracellular vestibule, Journal of General Physiology, 125, 601, 10.1085/jgp.200509258 · DOI
  21. Estévez, 2003, Conservation of chloride channel structure revealed by an inhibitor binding site in ClC-1, Neuron, 38, 47, 10.1016/S0896-6273(03)00168-5 · DOI
  22. Evans, 2006, Scaling and assessment of data quality, Acta Crystallographica Section D Biological Crystallography, 62, 72, 10.1107/S0907444905036693 · DOI
  23. Faraldo-Gómez, 2004, Electrostatics of ion stabilization in a ClC chloride channel homologue from Escherichia coli, Journal of Molecular Biology, 339, 981, 10.1016/j.jmb.2004.04.023 · DOI
  24. Feng, 2010, Structure of a eukaryotic CLC transporter defines an intermediate state in the transport cycle, Science, 330, 635, 10.1126/science.1195230 · DOI · Paper page
  25. Feng, 2012, Molecular mechanism of proton transport in CLC Cl-/H+ exchange transporters, PNAS, 109, 11699, 10.1073/pnas.1205764109 · DOI · Paper page
  26. Forrest, 2008, Mechanism for alternating access in neurotransmitter transporters, PNAS, 105, 10338, 10.1073/pnas.0804659105 · DOI
  27. Forrest, 2011, The structural basis of secondary active transport mechanisms, Biochimica Et Biophysica Acta (BBA) - Bioenergetics, 1807, 167, 10.1016/j.bbabio.2010.10.014 · DOI
  28. Forrest, 2015, Structural symmetry in membrane proteins, Annual Review of Biophysics, 44, 311, 10.1146/annurev-biophys-051013-023008 · DOI · Paper page
  29. Forrest, 2009, The rocking bundle: a mechanism for ion-coupled solute flux by symmetrical transporters, Physiology, 24, 377, 10.1152/physiol.00030.2009 · DOI
  30. Han, 2014, Water access points and hydration pathways in CLC H+/Cl- transporters, PNAS, 111, 1819, 10.1073/pnas.1317890111 · DOI
  31. Hoopes, 2005, Dent disease with mutations in OCRL1, The American Journal of Human Genetics, 76, 260, 10.1086/427887 · DOI
  32. Hoover, 1985, Canonical dynamics: equilibrium phase-space distributions, Physical Review A, 31, 1695, 10.1103/PhysRevA.31.1695 · DOI
  33. Hu, 2016, X-exome sequencing of 405 unresolved families identifies seven novel intellectual disability genes, Molecular Psychiatry, 21, 133, 10.1038/mp.2014.193 · DOI
  34. Huang, 2013, CHARMM36 all-atom additive protein force field: validation based on comparison to NMR data, Journal of Computational Chemistry, 34, 2135, 10.1002/jcc.23354 · DOI
  35. Humphrey, 1996, VMD: visual molecular dynamics, Journal of Molecular Graphics, 14, 33, 10.1016/0263-7855(96)00018-5 · DOI · Paper page
  36. Hustedt, 2018, Confidence analysis of DEER data and its structural interpretation with Ensemble-Biased metadynamics, Biophysical Journal, 115, 1200, 10.1016/j.bpj.2018.08.008 · DOI
  37. Iyer, 2003, Arginine-agmatine antiporter in extreme acid resistance in Escherichia coli, Journal of Bacteriology, 185, 6556, 10.1128/JB.185.22.6556-6561.2003 · DOI
  38. Jardetzky, 1966, Simple allosteric model for membrane pumps, Nature, 211, 969, 10.1038/211969a0 · DOI
  39. Jentsch, 2018, CLC chloride channels and transporters: structure, function, physiology, and disease, Physiological Reviews, 98, 1493, 10.1152/physrev.00047.2017 · DOI
  40. Jeschke, 2012, DEER distance measurements on proteins, Annual Review of Physical Chemistry, 63, 419, 10.1146/annurev-physchem-032511-143716 · DOI
  41. Jeschke, 2007, Distance measurements on spin-labelled biomacromolecules by pulsed electron paramagnetic resonance, Physical Chemistry Chemical Physics, 9, 1895, 10.1039/b614920k · DOI
  42. Jiang, 2016, Molecular Basis for Differential Anion Binding and Proton Coupling in the Cl–/H+ Exchanger ClC-ec1, Journal of the American Chemical Society, 138, 3066, 10.1021/jacs.5b12062 · DOI
  43. Jorgensen, 1983, Comparison of simple potential functions for simulating liquid water, The Journal of Chemical Physics, 79, 926, 10.1063/1.445869 · DOI
  44. Kabsch, 2010, XDS, Acta Crystallographica. Section D, Biological Crystallography, 66, 125, 10.1107/S0907444909047337 · DOI · Paper page
  45. Kasper, 2005, Loss of the chloride channel ClC-7 leads to lysosomal storage disease and neurodegeneration, The EMBO Journal, 24, 1079, 10.1038/sj.emboj.7600576 · DOI
  46. Khantwal, 2016, Revealing an outward-facing open conformational state in a CLC Cl(-)/H(+) exchange transporter, eLife, 5, 10.7554/eLife.11189 · DOI
  47. Klauda, 2010, Update of the CHARMM all-atom additive force field for lipids: validation on six lipid types, The Journal of Physical Chemistry B, 114, 7830, 10.1021/jp101759q · DOI
  48. Ko, 2010, Secondary water pore formation for proton transport in a ClC exchanger revealed by an atomistic Molecular-Dynamics simulation, Biophysical Journal, 98, 2163, 10.1016/j.bpj.2010.01.043 · DOI
  49. Konrad, 2000, Mutations in the chloride channel gene CLCNKB as a cause of classic bartter syndrome, Journal of the American Society of Nephrology : JASN, 11, 1449, 10.1681/ASN.V1181449 · DOI
  50. Last, 2018, A CLC-type F-/H+ antiporter in ion-swapped conformations, Nature Structural & Molecular Biology, 25, 601, 10.1038/s41594-018-0082-0 · DOI · Paper page
  51. Leisle, 2011, ClC-7 is a slowly voltage-gated 2cl(-)/1H(+)-exchanger and requires Ostm1 for transport activity, The EMBO Journal, 30, 2140, 10.1038/emboj.2011.137 · DOI
  52. Leisle, 2020, Divergent Cl-and H+ pathways underlie transport coupling and gating in CLC exchangers and channels, eLife, 9, 10.7554/eLife.51224 · DOI
  53. Lim, 2012, Intracellular proton access in a Cl(-)/H(+) antiporter, PLOS Biology, 10, 10.1371/journal.pbio.1001441 · DOI
  54. Lim, 2009, Intracellular proton-transfer mutants in a CLC Cl-/H+ exchanger, Journal of General Physiology, 133, 131, 10.1085/jgp.200810112 · DOI
  55. Lin, 2009, Chronic renal failure in a boy with classic bartter's syndrome due to a novel mutation in CLCNKB coding for the chloride channel, European Journal of Pediatrics, 168, 1129, 10.1007/s00431-008-0883-y · DOI
  56. Lin, 2003, Probing the pore of ClC-0 by substituted cysteine accessibility method using methane thiosulfonate reagents, Journal of General Physiology, 122, 147, 10.1085/jgp.200308845 · DOI
  57. Lísal, 2008, The ClC-0 chloride channel is a 'broken' Cl-/H+ antiporter, Nature Structural & Molecular Biology, 15, 805, 10.1038/nsmb.1466 · DOI · Paper page
  58. Lloyd, 1996, A common molecular basis for three inherited kidney stone diseases, Nature, 379, 445, 10.1038/379445a0 · DOI
  59. Lobet, 2006, Ion-binding properties of the ClC chloride selectivity filter, The EMBO Journal, 25, 24, 10.1038/sj.emboj.7600909 · DOI
  60. Lourdel, 2012, ClC-5 mutations associated with dent’s disease: a major role of the dimer interface, Pflügers Archiv - European Journal of Physiology, 463, 247, 10.1007/s00424-011-1052-0 · DOI
  61. Ludewig, 1996, Two physically distinct pores in the dimeric ClC-0 chloride channel, Nature, 383, 340, 10.1038/383340a0 · DOI
  62. Matsumoto, 2007, Relevance of hydrogen bond definitions in liquid water, The Journal of Chemical Physics, 126, 10.1063/1.2431168 · DOI
  63. Matulef, 2005, Side-dependent inhibition of a prokaryotic ClC by DIDS, Biophysical Journal, 89, 1721, 10.1529/biophysj.105.066522 · DOI
  64. Matulef, 2007, The CLC 'chloride channel' family: revelations from prokaryotes, Molecular Membrane Biology, 24, 342, 10.1080/09687680701413874 · DOI
  65. Mayes, 2018, Multiscale kinetic modeling reveals an ensemble of Cl-/H+ Exchange Pathways in ClC-ec1 Antiporter, Journal of the American Chemical Society, 140, 1793, 10.1021/jacs.7b11463 · DOI
  66. McCoy, 2007, Phaser crystallographic software, Journal of Applied Crystallography, 40, 658, 10.1107/S0021889807021206 · DOI · Paper page
  67. Middleton, 1996, Homodimeric architecture of a ClC-type chloride ion channel, Nature, 383, 337, 10.1038/383337a0 · DOI
  68. Miller, 2006, ClC chloride channels viewed through a transporter Lens, Nature, 440, 484, 10.1038/nature04713 · DOI
  69. Miller, 2009, A provisional transport mechanism for a chloride channel-type Cl-/H+ exchanger, Philosophical Transactions of the Royal Society of London. Series B, Biological Sciences, 364, 175, 10.1098/rstb.2008.0138 · DOI
  70. Miller, 1984, Dimeric structure of single chloride channels from Torpedo electroplax, PNAS, 81, 2772, 10.1073/pnas.81.9.2772 · DOI
  71. Mishra, 2014, Conformational dynamics of the nucleotide binding domains and the power stroke of a heterodimeric ABC transporter, eLife, 3, 10.7554/eLife.02740 · DOI
  72. Morozenko, 2014, Dipole moment and binding energy of water in proteins from crystallographic analysis, Journal of Chemical Theory and Computation, 10, 4618, 10.1021/ct500358r · DOI
  73. Murshudov, 1997, Refinement of macromolecular structures by the maximum-likelihood method, Acta Crystallographica Section D Biological Crystallography, 53, 240, 10.1107/S0907444996012255 · DOI
  74. Nguitragool, 2007, CLC Cl-/H+ transporters constrained by covalent cross-linking, PNAS, 104, 20659, 10.1073/pnas.0708639104 · DOI
  75. Nishikawa, 1972, Tertiary structure of proteins. I. representation and computation of the conformations, Journal of the Physical Society of Japan, 32, 1331, 10.1143/JPSJ.32.1331 · DOI
  76. Nosé, 1984, A unified formulation of the constant temperature molecular dynamics methods, The Journal of Chemical Physics, 81, 511, 10.1063/1.447334 · DOI
  77. Olsson, 2011, PROPKA3: Consistent Treatment of Internal and Surface Residues in Empirical p K a Predictions, Journal of Chemical Theory and Computation, 7, 525, 10.1021/ct100578z · DOI
  78. Osteen, 2008, Insights into the ClC-4 transport mechanism from studies of Zn2+ inhibition, Biophysical Journal, 95, 4668, 10.1529/biophysj.108.137158 · DOI
  79. Palmieri, 2010, Structure and function of mitochondrial carriers - role of the transmembrane Helix P and G residues in the gating and transport mechanism, FEBS Letters, 584, 1931, 10.1016/j.febslet.2009.10.063 · DOI
  80. Park, 2019, Mutation of external glutamate residue reveals a new intermediate transport state and anion binding site in a CLC Cl-/H+ antiporter, PNAS, 116, 17345, 10.1073/pnas.1901822116 · DOI
  81. Park, 2018, Structure of the CLC-1 chloride channel from Homo sapiens, eLife, 7, 10.7554/eLife.36629 · DOI · Paper page
  82. Phillips, 2005, Scalable molecular dynamics with NAMD, Journal of Computational Chemistry, 26, 1781, 10.1002/jcc.20289 · DOI · Paper page
  83. Phillips, 2012, Surprises from an unusual CLC homolog, Biophysical Journal, 103, L44, 10.1016/j.bpj.2012.08.063 · DOI
  84. Picollo, 2009, Basis of substrate binding and conservation of selectivity in the CLC family of channels and transporters, Nature Structural & Molecular Biology, 16, 1294, 10.1038/nsmb.1704 · DOI
  85. Picollo, 2012, Synergistic substrate binding determines the stoichiometry of transport of a prokaryotic H+/Cl− exchanger, Nature Structural & Molecular Biology, 19, 525, 10.1038/nsmb.2277 · DOI
  86. Pusch, 2002, Myotonia caused by mutations in the muscle chloride channel gene CLCN1, Human Mutation, 19, 423, 10.1002/humu.10063 · DOI
  87. Radestock, 2011, The alternating-access mechanism of MFS transporters arises from inverted-topology repeats, Journal of Molecular Biology, 407, 698, 10.1016/j.jmb.2011.02.008 · DOI
  88. Robertson, 2010, Design, function and structure of a monomeric ClC transporter, Nature, 468, 844, 10.1038/nature09556 · DOI
  89. Rostkowski, 2011, Graphical analysis of pH-dependent properties of proteins predicted using PROPKA, BMC Structural Biology, 11, 10.1186/1472-6807-11-6 · DOI
  90. Saviane, 1999, The muscle chloride channel ClC-1 has a double-barreled appearance that is differentially affected in dominant and recessive myotonia, Journal of General Physiology, 113, 457, 10.1085/jgp.113.3.457 · DOI
  91. Smart, 1996, HOLE: a program for the analysis of the pore dimensions of ion channel structural models, Journal of Molecular Graphics, 14, 354, 10.1016/S0263-7855(97)00009-X · DOI
  92. Smith, 2009, Characterization of dent's disease mutations of CLC-5 reveals a correlation between functional and cell biological consequences and protein structure, American Journal of Physiology-Renal Physiology, 296, F390, 10.1152/ajprenal.90526.2008 · DOI
  93. Sobacchi, 2007, GeneReviews
  94. Stein, 2015, A straightforward approach to the analysis of double Electron-Electron resonance data, Methods in Enzymology, 563, 531, 10.1016/bs.mie.2015.07.031 · DOI
  95. Stobrawa, 2001, Disruption of ClC-3, a chloride channel expressed on synaptic vesicles, leads to a loss of the Hippocampus, Neuron, 29, 185, 10.1016/S0896-6273(01)00189-1 · DOI
  96. Stockbridge, 2012, Fluoride resistance and transport by riboswitch-controlled CLC antiporters, PNAS, 109, 15289, 10.1073/pnas.1210896109 · DOI · Paper page
  97. Tanford, 1983, Mechanism of free energy coupling in active transport, Annual Review of Biochemistry, 52, 379, 10.1146/annurev.bi.52.070183.002115 · DOI
  98. Tang, 2011, Physiology and pathophysiology of CLC-1: mechanisms of a chloride channel disease, myotonia, Journal of Biomedicine and Biotechnology, 2011, 1, 10.1155/2011/685328 · DOI
  99. Veeramah, 2013, Exome sequencing reveals new causal mutations in children with epileptic encephalopathies, Epilepsia, 54, 1270, 10.1111/epi.12201 · DOI
  100. Walden, 2007, Uncoupling and turnover in a Cl-/H+ exchange transporter, Journal of General Physiology, 129, 317, 10.1085/jgp.200709756 · DOI · Paper page
  101. Wang, 2018, Modulating the chemical transport properties of a transmembrane antiporter via alternative anion flux, Journal of the American Chemical Society, 140, 16535, 10.1021/jacs.8b07614 · DOI
  102. Wang, 2009, Proton transport pathway in the ClC Cl-/H+ antiporter, Biophysical Journal, 97, 121, 10.1016/j.bpj.2009.04.038 · DOI
  103. Winn, 2011, Overview of the CCP4 suite and current developments, Acta Crystallographica. Section D, Biological Crystallography, 67, 235, 10.1107/S0907444910045749 · DOI · Paper page
  104. Wollnik, 1997, Identification of functionally important regions of the muscular chloride channel CIC-1 by analysis of recessive and dominant myotonic Mutations, Human Molecular Genetics, 6, 805, 10.1093/hmg/6.5.805 · DOI
  105. Wu, 2014, CHARMM-GUI membrane builder toward realistic biological membrane simulations, Journal of Computational Chemistry, 35, 1997, 10.1002/jcc.23702 · DOI
  106. Zdebik, 2008, Determinants of anion-proton coupling in mammalian endosomal CLC proteins, Journal of Biological Chemistry, 283, 4219, 10.1074/jbc.M708368200 · DOI
  107. Zhang, 2000, Mechanism of inverted activation of ClC-1 channels caused by a novel, The Journal of Biological Chemistry, 275, 2999, 10.1074/jbc.275.4.2999 · DOI
  108. Zhang, 1996, Hydrophilicity of cavities in proteins, Proteins: Structure, Function, and Genetics, 24, 433, 10.1002/(SICI)1097-0134(199604)24:4<433::AID-PROT3>3.0.CO;2-F · DOI

Cited by

Sorted by citations

Metadata

Authors
Chavan, T. S., Cheng, R. C., Jiang, T., Mathews, I. I., Stein, R. A., Koehl, A., Mchaourab, H. S., Tajkhorshid, E., & Maduke, M.
Affiliations
  • Department of Molecular & Cellular Physiology, Stanford University School of Medicine, Stanford, United States
  • NIH Center for Macromolecular Modeling and Bioinformatics, Beckman Institute for Advanced Science and Technology, Department of Biochemistry, Center for Biophysics and Quantitative Biology, University of Illinois at Urbana-Champaign, Urbana, United States
  • Stanford Synchrotron Radiation Lightsource, Stanford University, Menlo Park, United States
  • Department of Molecular Physiology and Biophysics, Vanderbilt University, Nashville, United States
Venue
eLife
Published
2020-04-20
Volume
9
ISSN
2050-084X
Cited by
49
References
0
Language
en
Funders
  • National Institutes of Health (GM113195, P41GM103393, P41-GM104601)
  • American Heart Association (17POST33670553)
  • U.S. Department of Energy (DE-AC02-06CH11357)
  • University of Illinois at Urbana-Champaign (Blue Waters at National Center for Supercomputing Applications)
  • Extreme Science and Engineering Discovery Environment (MCA06N060)

About these checks

Registry, retraction, Cites and statistics results are computed, not judged, with one exception: a printed reference that no index lists is read once by a model before it counts as a citation error. Claims are extracted by a model and kept only when their quote appears verbatim in the text; each cited source is then checked, with a model’s help, for whether it says what the claim relies on. Those verdicts can be wrong — read the claim’s quote and the cited source before relying on one.

Statistics and arithmetic are recomputed, not judged.

Confidence bands are shown only for fields calibrated on our annotated test set. None is calibrated yet, so no band is shown.

What counts as a claim ›How we measure confidence ›How we check this ›

Are you an author, or do you see a problem with this page? Request a review